 BrainBase
a curated knowledgebase for brain diseases
BrainBase
a curated knowledgebase for brain diseases

1. Overview
Brain is the central organ of the nervous system. It not only controls thought, memory, speech, and movement, but also regulates the function of many organs. However, any brain disease that alters brain function or structure, can seriously affect human health, particularly like glioma, one of the most common types of brain tumors. Powered by high-throughput sequencing technologies, great efforts have been devoted to deciphering complex associations between genes and brain diseases from multiple different omics levels. However, these valuable omics data and knowledge associations are distributed in different resources throughout the world. Although several related databases (mentioned below) have been constructed, they lack comprehensive integration of both gene-disease associations and multi-omics datasets, posing great challenges for better understanding molecular mechanisms of brain diseases.
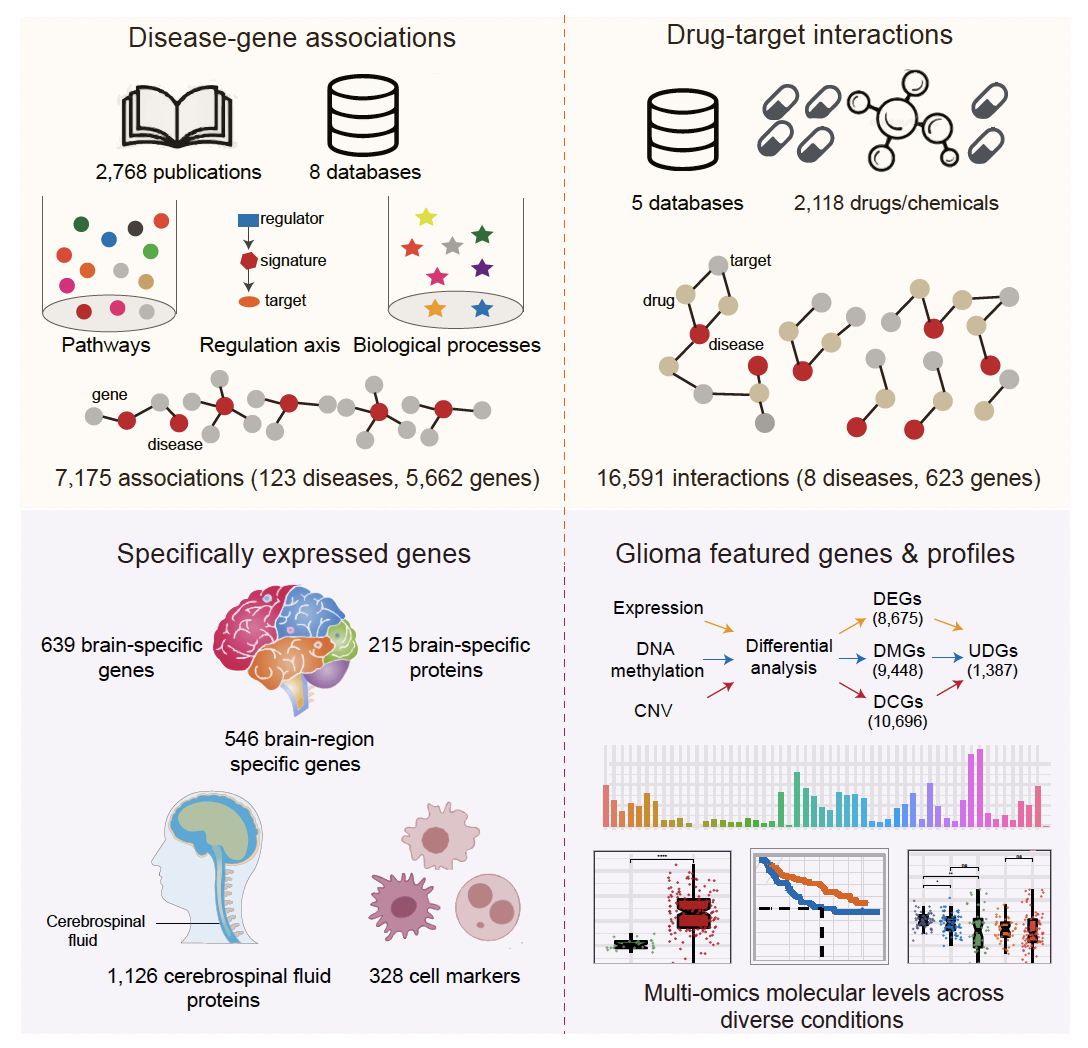
Here we present BrainBase (https://ngdc.cncb.ac.cn/brainbase), a curated knowledgebase of brain diseases. Based on manual curation of 2,729 published articles and information extraction from related databases, BrainBase features comprehensive integration of 6,690 gene associations with a total of 123 brain diseases from multiple molecular levels. Based on information of ChEMBL, DrugBank, CMap, PharmGKB and CTD drug databases, BrainBase integrates 16,591 drug-target associations. With a particular focus on glioma, BrainBase houses a comprehensive collection of glioma multi-omics datasets from TCGA, GTEx, GEO, Ivy Glioblastoma Atlas Project, Human Protein Atlas, etc., accordingly yielding a list of featured genes and presenting multi-omics molecular profiles for glioma. Moreover, BrainBase provides user-friendly web interfaces for data browsing and visualization and makes all analyzed results and curated associations publicly downloadable.
Collectively, BrainBase integrates not only valuable knowledge associations curated from published literatures but also comprehensive molecular profiles, particularly for glioma, through multi-omics data analysis. Thus, it bears great promise to serve as a valuable knowledgebase for brain studies.
Notice: since glioma is the most severe tumor in brain, multi-omics datasets were collected and analyzed.
Overview of BrainBase
2. Gene name conversion
In order to provide consistent names for all collected genes, we unified the gene names with the gene symbol-alias conversion table of HGNC database (2021.4.23 version). As a result, gene names collected from publications and other resources have been converted. Users can obtain the detailed gene symbol and alias information in each gene page.
3. Curation models
The brain disease-gene associations were collected and curated from public databases and published literatures. Specifically, the disease-gene associations of Developmental Brain Disorders Database (DBDB), Brain Disease Knowledgebase, HMDD, LncBook, EWAS Atlas, GWAS Catalog, EDK and CRMarker were integrated and the redundant/questionable associations were removed.
Different studies/databases use different criteria to define the disease-gene associations (e.g., p-value<10-3 adopted in Ref. (PMID: 30572911), 10-9 in Ref. (PMID: 28527107); p-value<10-5 in GWAS Catalog, p-value<10-4 in EWAS Atlas). Considering diverse sampling sizes and different experimental conditions in brain related studies, brain disease associations curated from literature/databases were those significant associations reported in their corresponding publications. This strategy is also applicable to the meta-analysis studies.
Particularly, for glioma, we create a curation model with controlled vocabulary, which covers omics level, associated pathway, tumor process, sample information, description, PMID, journal information, etc. The details about the curation model and controlled vocabulary are described below.
3.1 Disease-gene associations
| Data type | Description | Value |
|---|---|---|
| Disease | Disease name identifier | Disease name |
| Gene symbol | Gene identifier | Gene name or alias |
| Type | Controlled vocabulary | miRNA, lncRNA, mRNA, pseudogene, circRNA |
| PMID | Publication in which the association is described | PubMed ID |
3.2 Glioma-gene associations
Considering that glioma is highly malignant among brain diseases and associated with either aberrant activities of genes or abnormal upstream regulators/downstream targets, here we propose a curation model with application to glioma to standardize the curation process, and establish controlled vocabularies and standardized descriptive terms (that are abstracted and categorized based on literature curation) to depict each item.
| Data type | Description | Value |
|---|---|---|
| Disease | Controlled vocabulary | Glioma, Glioblastoma, Medulloblastoma |
| Grade | Controlled vocabulary | G2, G3, G4 |
| Gene symbol | Gene identifier | Gene name or alias |
| Type | Controlled vocabulary | miRNA, lncRNA, mRNA, pseudogene, circRNA |
| Omics | Controlled vocabulary | Genomics, Transcriptomics, Epigenomics, Proteomics |
| Alteration | Controlled vocabulary | mutaion, wildtype, up-regulation, down-regulation, histone mutation, activation, alternative splicing, copy number variation, DNA methylation, RNA methylation, gene fusion, inhibition, overexpression, unmethylation, histone acetylation |
| Pathway | Pathway descriptions based on literatures | For example: Notch, PI3K/AKT/mTOR, Purine biosynthesis. |
| Tumor Process | Controlled vocabulary | proliferation, invasion, supression, aggressiveness, growth, oncogenesis, transformation, migration, progression, angiogenesis, tumorigenesis, progression, diffusion, apoptosis, formation, infiltration, maintenance, self-renewal, metastasis, stemness, activation, viability, differentiation, chemoresistance, vascularization, tumor-initiating, autophagy, regrowth, reduction, expansion, division, radioresistance, clonogenicity |
| Rugulator Type | Controlled vocabulary | protein, mRNA, miRNA, circRNA, pseudogene, lncRNA |
| Regulator Name | Gene identifier | Gene name or alias |
| Rugulator Effect | Controlled vocabulary | promote, inhibit, activate, cooperation, co-target |
| Target Type | Controlled vocabulary | protein, mRNA, miRNA, circRNA, pseudogene, lncRNA, pathway |
| Target Name | Gene/pathway name | Gene name or pathway description |
| Target Effect | Controlled vocabulary | promote, inhibit, activate, forming complex, phosphorylate, demethylation |
| PMID | Publication in which the association is described | PubMed ID |
3.3 Drug-target interactions
BrainBase incorporates a large number of 16,591 drug-target interactions involving 2,118 drugs/chemicals and 623 genes and specifically focusing on 8 common diseases. The curation model of these interactions are described below.
| Data type | Description | Value |
|---|---|---|
| Drug | Drug/chemical name | For example: Acetaminophen and 7,8-Dihydro-7,8-dihydroxybenzo(a)pyrene 9,10-oxide |
| Disease | Controlled vocabulary | Glioma, Autism Spectrum Disorder, Alzheimer's Disease, Cerebral Palsy, Epilepsy, Parkinson's Disease, Medulloblastoma, Glioblastoma |
| Target | Gene identifier | Gene name |
| Source | Drug/chemical database | ChEMBL, DrugBank, CMap, PharmGKB, CTD |
| PMID | Publication in which the interaction is described | PubMed ID |
4. Glioma
4.1 Multi-omics profiles
BrainBase collects a total of 21 datasets across more than 16,000 samples from GEO, CGGA, HPA, GTEx, Ivy GAP and TCGA, covering multi-omics (genomics, transcriptomics, epigenomics and proteomics) and multiple kinds of samples (normal brain, low-grade glioma, high-grade glioma and different glioma subtypes). The datasets can be downloaded from the website ftp://download.big.ac.cn/brainbase/. The summary of multi-omics datasets is below:
| Dataset | Sources | Omics type | #Samples | #Population country/race | Reference |
|---|---|---|---|---|---|
| TCGA_CNV | TCGA | CNV | 1018 | Mostly white | 26824661 |
| TCGA_SNV | TCGA | SNV | 896 | Mostly white | 26824661 |
| CGGA_301 | CGGA | Expression (Microarray) | 301 | China | 24550449, 23090983 |
| CGGA_325 | CGGA | Expression (RNA-Seq) | 325 | China | 25135958 |
| CGGA_693 | CGGA | Expression (RNA-Seq) | 693 | China | - |
| GSE111260 | GEO | Expression (Microarray) | 70 | Norway | 32171051 |
| GSE16011 | GEO | Expression (Microarray) | 284 | Netherlands | 19920198 |
| GSE4290 | GEO | Expression (Microarray) | 180 | USA | 16616334 |
| GSE50161 | GEO | Expression (Microarray) | 47 | USA | 24078694 |
| GSE59612 | GEO | Expression (RNA-Seq) | 92 | USA | 25114226 |
| GTEx | GTEx | Expression (RNA-Seq) | 11,688 | mostly white | 23715323 |
| Ivy_GAP | Ivy GAP | Expression (RNA-Seq) | 122 | - | 29748285 |
| TCGA_expression | TCGA | Expression (RNA-Seq) | 607 | mostly white | 26824661 |
| CGGA_methylation | CGGA | Methylation (27K) | 159 | China | 22960273 |
| GSE36278 | GEO | Methylation (450K) | 142 | Germany | 23079654 |
| GSE50923 | GEO | Methylation (27K) | 78 | USA | 24586730 |
| GSE60274 | GEO | Methylation (450K) | 68 | Switzerland | 25622821 |
| GSE61160 | GEO | Methylation (450K) | 51 | Spain | 23689617 |
| TCGA_methylation | TCGA | Methylation (27K+450K) | 862 | Mostly white | 26824661 |
| GSE83710 | GEO | Protein | 133 | Japan | 28031287 |
| HPA_brain | HPA | Protein | - | - | 25613900 |
In the pages of multi-omics profiles, Student's t test is used for statistical testing and statistical significance is coded as follows: ****: p-value <= 0.0001;***: p-value <= 0.001;**: p-value <= 0.01;*: p-value <= 0.05;ns: p-value > 0.05.
4.2 Featured genes
Based on glioma multi-omics datasets, Student's t test was performed between 11 pairs at multi-omics levels, including:
E4: 4 pairs at the expression level (Glioma vs Normal; GBM vs LGG; IDH wildtype vs IDH mutation; 1p19q noncodel vs 1p19q codel)
M4: 4 pairs at the DNA methylation level (Glioma vs Normal; GBM vs LGG; IDH wildtype vs IDH mutation; 1p19q noncodel vs 1p19q codel)
C3: 3 pairs at the CNV level (GBM vs LGG; IDH wildtype vs IDH mutation; 1p19q noncodel vs 1p19q codel)
As a result, four groups of featured genes were identified, as detailed below:
Ubiquitously differential genes (UDGs): Genes exhibit significant differences ubiquitously in E4, M4 and C3 (p-value < 0.001, FDR < 0.01). For example: MGMT, PRKCG.
Differentially expressed genes (DEGs): Genes exhibit significant differences in E4 (p-value < 0.001, FDR < 0.01). For example: IDH1.
Differentially DNA-methylated genes (DMGs): Genes exhibit significant differences in M4 (p-value < 0.001, FDR < 0.01). For example: ADAR.
Differential CNV genes (DCGs): Genes exhibit significant differences in C3 (p-value < 0.001, FDR < 0.01). For example: EGFR.
5. Specific genes (normal)
Five types of specific genes are included in BrainBase. They are brain-specific genes, brain-region-specific genes, brain-region proteins, cerebrospinal fluid proteins and cell markers. The details of these genes are described below.
5.1 Brain-specific genes
To identify brain-specific genes, we used the RNA-Seq dataset from GTEx (2016-01-15; v7), which contains 11,688 samples across 53 tissue sites of 714 donors. Considering that several tissues have multiple different sites, gene expression levels were averaged over sites that are from the same tissue. To reduce background noise, genes with maximal expression levels smaller than 1TPM (Transcripts Per Million) were removed. Finally, based on the expression levels across 31 tissues, we calculated the tissue specificity index τ (Itai, 2005) for each gene to identify tissue-specific genes. τ is valued between 0 and 1, where 0 represents housekeeping genes that are consistently expressed in different tissues, and 1 indicates tissue-specific genes that are exclusively expressed in only one tissue. In this study, brain-specific genes were defined as those genes that are maximally expressed in the brain with τ > 0.9. As a consequence, a list of 639 brain-specific genes were identified.
5.2 Brain-region-specific genes
Based on the GTEx dataset, similar to the method of calculating brain-specific genes mentioned above, 546 brain-region-specific genes of 13 brain regions were identified.
5.3 Brain-specific proteins
The brain-specific proteins were sourced from the Human Protein Atlas. 215 genes were identified, which show at least four-fold higher mRNA level in brain tissue compared to any other tissue and have protein expression evidence in brain.
5.4 Cerebrospinal fluid proteins
To achieve the detectability in the periphery, 1,126 proteins detected in cerebrospinal fluid with their fluorescence intensity were obtained from GEO (GSE83710).
5.5 Cell markers
To provide a comprehensive and accurate resource of cell markers for brain, 439 brain cell markers were collected from CellMarker.
6. Database Usage
6.1 Home page
The home page (https://ngdc.cncb.ac.cn/brainbase) summarizes the main contents in BrainBase (including 100 brain diseases, 6941 disease-gene associations, 2118 drugs, 2478 publications, 656 signatures, profiles of 3 omics, 4 groups of featured genes and 5 types of specific genes).
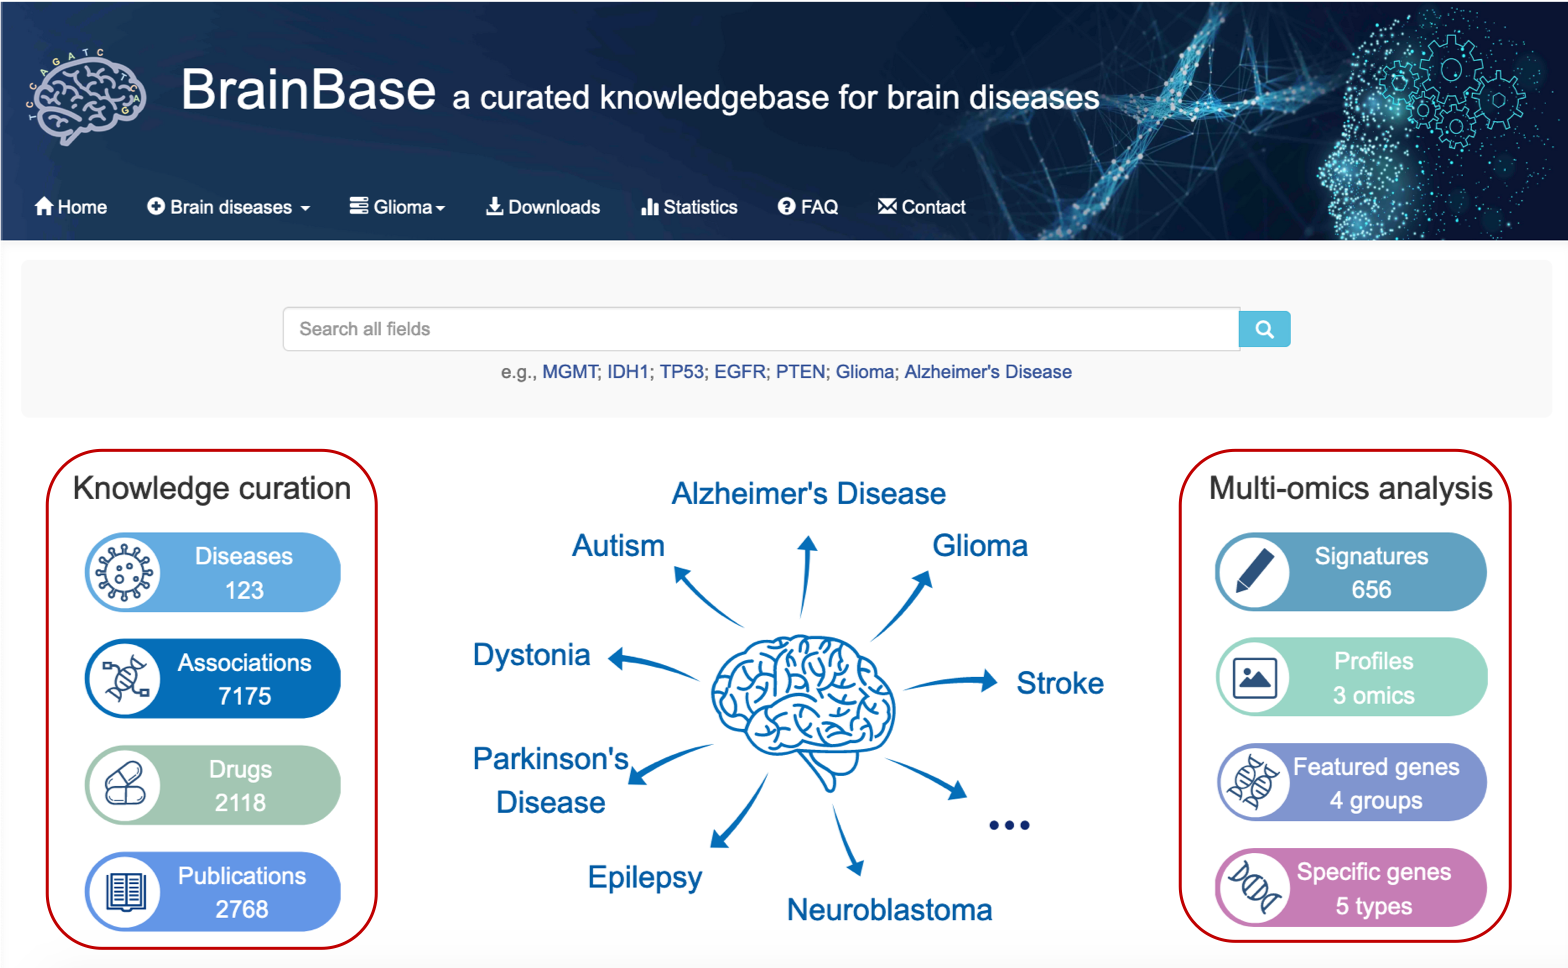
6.2 Browse genes
The Genes page integrates the genes which are associated with brain/brain diseases (including brain diseases associated genes reported by literatures/public databases, drug targets and 5 types of specific genes).

6.3 Browse brain diseases
The Diseases page integrates brain disease-gene associations. Users can select the disease, gene type and symbol to get the associations, and users also can click the PMID/Source link to get the detailed information.

6.4 Browse drugs
The Drugs page integrates drug-disease associations. Users can search the drug/disease/target name to get the detailed information.

6.5 Browse glioma omics signatures and profiles
The Glioma Omics Signatures page shows how the genes are associated with glioma. Users can select the disease name, omics level, gene type and name of hot gene to get the detailed information.
Glioma multi-omics profiles are shown in BrainBase: genome, transcriptome and epigenome. In each omics page, users can search the gene symbol and select the sample pair to obtain the omics profiles supported by different datasets.

6.6 Browse glioma featured genes
The Glioma Featured Genes page shows genes which exhibit significant differences. Users can choose the gene group which they are interested in and then obtain the featured genes calculated by different datasets.

7. Related publications and databases
Computational identification and characterization of glioma candidate biomarkers through multi-omics integrative profiling.Biology Direct 2020. (google scholar citation: 8)
CGGA, Ivy GAP, GlioVis, Developmental Brain Disorders Database, Brain Disease Knowledgebase