Examples
1. Web Usage
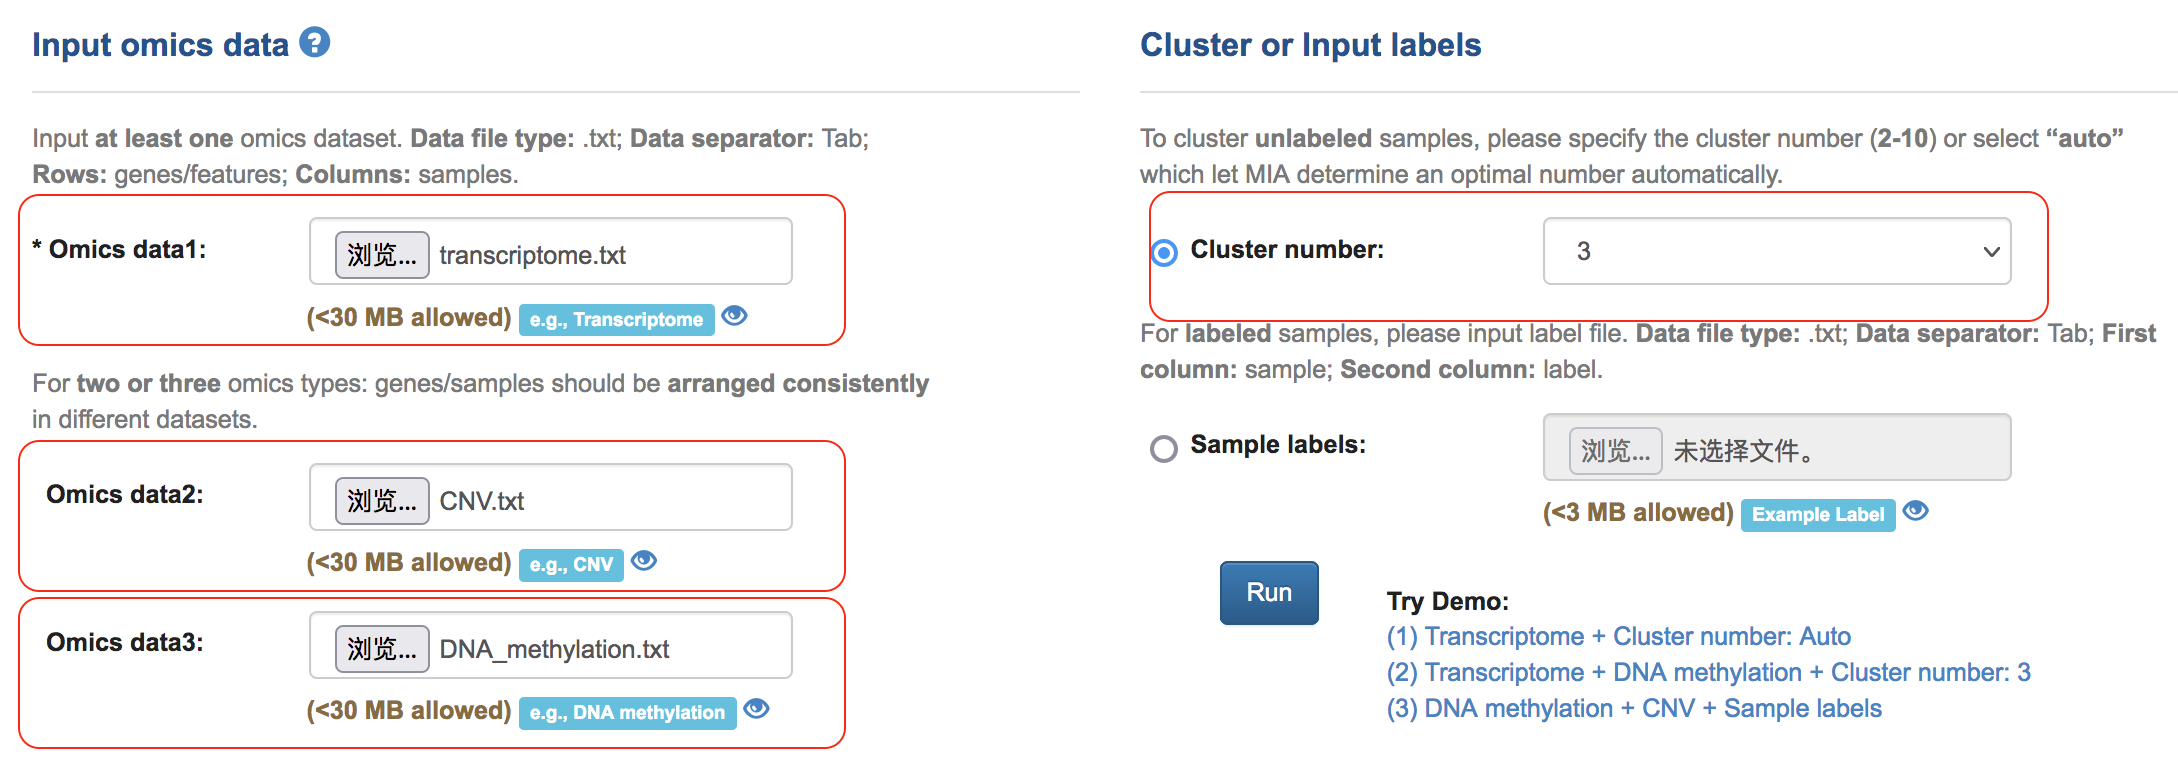
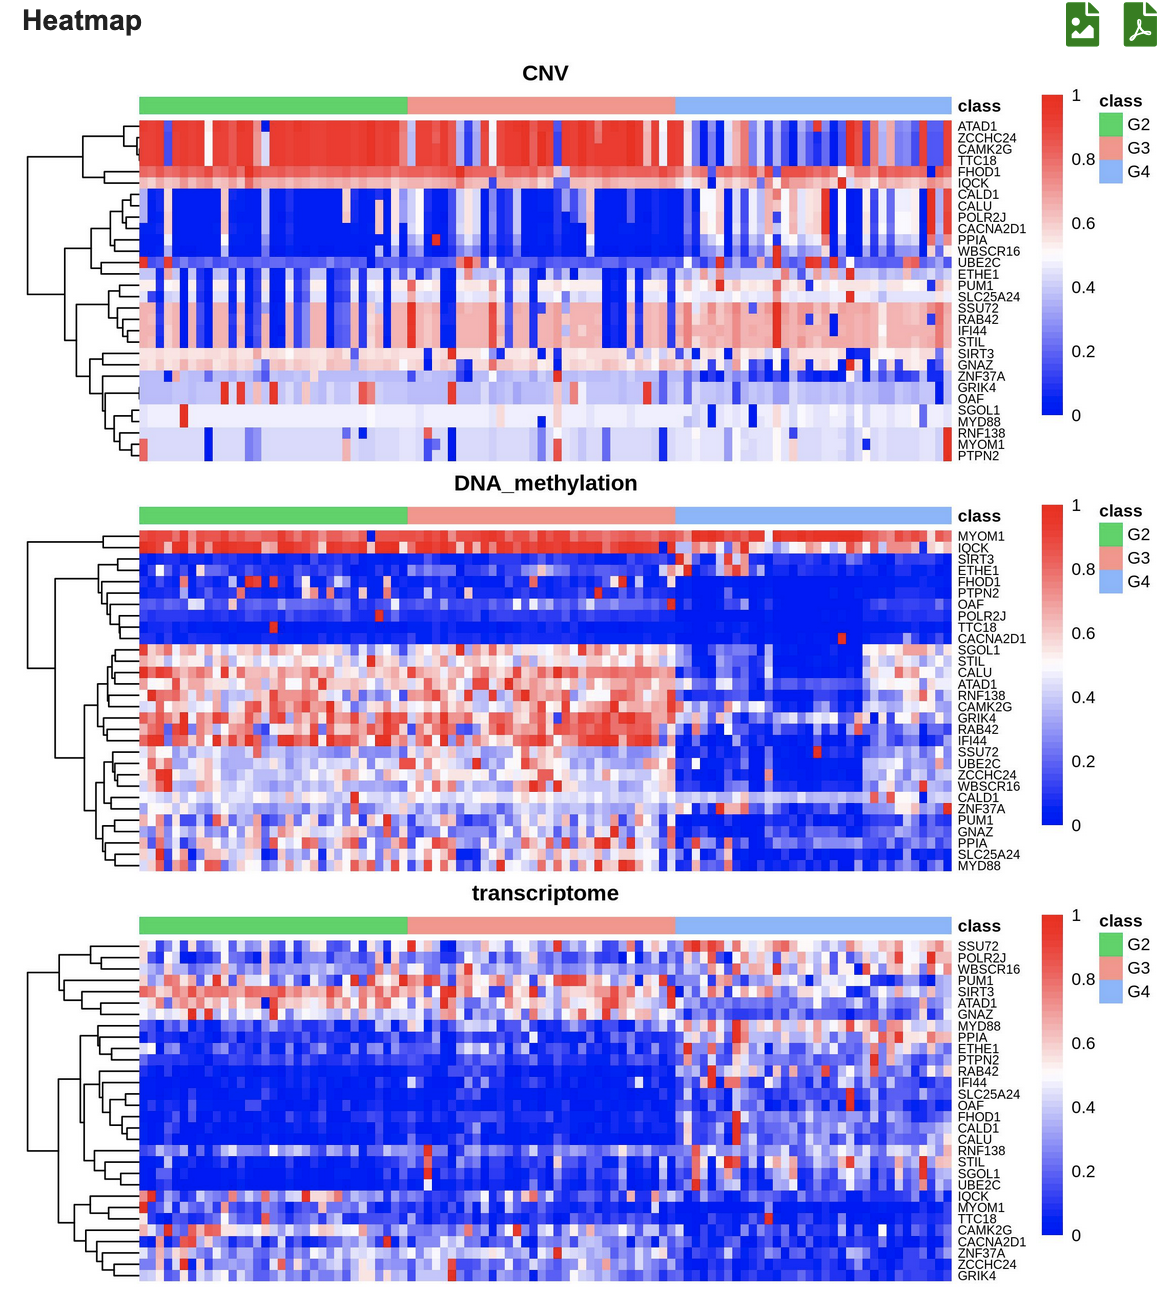
Example1: Clustering 100 unlabeled samples based on three-omics data (transcriptome + DNA methylation + CNV)
(1) Input datasets and select “3” from the cluster number drop-down box
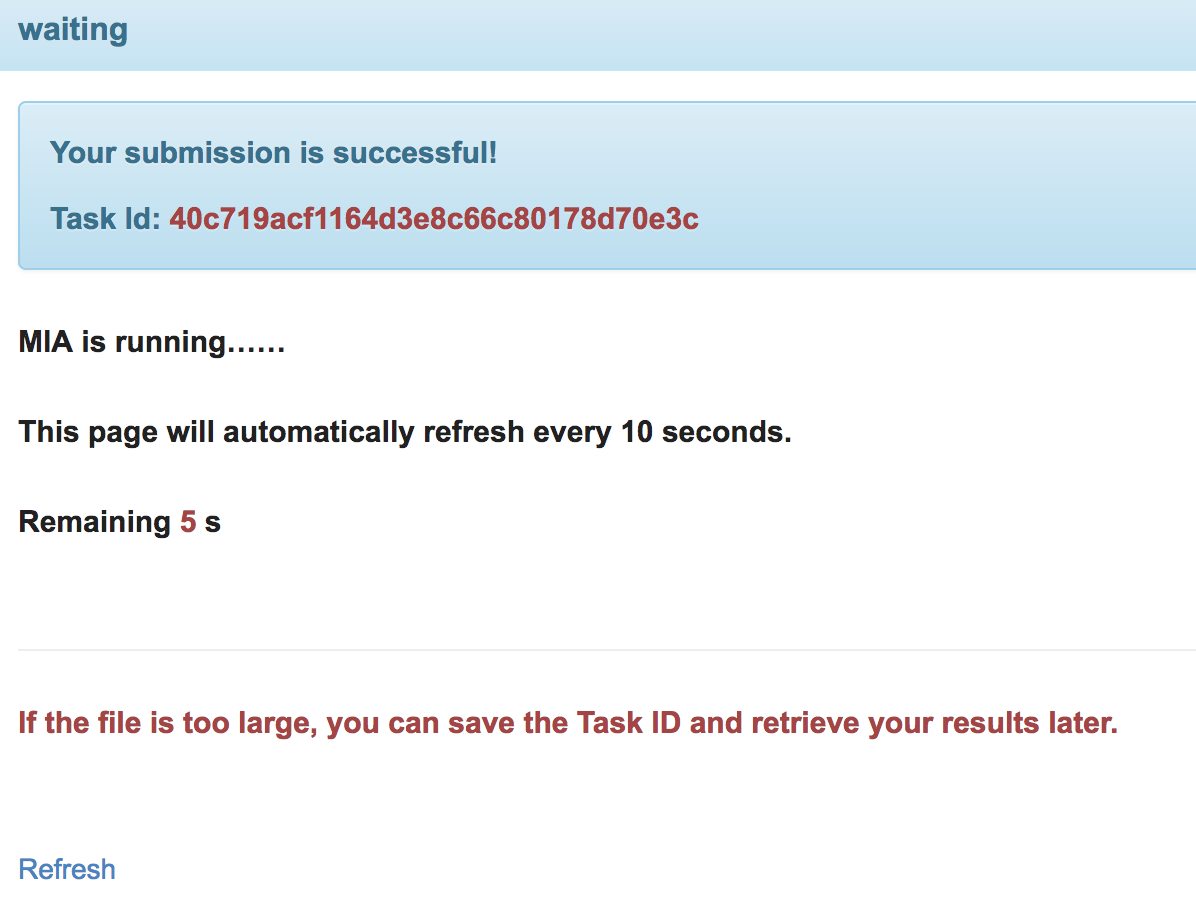
(2) It may take some seconds to the result page. Users also can save the Task ID and retrieve the results later by inputting the Task ID in the homepage.

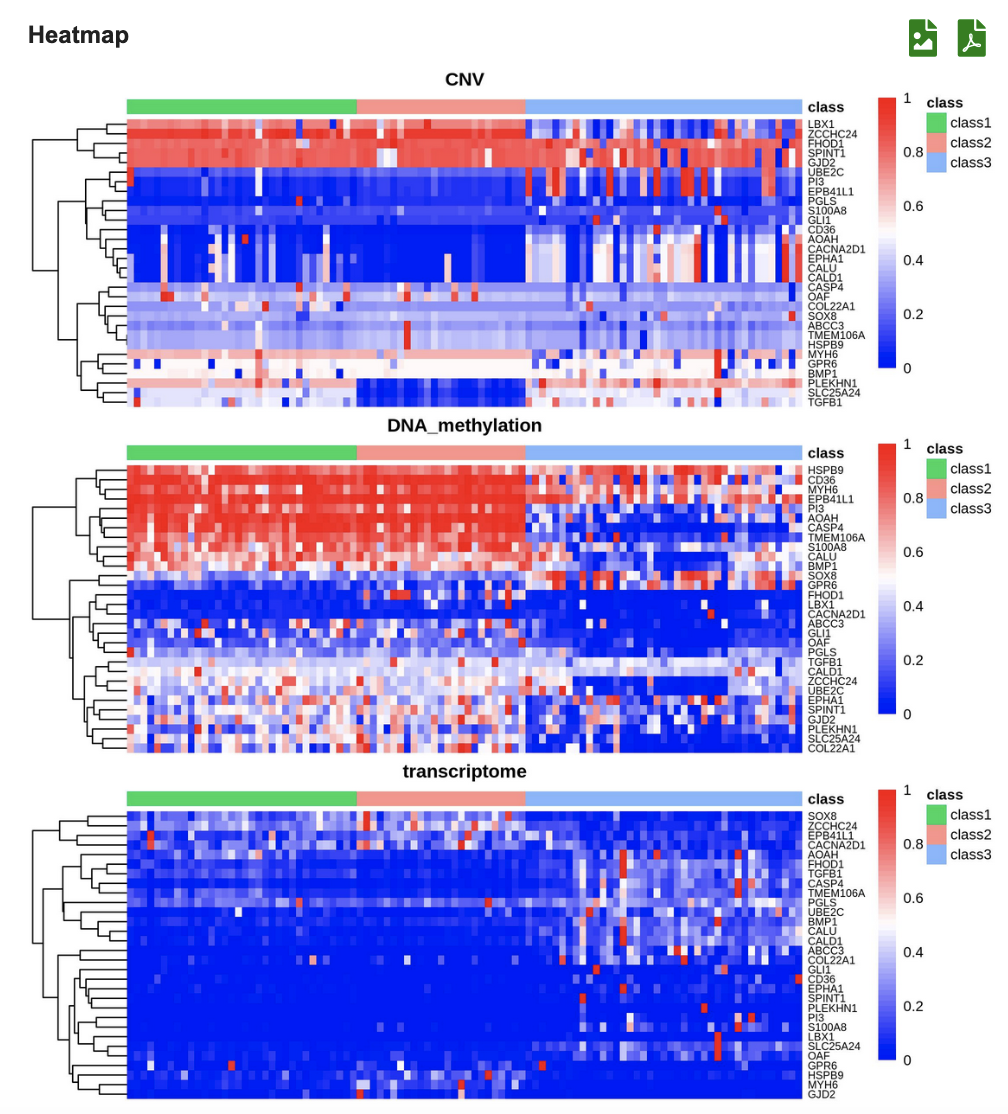
(3) The clustering results are displayed in three heatmaps associated with three omics types,and could be viewed in the scale of 30/50/80/100 feature genes.
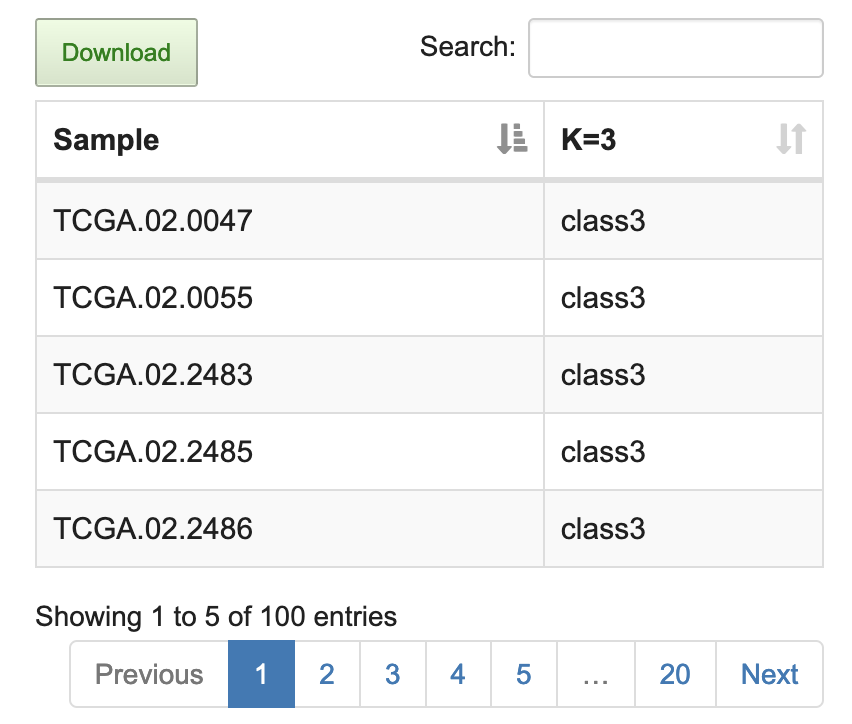
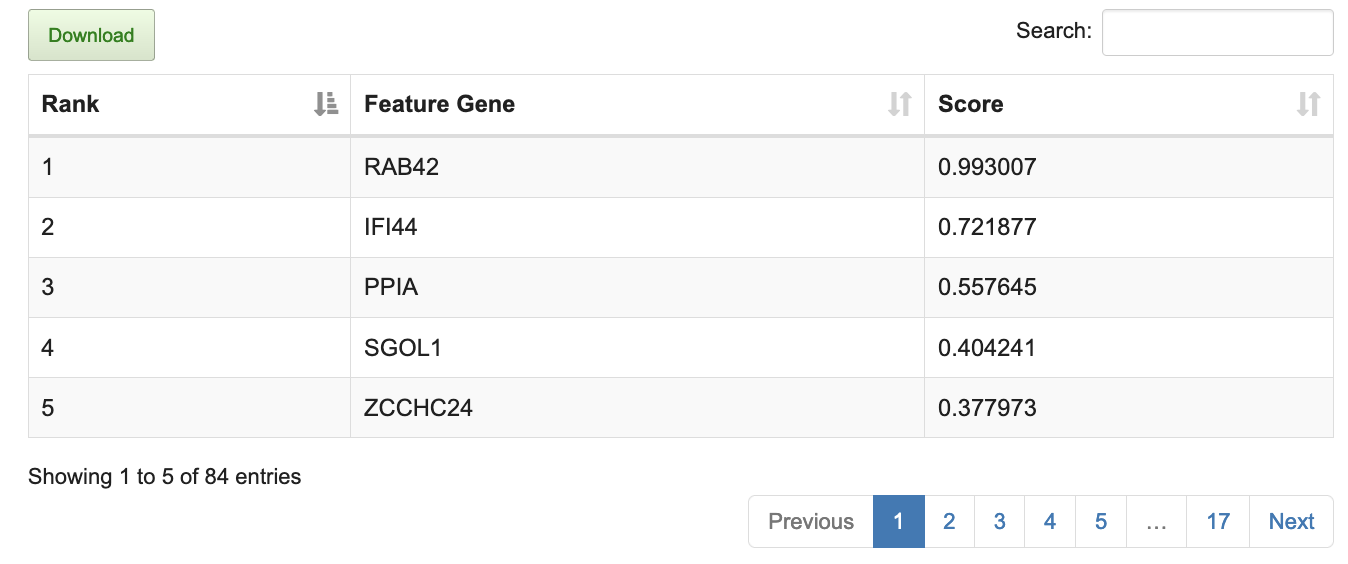
(4) Clustering results and feature genes contributing to the clustering ranked by score are listed in the table.
Example2: Identifying feature genes with transcriptome data based on known classification
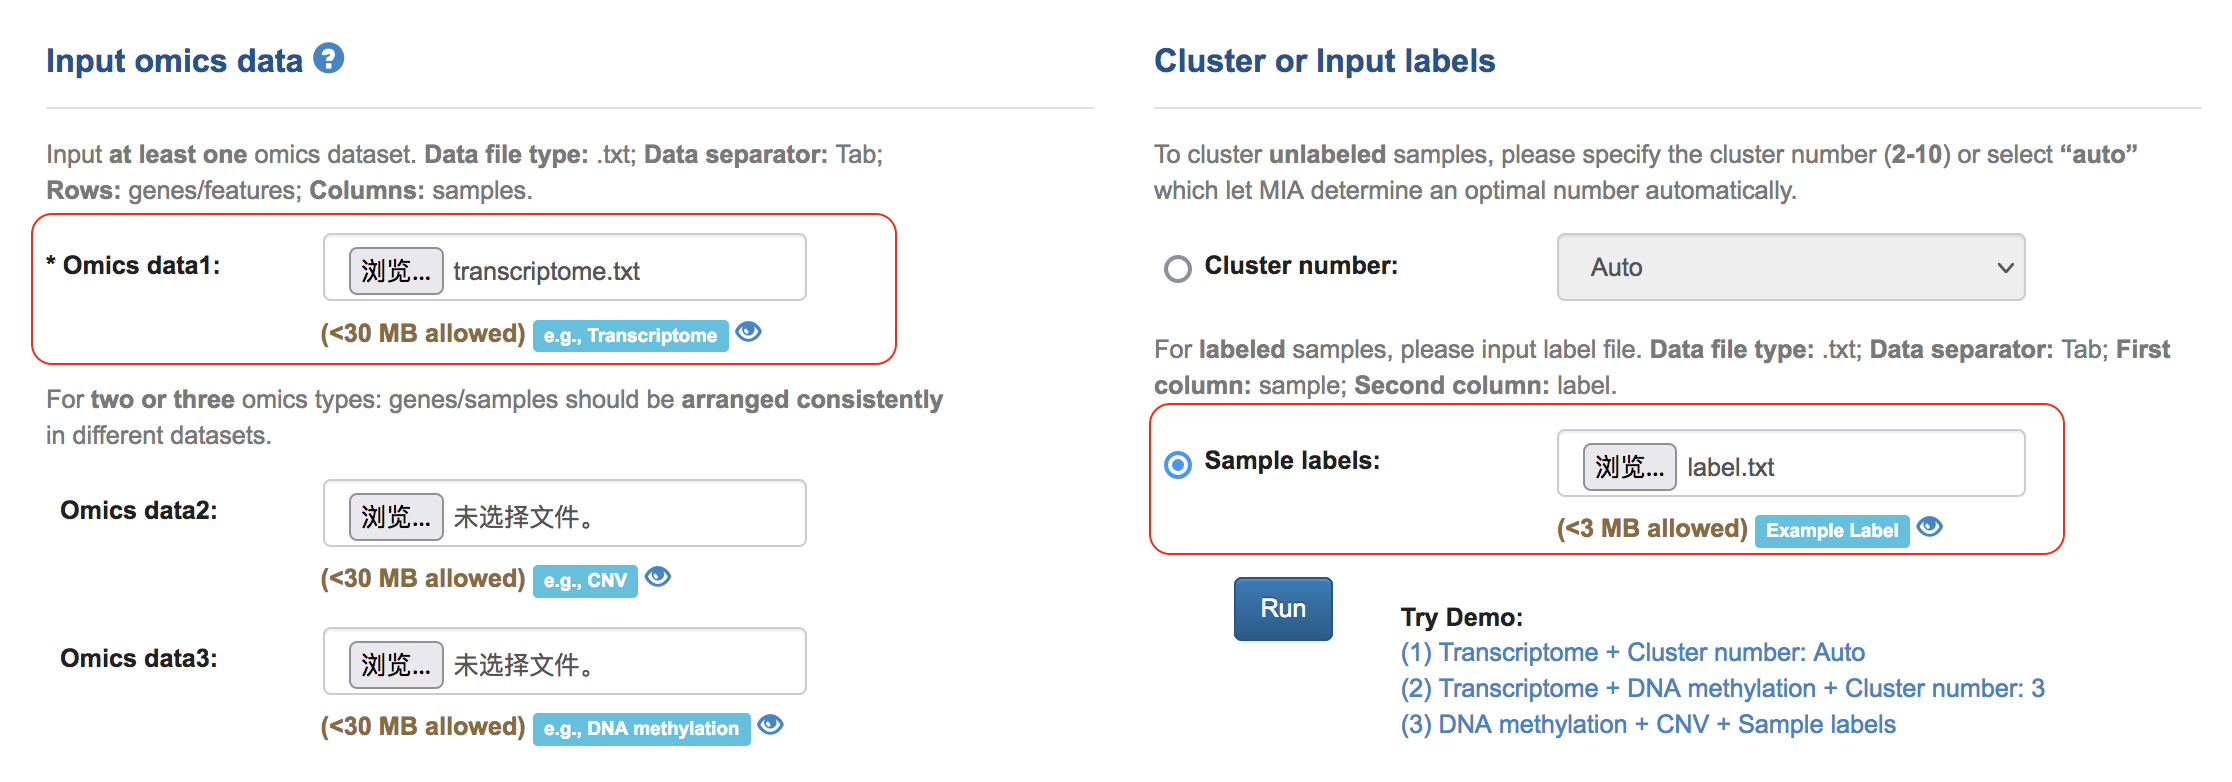
(1) Input data matrix and sample label
(2) It may take some seconds to the result page. Users can also save the Task ID and retrieve the results later by inputting the Task ID in the homepage.
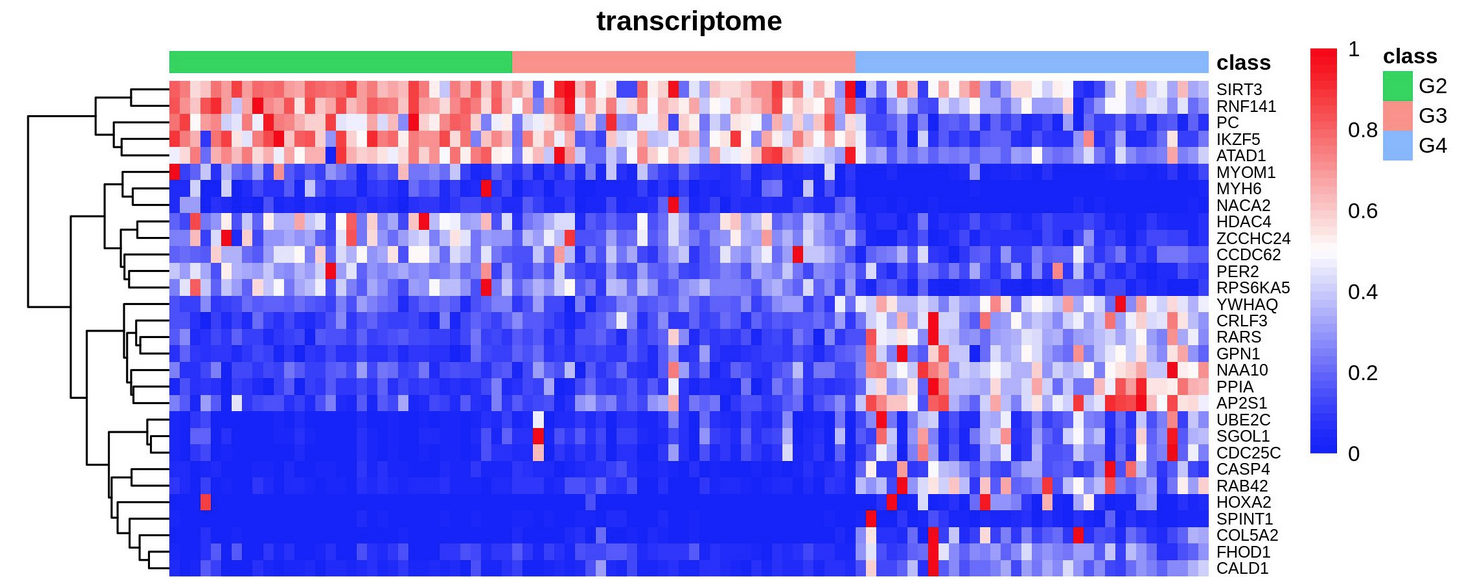
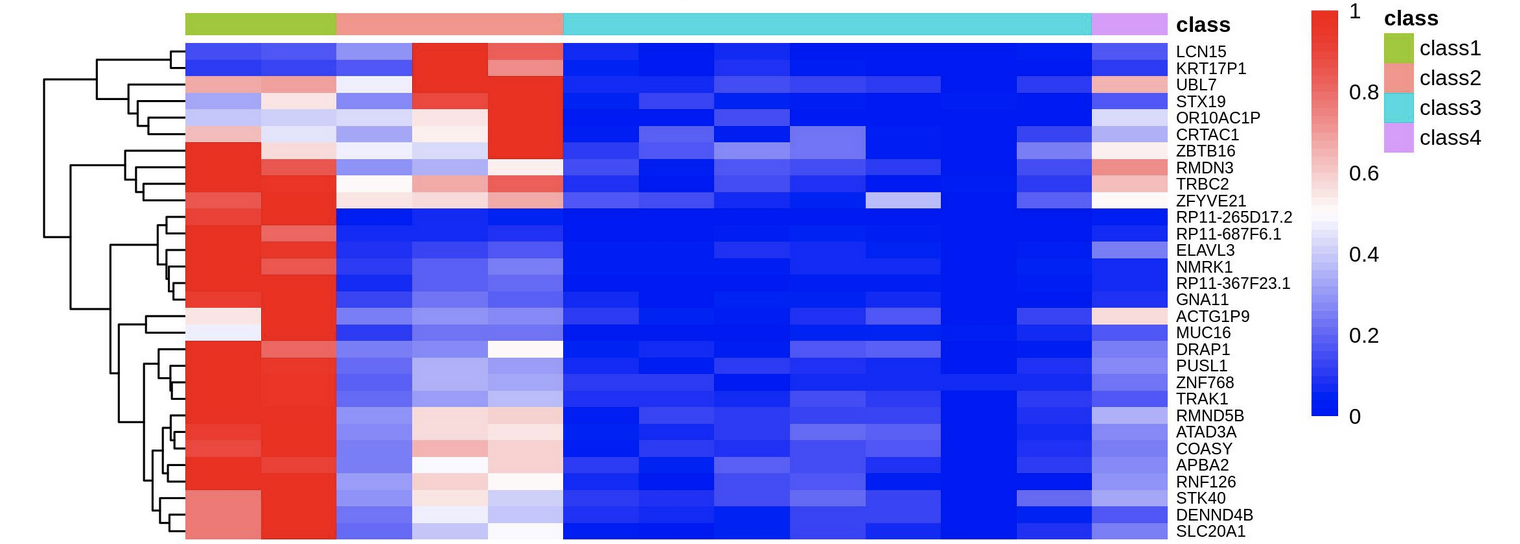
(3) View heatmap in the scale of 30/50/80/100 feature genes.
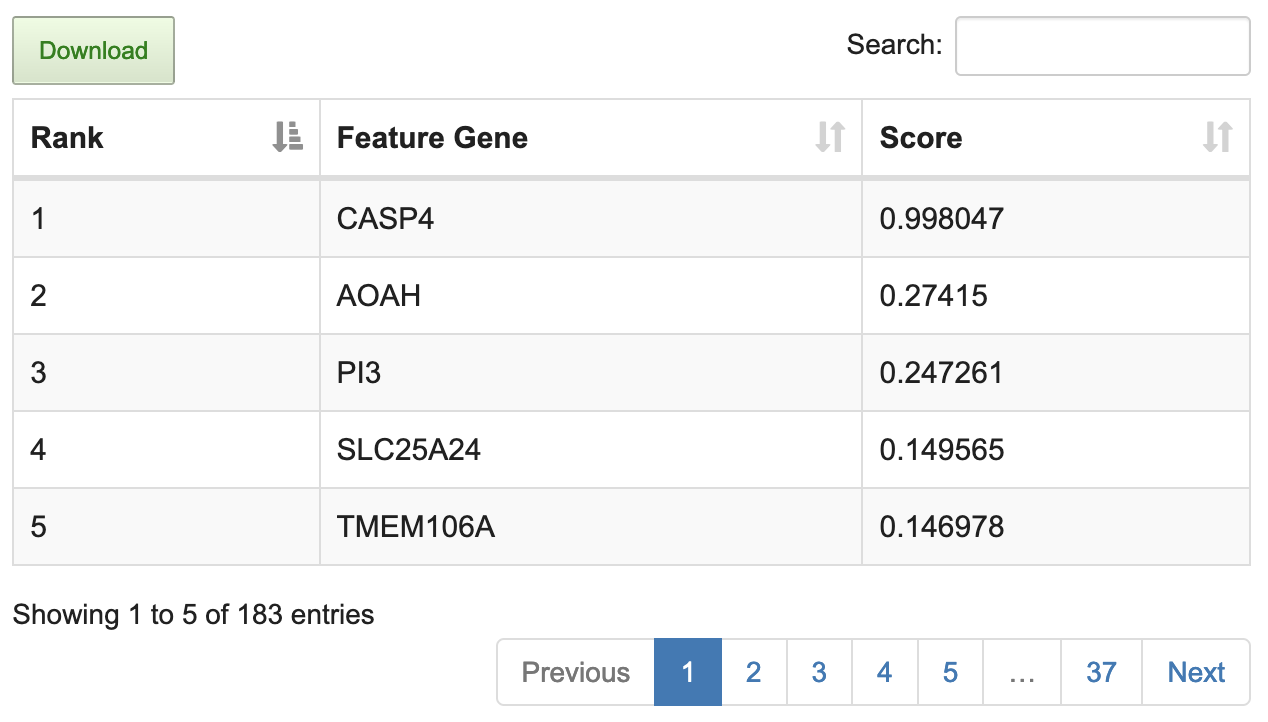
(4) The feature genes contributing to the classification are listed in the table ranked by score.
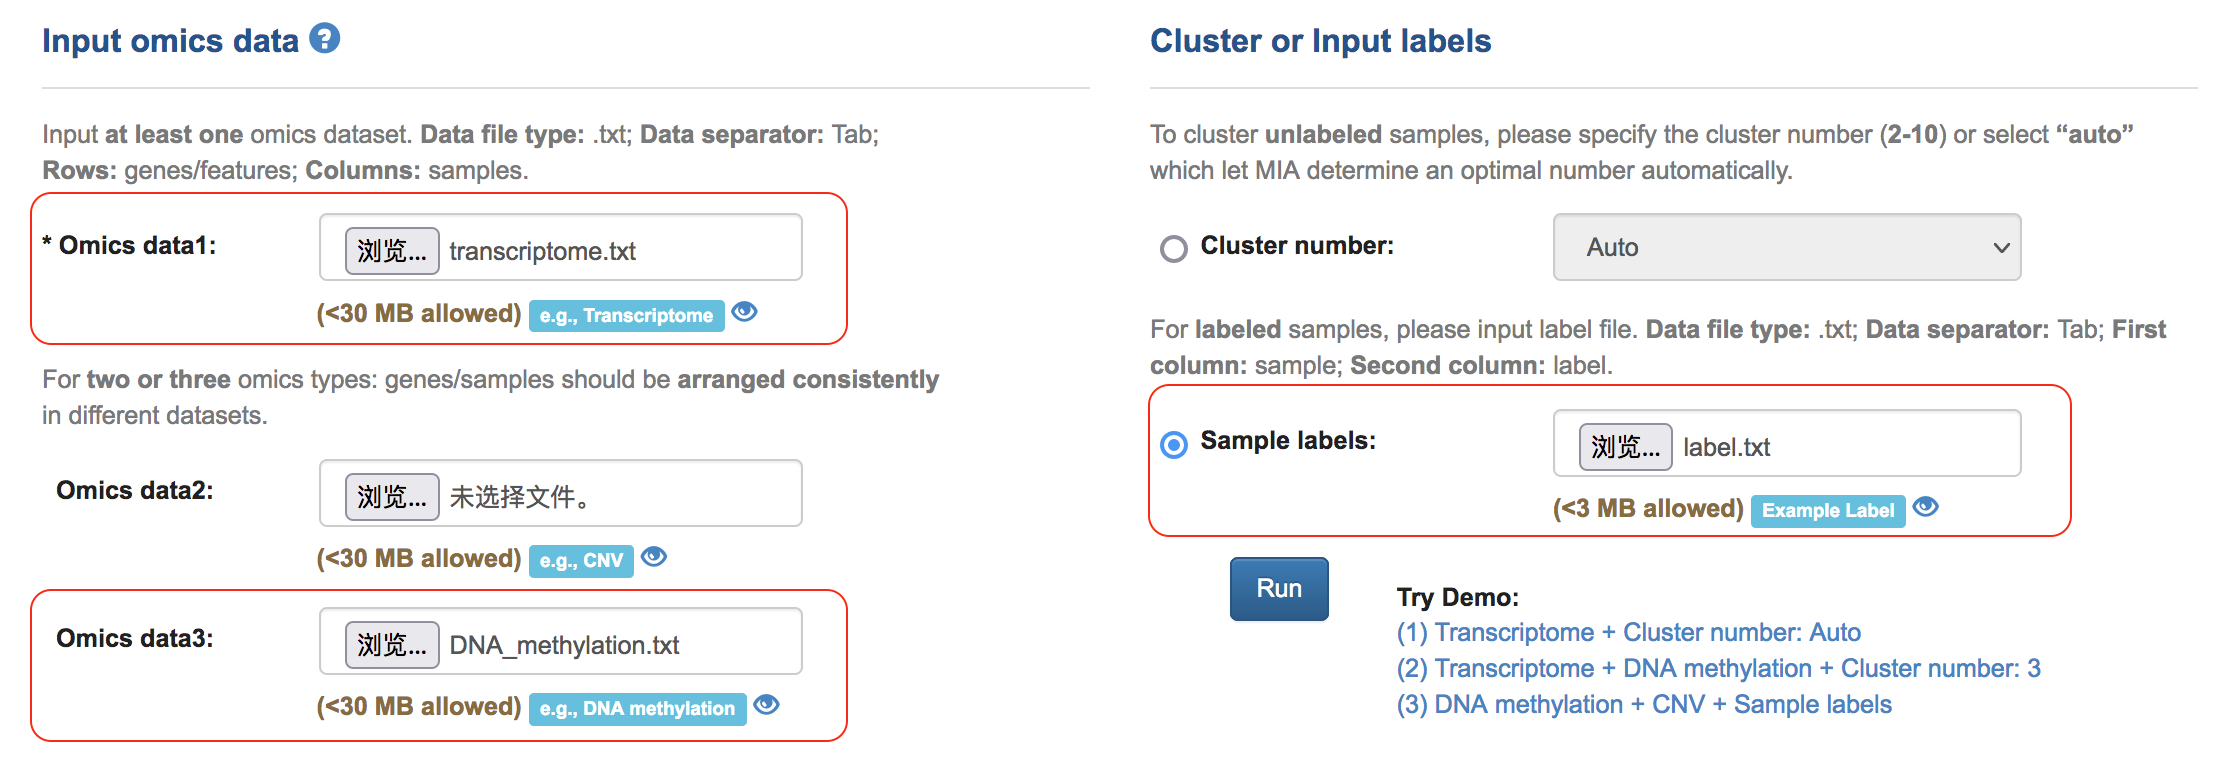
Example3: Identifying feature genes with transcriptome and DNA methylation data based on known classification
(1) Input data matrix and sample label
(2) Users can also save the Task ID and retrieve the results later by inputting the Task ID in the homepage.
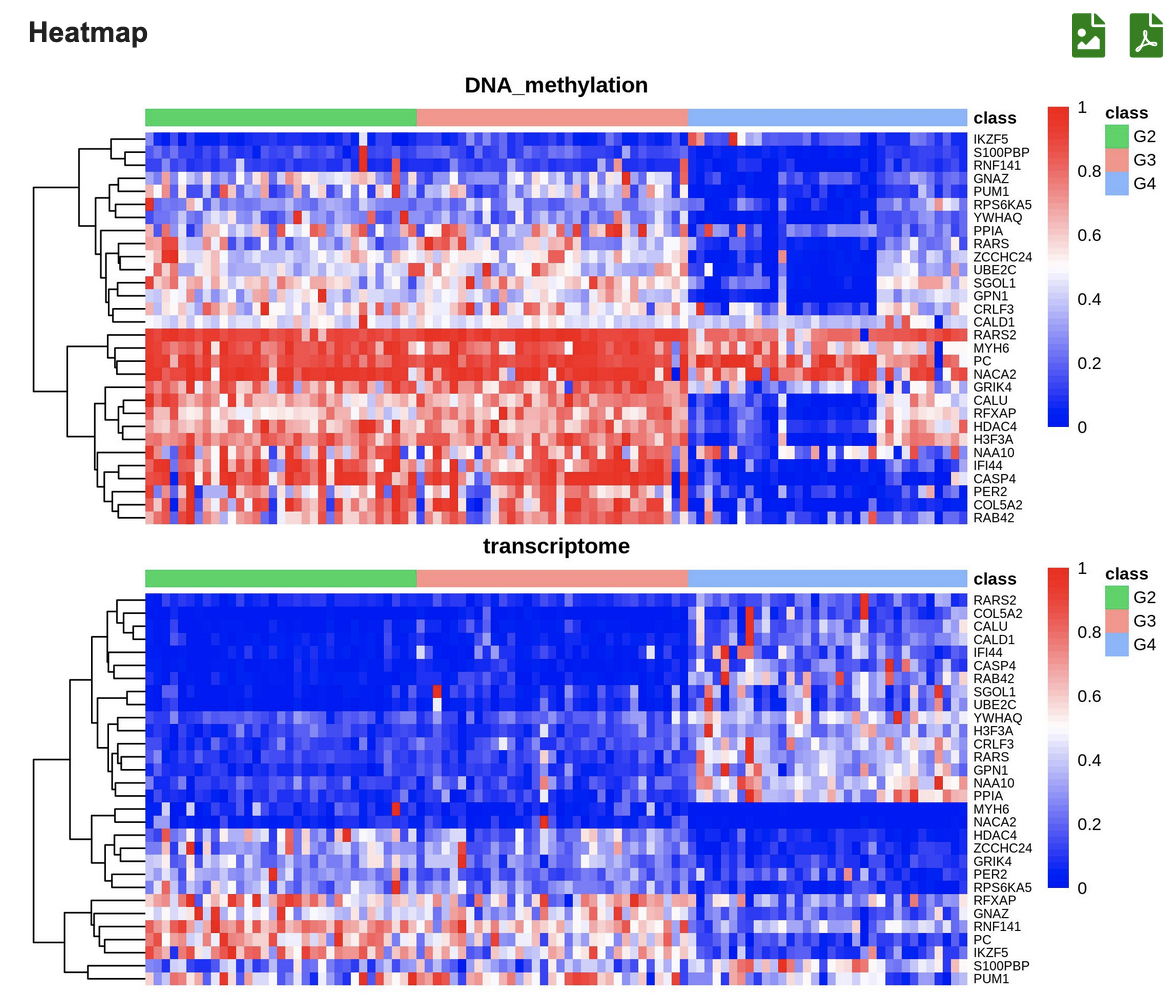
(3) View two heatmaps associated with two omics types in the scale of 30/50/80/100 feature genes.
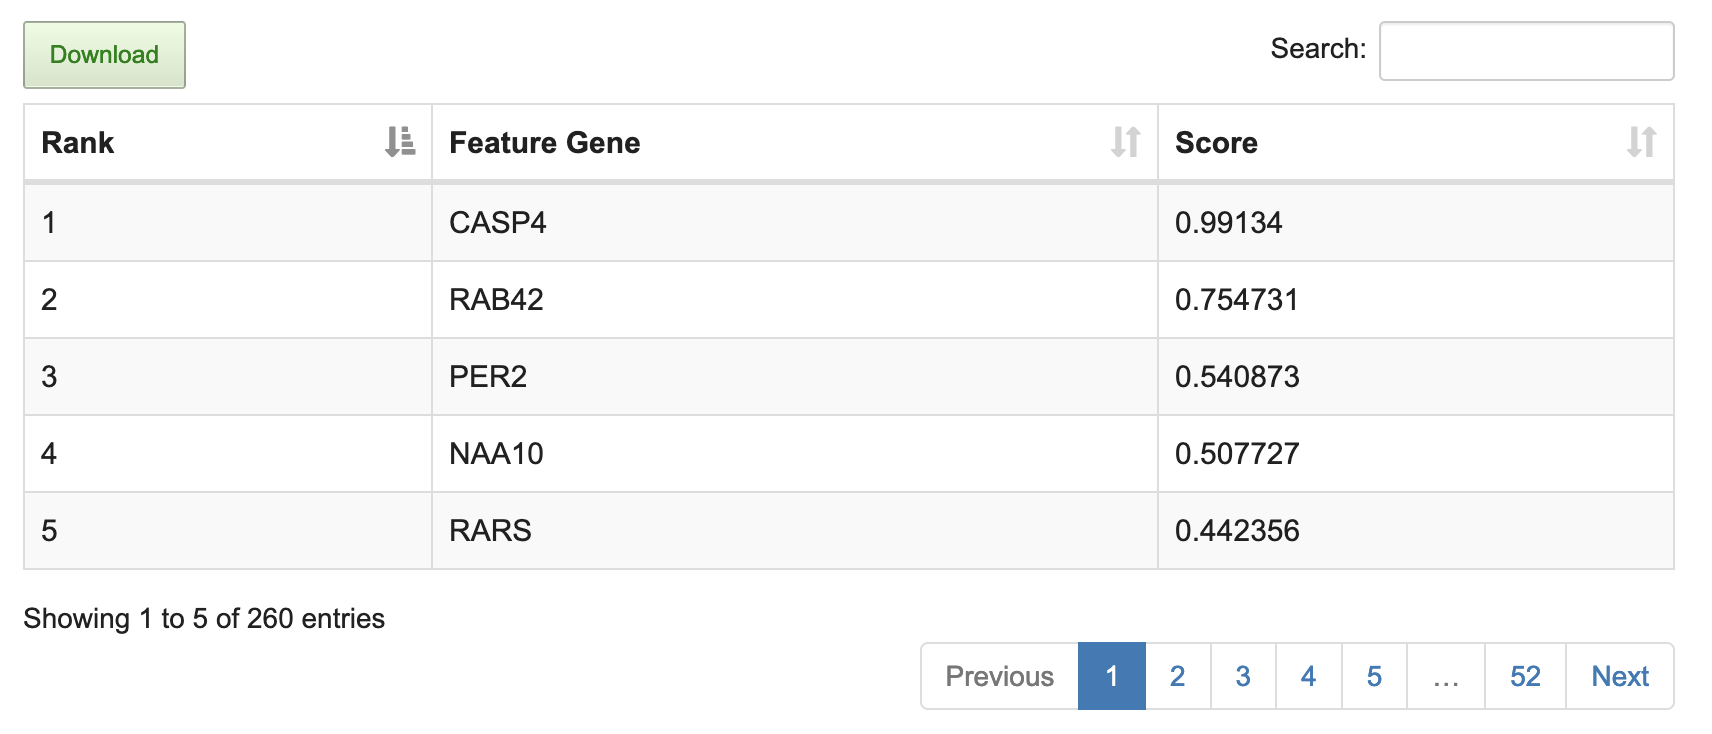
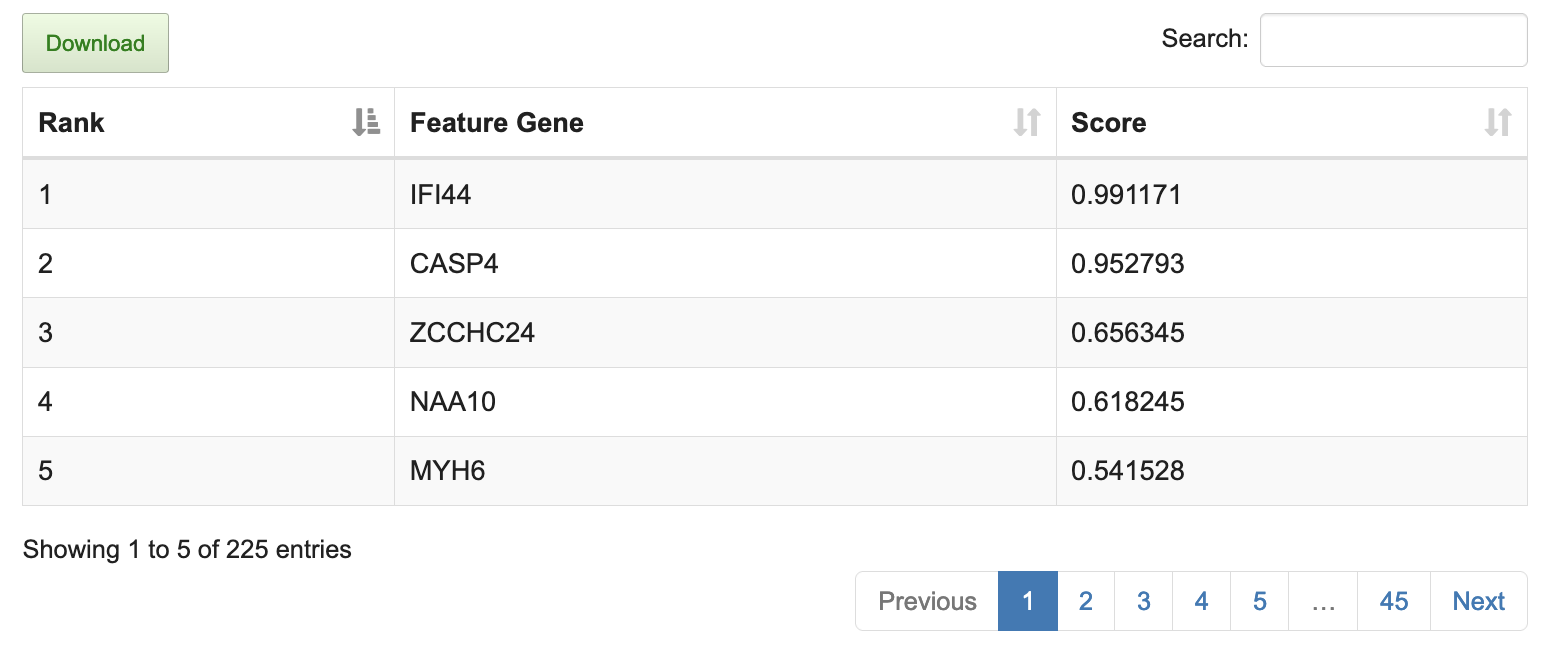
(4) The feature genes contributing to the classification are listed in the table ranked by score.
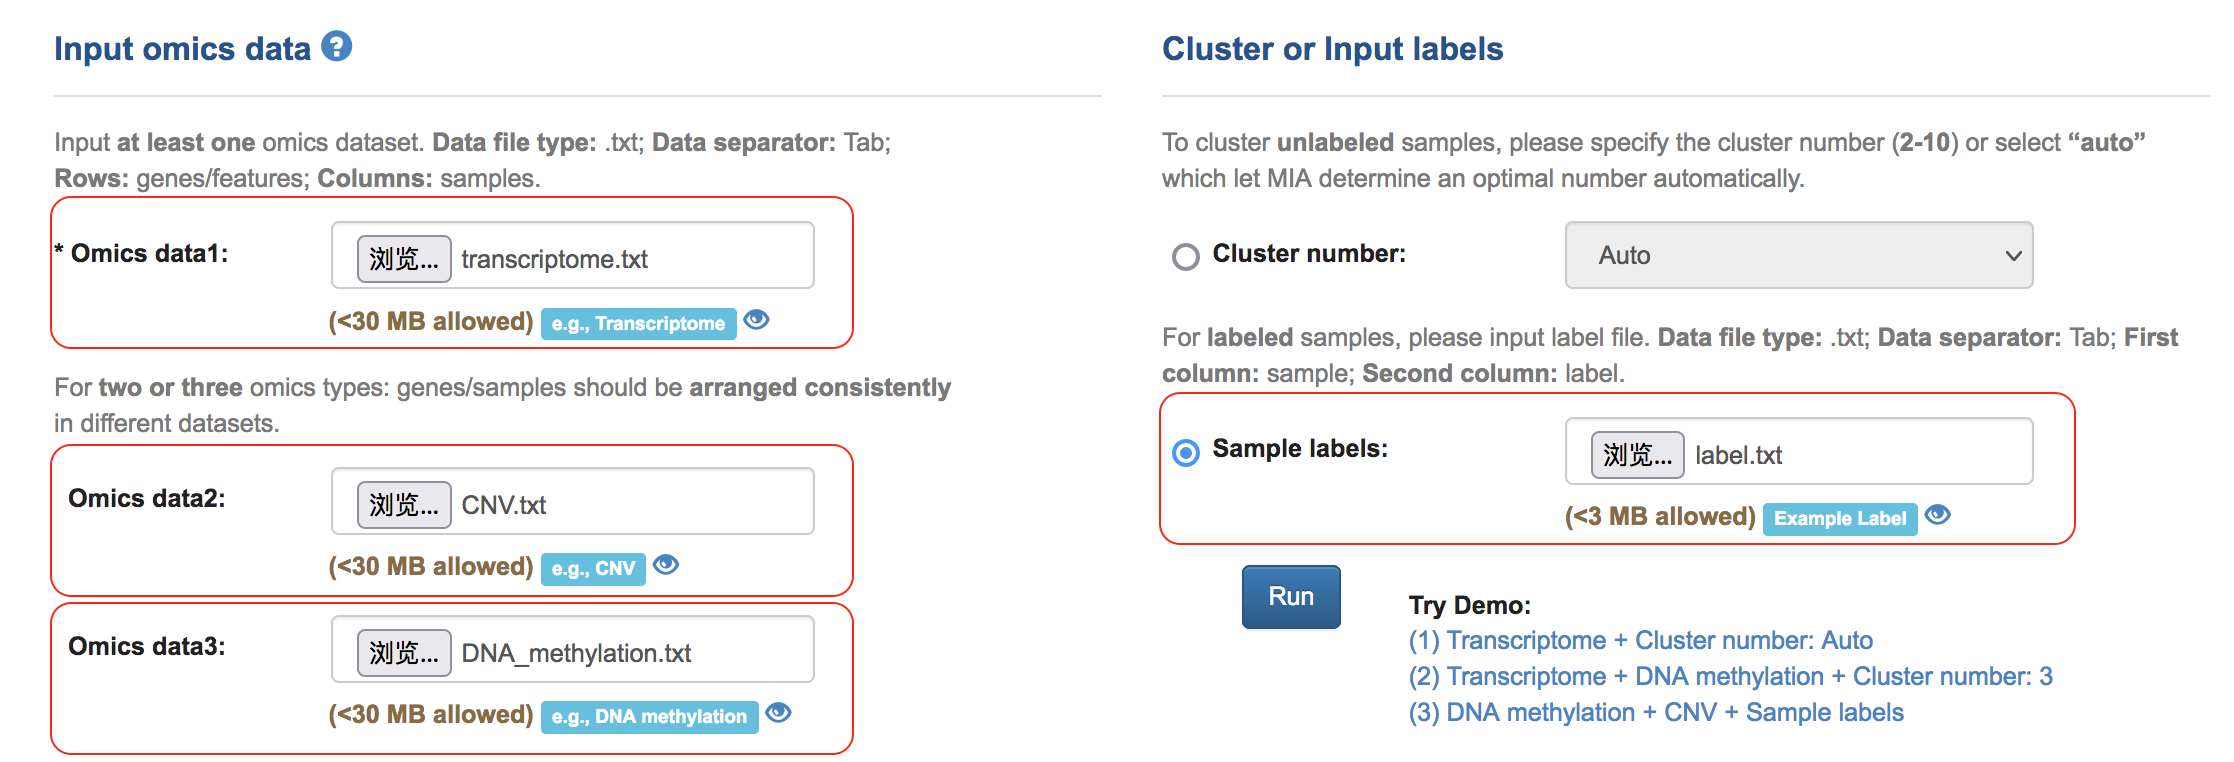
Example4: Identifying feature genes with three omics data (transcriptome + DNA methylation + CNV) based on known classification
(1) Input data matrix and sample label
(2) Users can also save the Task ID and retrieve the results later by inputting the Task ID in the homepage.
(3) View three heatmaps associated with three omics types in the scale of 30/50/80/100 feature genes
(4) The feature genes contributing to the classification are listed in the table ranked by score.
2. Applications
Identification glioma grades-associated genes
The glioma datasets were derived from TCGA, including 11,895 genes’ multi-omics profiles (expression, DNA methylation and CNV) of 569 samples (G2:213; G3:239; G4:117). Based on the supervised learning, 872 feature genes were identified to be closely associated with the three clusters. Notably, most of the feature genes have been validated by literatures (17 of the top 30 genes, 23 of the top 50 genes, 34 of the top 80 genes, and 39 of the top 100 genes have been validated). The information about the top 30 genes are described below.
| Rank | Gene | Score | PMID |
|---|---|---|---|
| 1 | EDARADD | 0.991025 | |
| 2 | C16orf72 | 0.776102 | |
| 3 | RASGRP1 | 0.765271 | |
| 4 | CHPF | 0.562479 | 28627702 |
| 5 | CNIH4 | 0.41149 | |
| 6 | CENPE | 0.298094 | 34663805 |
| 7 | MN1 | 0.257873 | 33105486 |
| 8 | TPX2 | 0.252286 | 32774168 |
| 9 | MGAT4C | 0.239413 | |
| 10 | TEF | 0.239217 | |
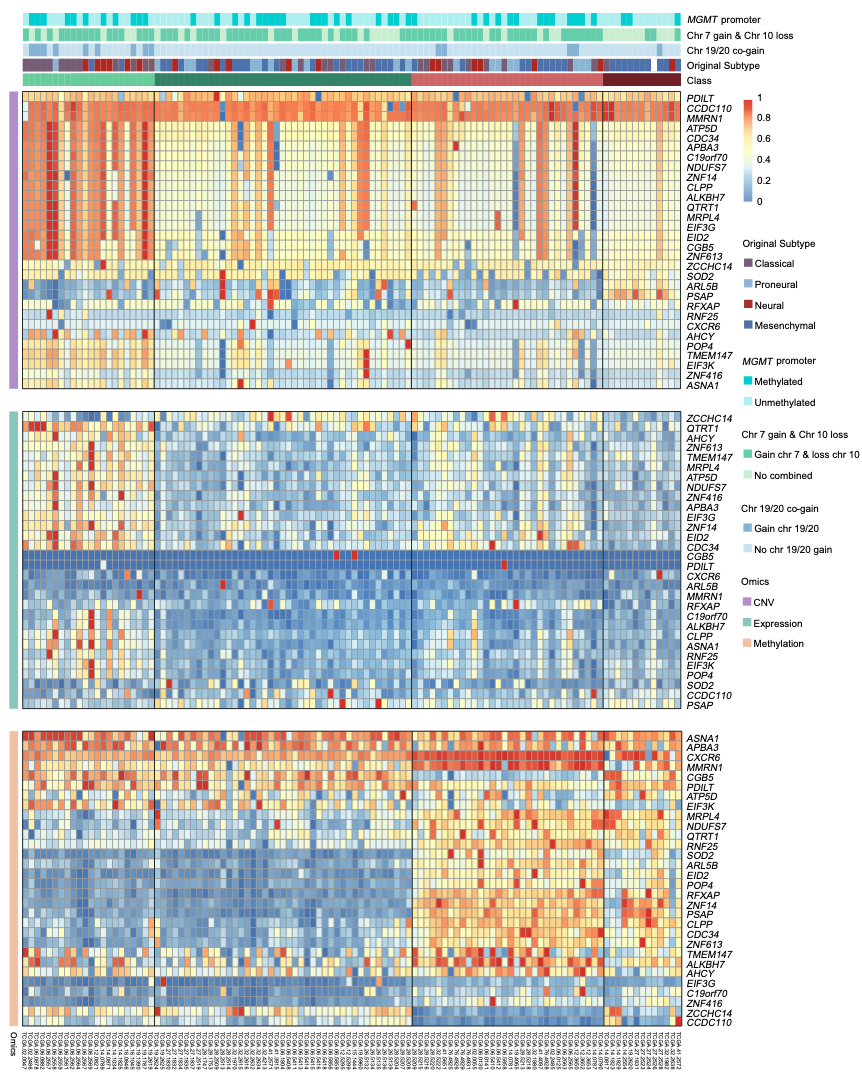
Glioblastoma subtyping
The Glioblastoma (GBM) multi-omics datasets were obtained from TCGA, including 11,895 genes’ multi-omics profiles (expression, DNA methylation and CNV) of 110 samples. Based on the unsupervised learning, 4 clusters of GBM samples were obtained. Overall survival analysis shows that compared with the classic subtypes (Classical, Proneural, Neural and Mesenchymal) [PMID=20129251], the four clusters identified by MIA show significant survival difference.

Brain region clustering
The brain region dataset was obtained from GTEx, including 56,202 genes’ RNA-Seq profile of 13 brain regions. Based on the unsupervised learning, 4 clusters of brain regions were obtained. It is shown that the brain regions that are close were clustered together and the distant regions were grouped into different classes, showing the ability of MIA to identify the genes with spatial expression characteristic.

Brain regions of GTEx
| Brain Region | Cluster |
|---|---|
| Spinal cord cervical c1 | Cluster 1 |
| Cerebellar Hemisphere | Cluster 2 |
| Cerebellum | Cluster 2 |
| Anterior cingulate cortex BA24 | Cluster 3 |
| Cortex | Cluster 3 |
| Frontal Cortex BA9 | Cluster 3 |
| Brain Region | Cluster |
|---|---|
| Amygdala | Cluster 4 |
| Caudate basal ganglia | Cluster 4 |
| Hippocampus | Cluster 4 |
| Hypothalamus | Cluster 4 |
| Nucleus accumbens basal ganglia | Cluster 4 |
| Putamen basal ganglia | Cluster 4 |