File list
This special page shows all uploaded files.
| Date | Name | Thumbnail | Size | Description | Versions |
|---|---|---|---|---|---|
| 08:14, 29 June 2016 | LincRNAs are dysregulated in bladder cancer.jpg (file) |  |
172 KB | 1 | |
| 12:41, 29 June 2016 | NBAT1 funtion.jpg (file) |  |
82 KB | Figure: Model explaining functional role of NBAT1 during neuroblastoma pathogenesis. | 1 |
| 13:36, 29 June 2016 | Expression level.gif (file) | 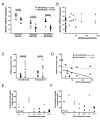 |
3 KB | MYCN, ΔMYCN, and MYCNOS mRNA expression levels in NBs. | 1 |
| 14:37, 29 June 2016 | MIAT.gif (file) | 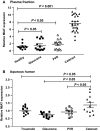 |
7 KB | 1 | |
| 01:01, 30 June 2016 | MAFTRR.gif (file) | 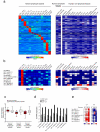 |
8 KB | LincRNA signatures of human lymphocyte subsets | 1 |
| 01:54, 30 June 2016 | MAFTRR.jpg (file) | 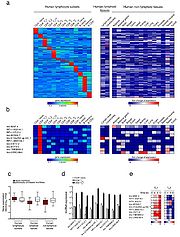 |
147 KB | 1 | |
| 02:01, 30 June 2016 | MHRT.jpg (file) | 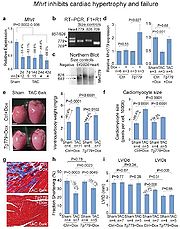 |
147 KB | 1 | |
| 02:52, 30 June 2016 | PTCSC2.jpg (file) | 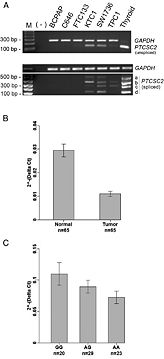 |
75 KB | Gene expression analysis of PTCSC2 in PTC tumors. A, Semiquantitative RT-PCR of PTCSC2 in thyroid cancer cell lines. B, Real-time RT-PCR analysis in PTC tumors and matched unaffected thyroid tissue in PTC patients. n, sample numbers. Depicted are the r... | 1 |
| 05:10, 30 June 2016 | LncRNA-CMPK2.jpg (file) | 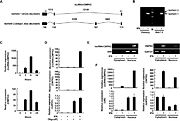 |
83 KB | 1 | |
| 05:43, 30 June 2016 | PVT-1.jpg (file) | 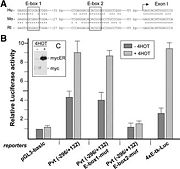 |
37 KB | A: Evolutionarily conserved E-box sites in the PVT-1 promoter region. Sequence alignment of the elements conserved in human (Hu), mouse (Mo) and rat (Rt) is shown, identical nucleotides are indicated by asterisks. The highly conserved core of Myc-bindi... | 2 |
| 10:30, 30 June 2016 | PWRN2.jpg (file) | 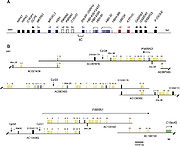 |
88 KB | 1 | |
| 11:59, 30 June 2016 | GHET1 promotes gastric carcinoma cell proliferation.png (file) |  |
155 KB | GHET1 promotes gastric carcinoma cell proliferation | 1 |
| 12:01, 30 June 2016 | GHET1 increases c-Myc expression and mRNA stability.png (file) |  |
206 KB | 1 | |
| 12:43, 30 June 2016 | BCMSUN.jpg (file) | 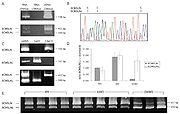 |
50 KB | 1 | |
| 13:39, 30 June 2016 | NALT.jpg (file) | 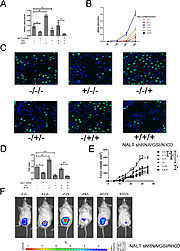 |
379 KB | NALT promoted cell proliferation in vitro and in vivo. | 1 |
| 13:48, 30 June 2016 | Expression level.jpg (file) | 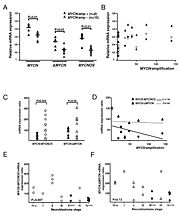 |
56 KB | MYCN, ΔMYCN, and MYCNOS mRNA expression levels in NBs | 1 |
| 08:52, 22 August 2016 | FENDRR.jpg (file) | 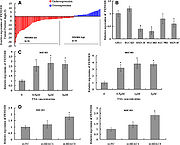 |
50 KB | Decreased expression ofFENDRRin gastric cancer cells; histone deacetylation is involved inFENDRRdownregulation. | 1 |
| 03:02, 5 September 2016 | Dysregulation of MDC1-AS and MDC1 expression level.jpg (file) |  |
95 KB | 1 | |
| 06:12, 5 September 2016 | RNA expression of Saf and Fas in various tissues and cell lines. expression.jpg (file) |  |
137 KB | 1 | |
| 01:42, 17 September 2016 | HAND2-AS1.jpg (file) |  |
165 KB | 1 | |
| 03:13, 17 September 2016 | HCCAT5.jpg (file) | 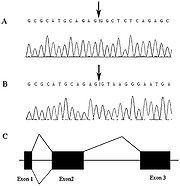 |
87 KB | 1 | |
| 10:49, 17 September 2016 | HIF1A-AS1.jpg (file) | 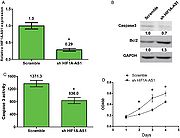 |
79 KB | 1 | |
| 13:01, 24 September 2016 | HNF1A-AS1.jpg (file) | 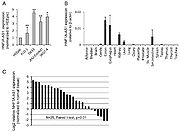 |
41 KB | 2 | |
| 13:54, 24 September 2016 | HTT-AS.jpg (file) | 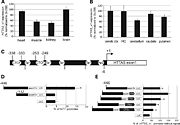 |
73 KB | 1 | |
| 03:04, 23 October 2016 | KCNQ1DN.png (file) | 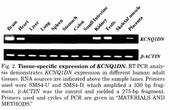 |
93 KB | 1 | |
| 03:19, 23 October 2016 | KCNQ1DN.jpg (file) |  |
92 KB | 1 | |
| 14:58, 23 September 2017 | Localization of SMILR.jpg (file) | 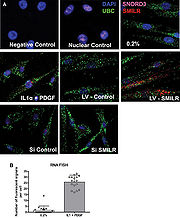 |
153 KB | Localization_of_SMILR | 1 |
| 15:59, 23 September 2017 | Characterization of XACT, a long intergenic RNA that coats the active X chromosome in hESCs.jpg (file) |  |
48 KB | 1 | |
| 13:56, 24 September 2017 | NPPA-AS forms RNA duplexes with NPPA.jpg (file) |  |
30 KB | 1 | |
| 13:58, 24 September 2017 | Splicing isoforms and expression pattern of NPPA and NPPA-AS.jpg (file) |  |
116 KB | 1 | |
| 01:15, 26 September 2017 | Genomic structure of the genes in the CES critical region (CESCR).jpg (file) |  |
61 KB | 1 | |
| 06:26, 15 October 2017 | FGF14-AS2 expression in breast cancer in validated cohort.jpg (file) |  |
159 KB | 1 | |
| 06:52, 15 October 2017 | FGF14-AS2 expression in breast cancer in TCGA cohort.jpg (file) |  |
156 KB | 1 | |
| 07:07, 15 October 2017 | Kaplan–Meier analysis for the overall survival of breast cancer patients with different expression of FGF14-AS2 in TCGA cohort.jpg (file) |  |
162 KB | 1 | |
| 07:45, 15 October 2017 | Expression levels of CoroMarker,IL21R-AS1,BAT5,AC107016.1,and RP11-203B9.4 were quantified by qPCR in the PBMCs of CAD patients and control subjects.png (file) |  |
49 KB | 1 | |
| 07:47, 15 October 2017 | Expression levels of CoroMarker, IL21R-AS1, BAT5, AC107016.1, and RP11-203B9.4 were quantified by qPCR in the PBMCs of CAD patients and control subjects.png (file) |  |
346 KB | 1 | |
| 08:06, 15 October 2017 | Expression levels of CoroMarker,IL21R-AS1,and BAT5 were quantified by qPCR in the PBMCs of CAD patients.png (file) |  |
42 KB | 1 | |
| 08:37, 15 October 2017 | Expression pattern of KRT7-AS and KRT7 mRNAs in cell lines and tissues.jpg (file) |  |
60 KB | 1 | |
| 08:55, 15 October 2017 | Regulatory function of KRT7-AS overexpression to KRT7.jpg (file) |  |
77 KB | 1 | |
| 08:57, 15 October 2017 | Regulatory function of KRT7 mRNA downregulation to KRT7-AS and the rescue effect of KRT7-AS overexpression in KRT7 mRNA-downregulated cells.jpg (file) |  |
83 KB | 1 | |
| 09:53, 15 October 2017 | LncRNA CERNA1 was upregulated by ABO.jpg (file) |  |
75 KB | 1 | |
| 10:03, 15 October 2017 | LncRNA LOC100129973 regulated the expression of miR-4707-5p and miR-4767 by directly binding with them.jpg (file) |  |
182 KB | 1 | |
| 10:27, 15 October 2017 | LncRNA CERNA1 regulated the expression of miR-4707-5p and miR-4767 by directly binding with them.jpg (file) |  |
182 KB | 1 | |
| 11:55, 15 October 2017 | TRIM52-AS is downregulated in RCC tissues and cell lines.jpg (file) |  |
66 KB | 1 | |
| 13:14, 22 October 2017 | Expression of LOC101926975 in HSCR.png (file) |  |
38 KB | 1 | |
| 13:22, 22 October 2017 | Function of LOC101926975 in vitro.jpg (file) |  |
76 KB | 1 | |
| 14:16, 22 October 2017 | Expression and genomic alteration of LINP1 in breast cancer.jpg (file) |  |
86 KB | 1 | |
| 14:20, 22 October 2017 | LINP1 RNA associates with Ku80 and DNA-PKcs.jpg (file) |  |
81 KB | 1 | |
| 14:22, 22 October 2017 | LINP1 serves as a modular scaffold in the NHEJ pathway.jpg (file) |  |
103 KB | 1 | |
| 14:41, 22 October 2017 | Effect of MAPT-AS1 over- and knock-down expression on MAPT expression in HEK293 and SK-N-MC cells.jpg (file) |  |
135 KB | 1 |