File:PTCSC2.jpg

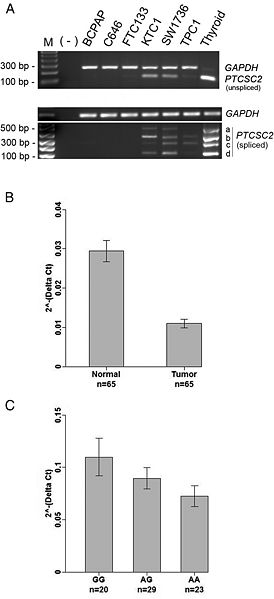
Gene expression analysis of PTCSC2 in PTC tumors. A, Semiquantitative RT-PCR of PTCSC2 in thyroid cancer cell lines. B, Real-time RT-PCR analysis in PTC tumors and matched unaffected thyroid tissue in PTC patients. n, sample numbers. Depicted are the relative expression levels of PTCSC2 in unaffected thyroid tissue and PTC tumors. The relative expression level was normalized using GAPDH as an internal control. The expression levels are lower in the tumors; linear mixed model analysis, P value = 1.870597e-13. C, Correlation between the genotypes of rs965513 and the PTCSC2 unspliced transcript levels in unaffected thyroid tissues. n, sample numbers; GG, AG, AA, genotypes of rs965513. Data were analyzed using generalized linear models, AA vs GG, P value = .036; AG vs GG, P value = .121). The P values were adjusted for age, gender, and CLT in B and C.
File history
Click on a date/time to view the file as it appeared at that time.
| Date/Time | Thumbnail | Dimensions | User | Comment | |
|---|---|---|---|---|---|
| current | 02:52, 30 June 2016 |  | 656 × 1,435 (75 KB) | Lin Liu (talk | contribs) | Gene expression analysis of PTCSC2 in PTC tumors. A, Semiquantitative RT-PCR of PTCSC2 in thyroid cancer cell lines. B, Real-time RT-PCR analysis in PTC tumors and matched unaffected thyroid tissue in PTC patients. n, sample numbers. Depicted are the r... |
- You cannot overwrite this file.
File usage
The following 3 pages link to this file: