File:图片cop.png
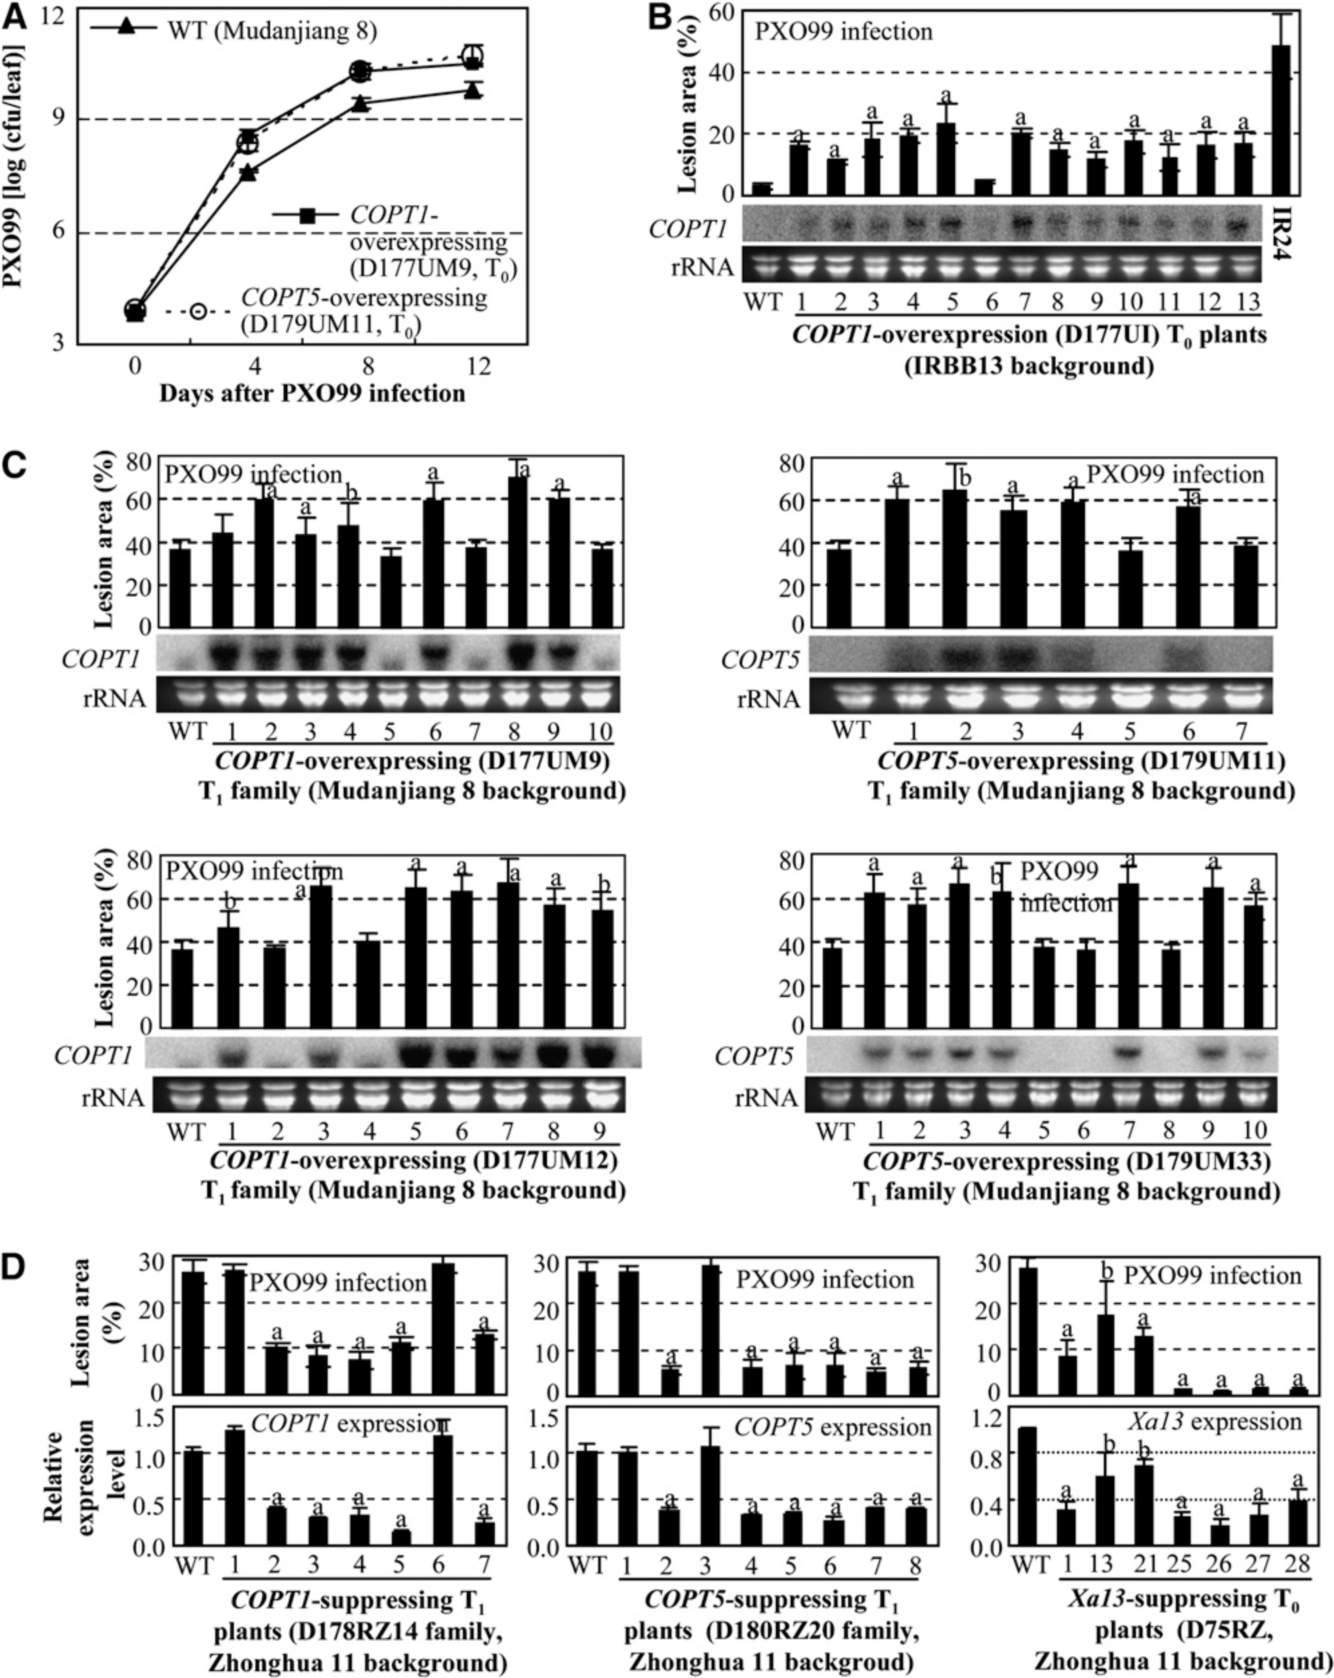
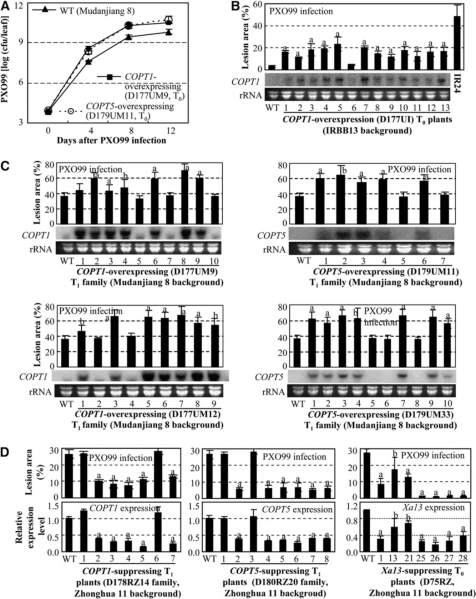
Modulating COPT1, COPT5, or Xa13 Expression Influenced Rice Responses to Xoo Infection.
Each data point representsmean (five replicates for lesion and three replicates for others) 6 SD. Gene expression was analyzed by RNA gel blot analysis
([B] and [C]) or qRT-PCR (D). The “a” or “b” indicates a significant difference was detected between a transgenic plant and its corresponding wild-type plants at P < 0.01 or P < 0.05 level, respectively.
(A) COPT1- and COPT5-overexpressing plants showed increased bacterial growth at booting stage. Each T0 plant was divided into three plants in the tillering stage. cfu, colony-forming unit.
(B) COPT1-overexpressing plants showed increased disease symptoms in IRBB13 (xa13) background. IR24, a susceptible near-isogenic line of IRBB13 that carried dominant Xa13.
(C) Increased susceptibility of the transgenic plants to PXO99 was associated with overexpression of COPT1 or COPT5.
(D) Enhanced resistance of the transgenic plants was associated with reduced expression of COPT1, COPT5, or Xa13.
File history
Click on a date/time to view the file as it appeared at that time.
| Date/Time | Thumbnail | Dimensions | User | Comment | |
|---|---|---|---|---|---|
| current | 04:03, 9 June 2014 | | 1,334 × 1,678 (1.08 MB) | Bettychenmei (talk | contribs) | Modulating COPT1, COPT5, or Xa13 Expression Influenced Rice Responses to Xoo Infection. Each data point representsmean (five replicates for lesion and three replicates for others) 6 SD. Gene expression was analyzed by RNA gel blot analysis ([B] and [C]) |
- You cannot overwrite this file.
File usage
The following page links to this file: