File:Figure 8.jpg
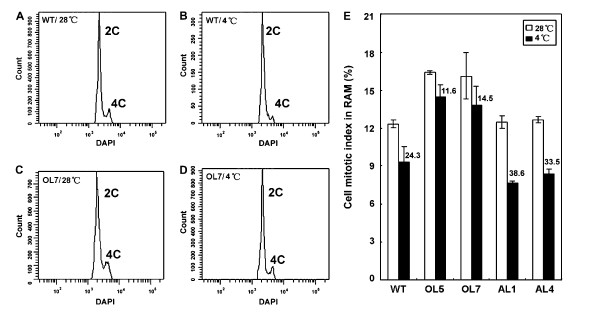
Figure 8. Cell cycle progression response to cold in flow cytometry assay in the OsMYB3R-2 transgenic lines. A, The wild type at 28℃. B, The wild type at 4℃. C, Overexpressing line 7 (OL7) of OsMYB3R-2 transgenic rice at 28℃. D, Overexpressing line 7 at 4�C. Seedlings 5 d after germination were treated with low temperature (4℃) or room temperature (control, 28℃) for 24 h. Cell nuclei (10,000) taken from the root apical meristem were stained with DAPI (1 mgmL21) and analyzed by flow cytometry. 2C and 4C represent the DAPI signals that correspond to nuclei with differentDNA contents. E, Cell mitotic index in root apical meristem (RAM) in rice. Numbers above the black histograms represent the percentage of decrease in the mitotic index at 4℃. The error bars show SE and are from three independent replications of the same experiment. Flow cytometry determination was repeated twice. AL1 and AL4, OsMYB3R-2-antisense lines; OL5 and OL7, OsMYB3R-2-overexpressing lines; WT, wild type.
File history
Click on a date/time to view the file as it appeared at that time.
| Date/Time | Thumbnail | Dimensions | User | Comment | |
|---|---|---|---|---|---|
| current | 03:05, 30 May 2014 | | 599 × 314 (39 KB) | Cloud27 (talk | contribs) | Figure 8. Cell cycle progression response to cold in flow cytometry assay in the OsMYB3R-2 transgenic lines. A, The wild type at 28℃. B, The wild type at 4℃. C, Overexpressing line 7 (OL7) of OsMYB3R-2 transgenic rice at 28℃. D, Overexpressing line |
- You cannot overwrite this file.
File usage
The following file is a duplicate of this file (more details):
There are no pages that link to this file.