File:Image5.png
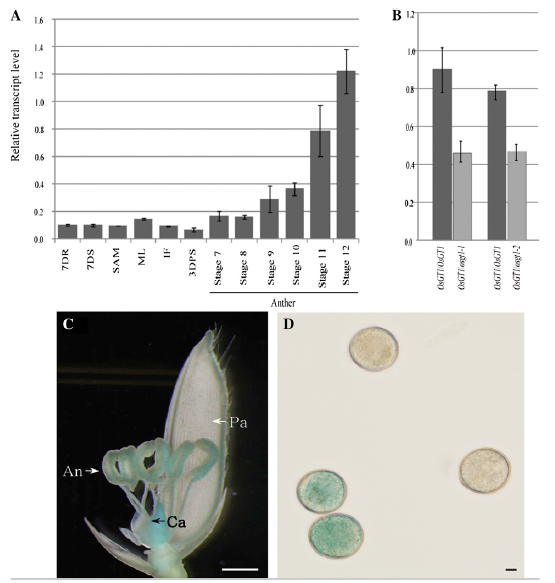
Figure 5. Expression pattern of OsGT1. A, Quantitative RT-PCR analyses in various organs. Transcript levels were normalized to UBIQUITIN and calculated by the comparative cycle threshold method. Error bars indicate SD. 7DR, Seven-day-old seedling roots; 7DS, 7-dold seedling shoots; SAM, shoot apical meristem; ML, mature leaves; IF, immature panicles (2 cm long); 3DAPS, seeds at 3 d after pollination; stages 7 to 12, anthers at different developmental stages. B, Quantitative real-time RT-PCR analyses of OsGT1 in wild-type and heterozygous anthers at mitotic stage. C, GUS expression in a spikelet harboring an OsGT1 promoter::GUS construct. An, Anther; Ca, carpel; Pa, palea. Bar = 1 mm. D, GUS staining of pollen grains. Bar = 10 mm.
File history
Click on a date/time to view the file as it appeared at that time.
| Date/Time | Thumbnail | Dimensions | User | Comment | |
|---|---|---|---|---|---|
| current | 05:12, 4 June 2014 | | 555 × 583 (166 KB) | Tracy (talk | contribs) | Figure 5. Expression pattern of OsGT1. A, Quantitative RT-PCR analyses in various organs. Transcript levels were normalized to UBIQUITIN and calculated by the comparative cycle threshold method. Error bars indicate SD. 7DR, Seven-day-old seedling roots; 7 |
- You cannot overwrite this file.
File usage
The following page links to this file: