File list
This special page shows all uploaded files.
| Date | Name | Thumbnail | Size | User | Description | Versions |
|---|---|---|---|---|---|---|
| 03:53, 1 June 2014 | Figure6.jpg (file) |  |
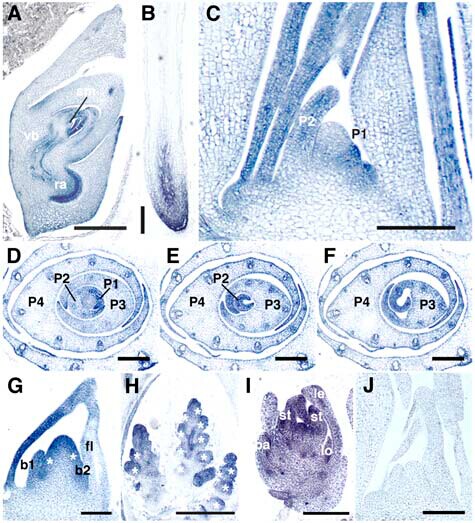
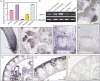
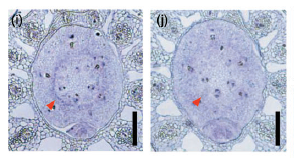
95 KB | Zhuhuihui | (A) to (I) Antisense probe. (J) Sense probe. (A) Longitudinal section of embryo at 10 d after pollination. sm, SAM; vb, vascular bundle; ra, radicle. (B) Crown root at 1 week after germination. (C) Longitudinal section of 3-week-old shoot apex. (D) to (F) | 1 |
| 05:18, 1 June 2014 | Function.png (file) |  |
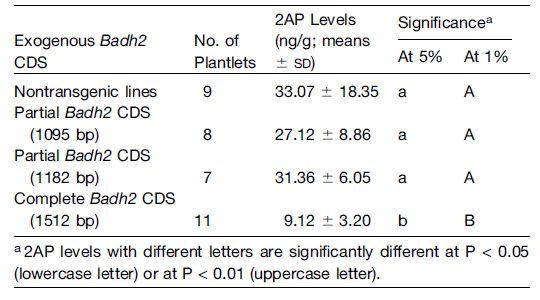
36 KB | Vivian | 2AP Levels and Their Significant Differences among Nontransgenic Lines and Three Kinds of Transgenic Lines Carrying Different Badh2 CDS Driven by the CaMV35S Promoter.From Ref.1. | 2 |
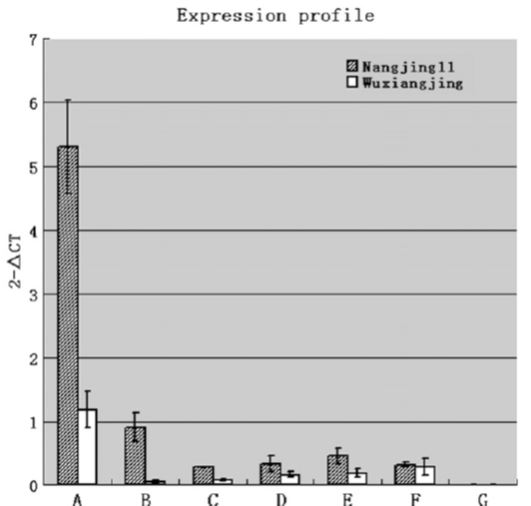
| 05:26, 1 June 2014 | Expression profiles of OsCAO1.jpg (file) |  |
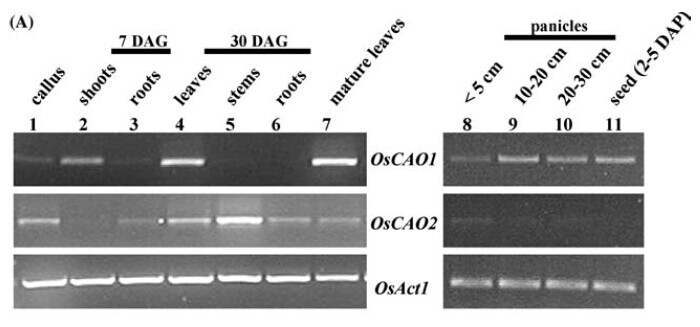
41 KB | Mr corn | 1 | |
| 05:33, 1 June 2014 | Expression profiles of OsCAO1 B.jpg (file) |  |
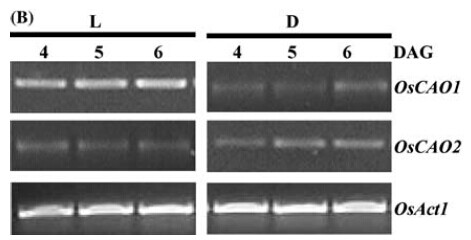
22 KB | Mr corn | Expression levels of OsCAO1 and OsCAO2 in seedlings 4, 5, and 6 d after germination; DAG grown under continuous light L or darkness D. | 1 |
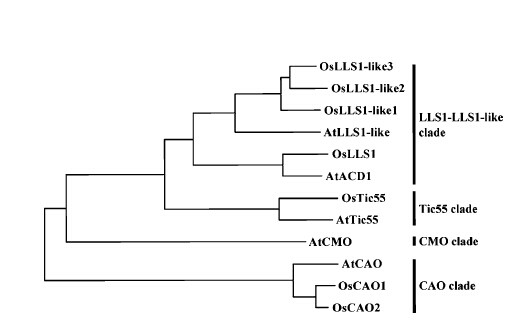
| 05:46, 1 June 2014 | Phylogeneic trees of the proteins.jpg (file) |  |
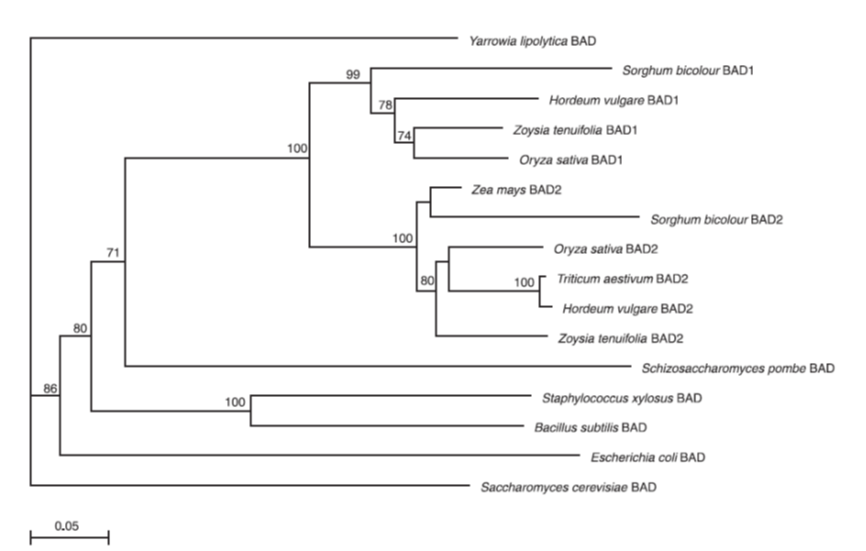
21 KB | Mr corn | Phylogeneic trees of the proteins containing the conserved Rieske [2Fe–2S] binding site from rice and Arabidopsis. Note that there are two genes related to the CAO clade in rice, but only one in Arabidopsis. | 1 |
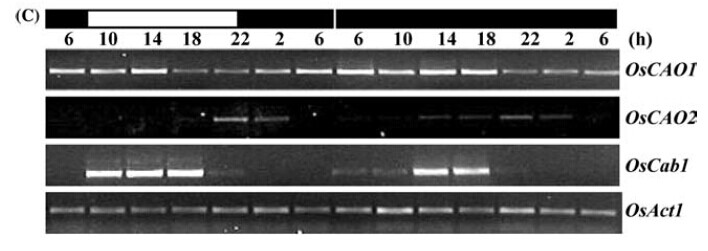
| 06:34, 1 June 2014 | Circadian regulation of OsCAO1.jpg (file) |  |
37 KB | Mr corn | Circadian regulation of OsCAO1. Plants were grown in greenhouse 14 h/10 h light/dark, and then transferred to continuous darkness. Flag leaves of two or three plants were harvested for RNA extraction. | 1 |
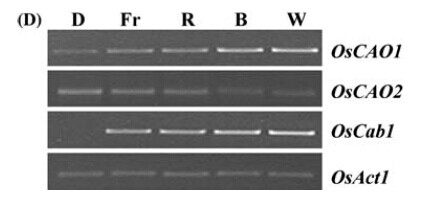
| 06:35, 1 June 2014 | Analysis of OsCAO1 under different light conditions.jpg (file) |  |
15 KB | Mr corn | Analysis of OsCAO1.Expression levels were determined in 4-day-old dark-grown wild-type seedlings after exposure to various light sources. D, darkness; Fr, far-red light; R, red light; B, blue light; W, white light. | 1 |
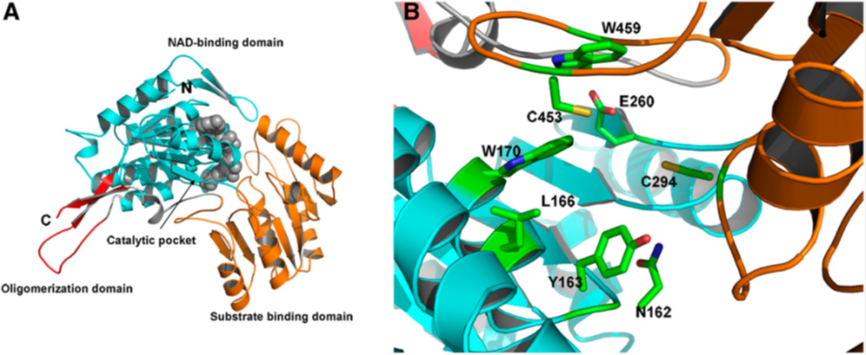
| 06:39, 1 June 2014 | Structure.png (file) |  |
373 KB | Vivian | 1 | |
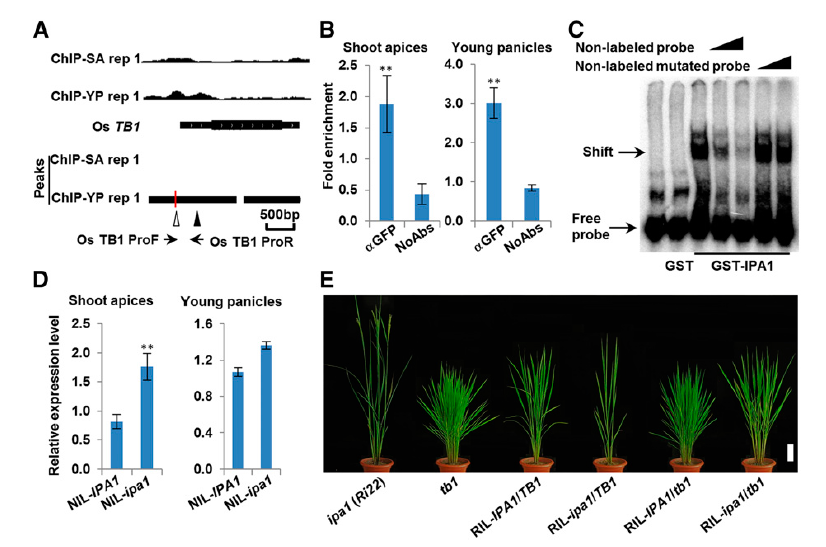
| 06:41, 1 June 2014 | IPA1 figure 1.png (file) |  |
231 KB | April Cui | 1 | |
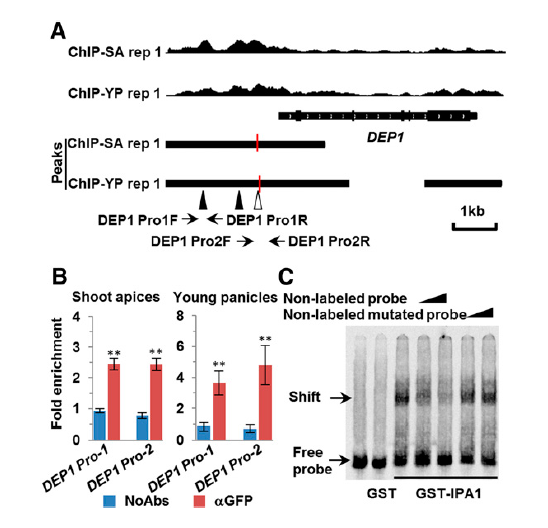
| 06:41, 1 June 2014 | IPA1 figure 2.png (file) |  |
123 KB | April Cui | 1 | |
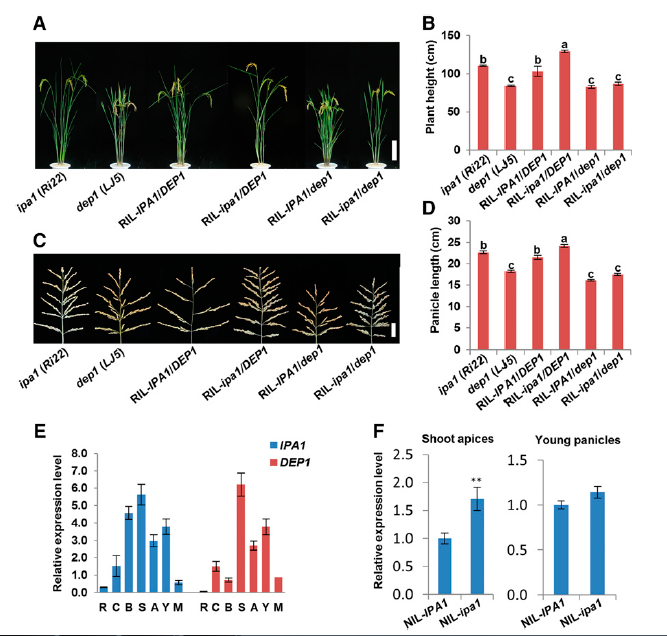
| 06:41, 1 June 2014 | IPA1 figure 3.png (file) |  |
223 KB | April Cui | 1 | |
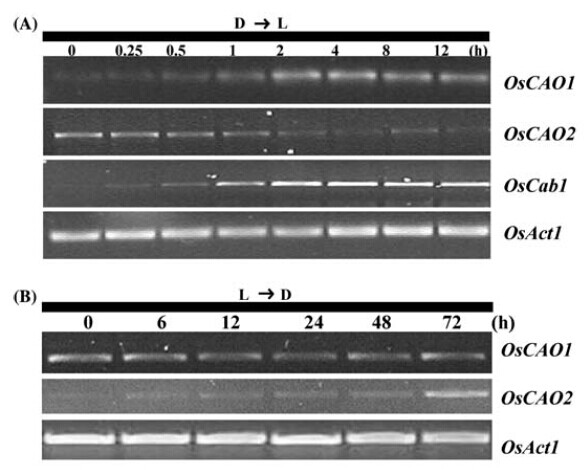
| 06:45, 1 June 2014 | Effect of light on OsCAO1.jpg (file) |  |
53 KB | Mr corn | (A) Expression levels after etiolated 4 DAG seedlings were exposed to illumination. (B) Expression patterns of 4 DAG light-grown seedlings after transfer to dark conditions. | 1 |
| 07:46, 1 June 2014 | Schematic diagrams of the rice CAO genes and insertion positions of T-DNA and Tos17.jpg (file) |  |
12 KB | Mr corn | The nine exons are shaded and eight introns are indicated with open boxes. In Line 1C-039-43, T-DNA is inserted into the first intron of OsCAO1. | 1 |
| 07:46, 1 June 2014 | Phenotype comparisons between OsCAO1 KO and WT.jpg (file) |  |
26 KB | Mr corn | 1 | |
| 07:47, 1 June 2014 | Genotyping and GUS activity in progeny of Line 1C-039-43.jpg (file) |  |
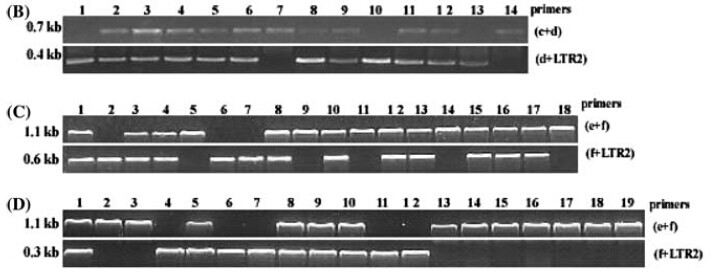
23 KB | Mr corn | Genotyping and GUS activity in progeny of Line 1C-039-43. Thirty plants were genotyped with primers a and b (upper), or primers a and RB (lower). The 0.6-kb genomicDNAbands are PCR product using primers a and b, if no T-DNA insertion; 0.4-kb bands are PCR | 1 |
| 07:49, 1 June 2014 | Genotyping of T2 progeny of Line 1B-044-10.jpg (file) |  |
44 KB | Mr corn | 1 | |
| 08:08, 1 June 2014 | Sjb1.png (file) |  |
93 KB | 113322 | 1 | |
| 08:08, 1 June 2014 | Sjb2.png (file) |  |
109 KB | 113322 | 1 | |
| 08:17, 1 June 2014 | 12343.png (file) |  |
269 KB | Etwc | 1 | |
| 08:18, 1 June 2014 | Xa10 figure 2.png (file) |  |
32 KB | Yinyj | 1 | |
| 08:22, 1 June 2014 | 20140601161505.png (file) |  |
138 KB | Etwc | 1 | |
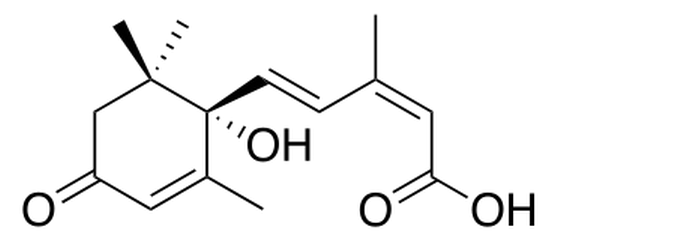
| 08:37, 1 June 2014 | Abscisic acid.png (file) |  |
34 KB | Etwc | 1 | |
| 08:47, 1 June 2014 | 01.jpg (file) |  |
124 KB | Liucaixia1214 | 2 | |
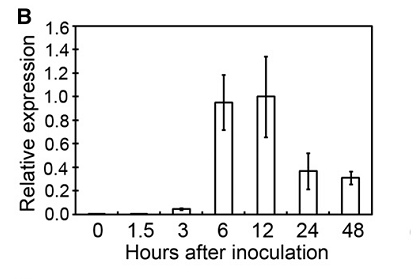
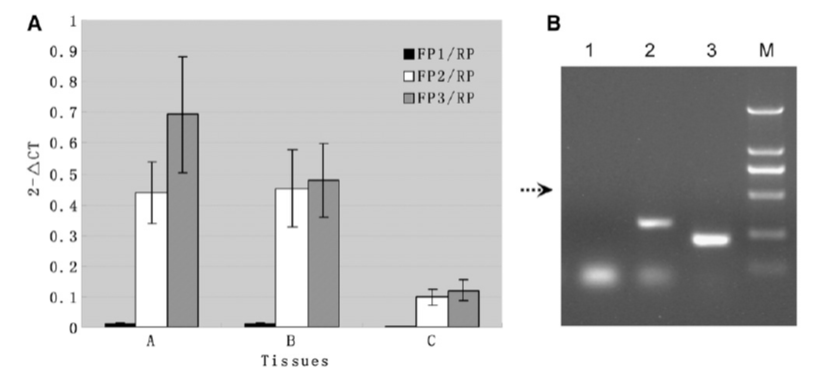
| 08:49, 1 June 2014 | Expression11.png (file) |  |
53 KB | Vivian | 1 | |
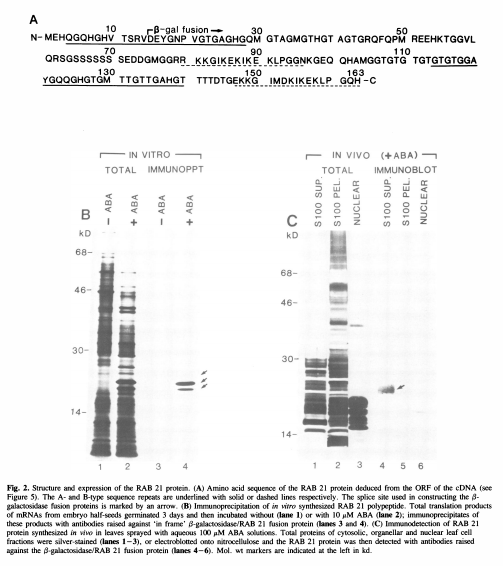
| 08:53, 1 June 2014 | Expression12.png (file) |  |
55 KB | Vivian | 1 | |
| 08:57, 1 June 2014 | Expression13.png (file) |  |
193 KB | Vivian | 1 | |
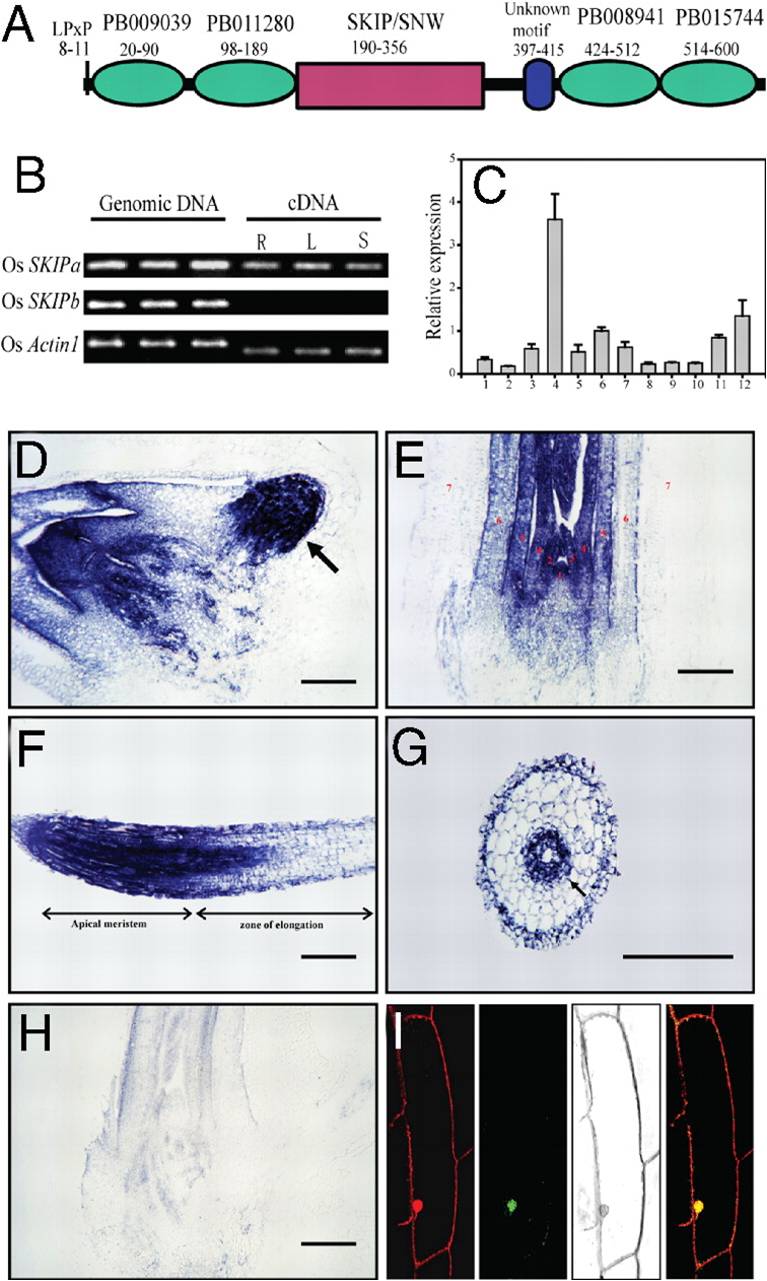
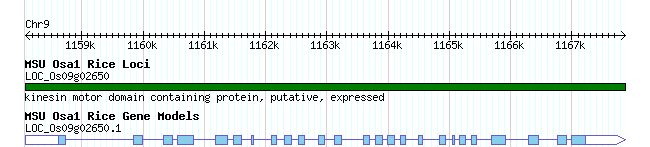
| 09:13, 1 June 2014 | Identification.jpg (file) |  |
122 KB | YanVenice | Identification of SKIP Homologs in Rice. | 1 |
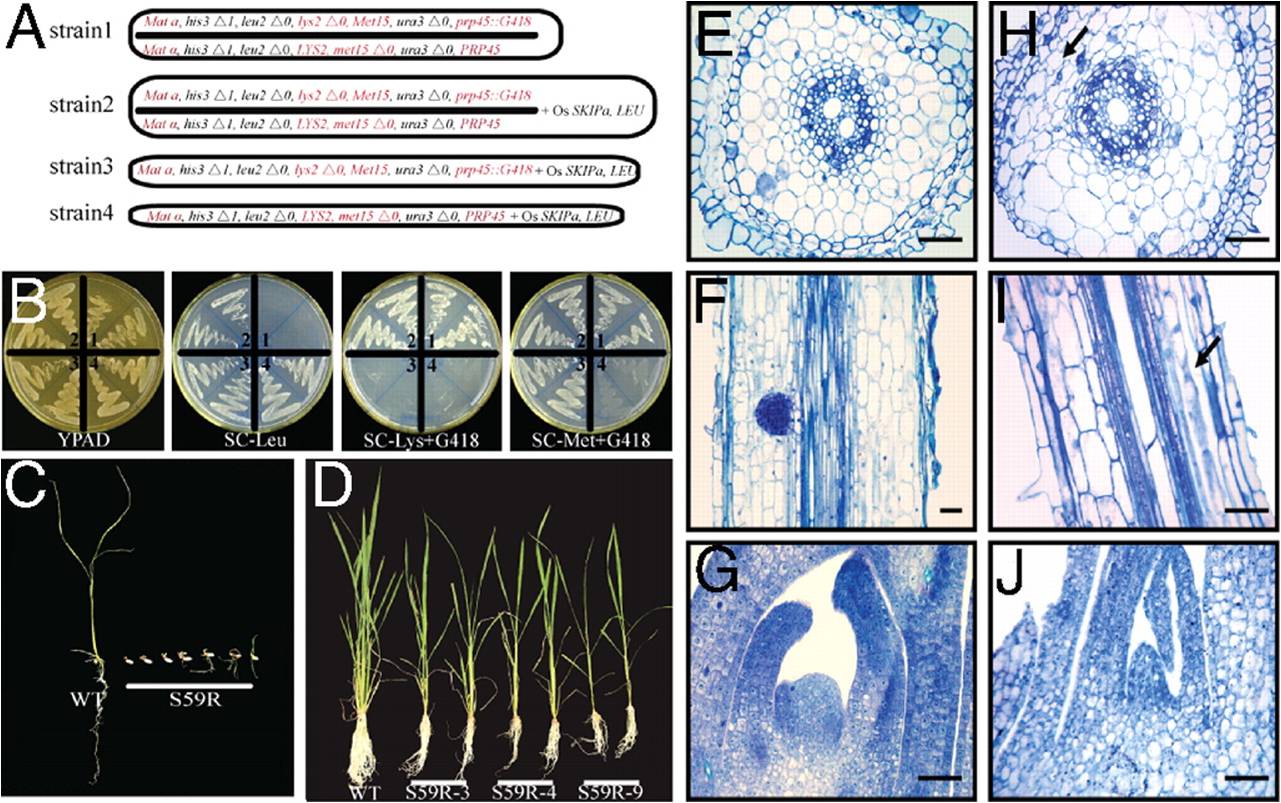
| 09:14, 1 June 2014 | Function.jpg (file) |  |
191 KB | YanVenice | OsSKIPa Can Complement the Yeast Mutant of SKIP Homolog. | 1 |
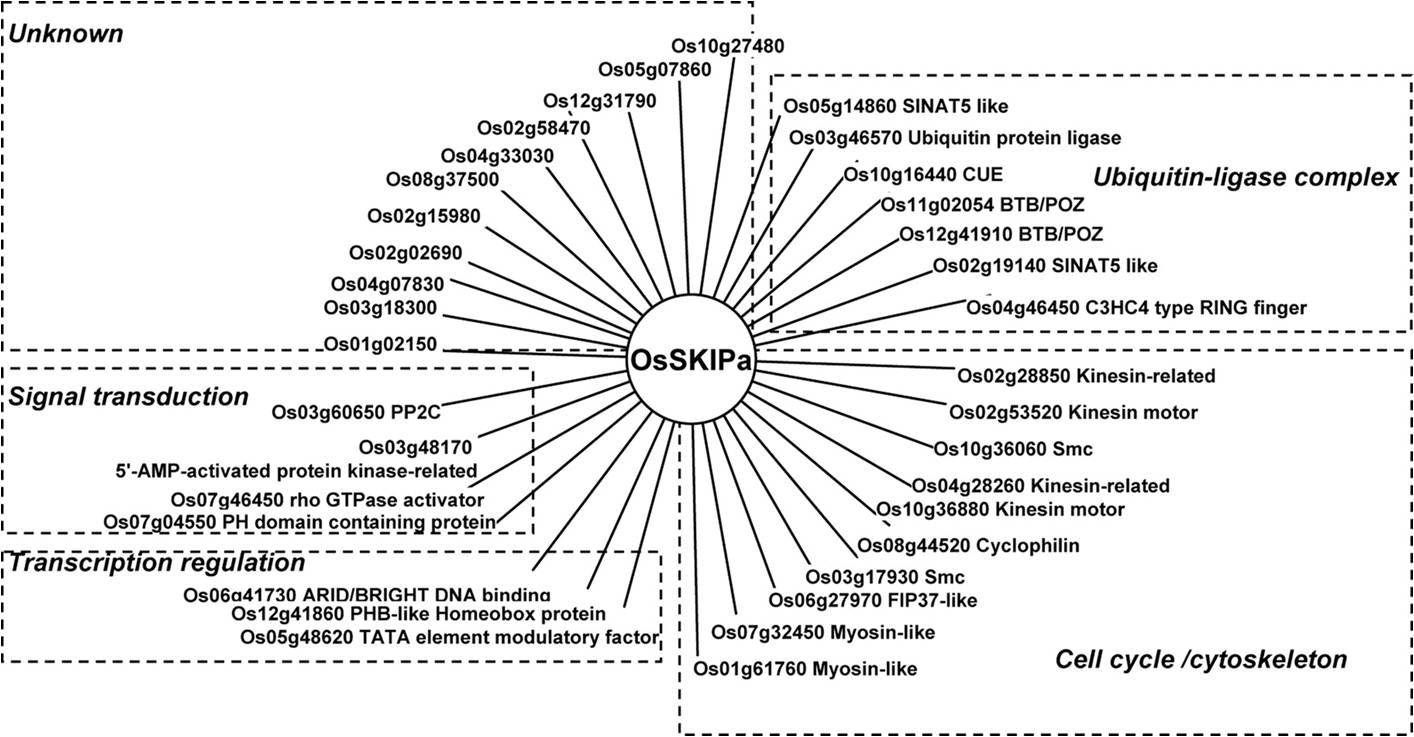
| 09:18, 1 June 2014 | Extension.jpg (file) |  |
138 KB | YanVenice | The OsSKIPa-interacting proteins were classified into 5 categories. | 1 |
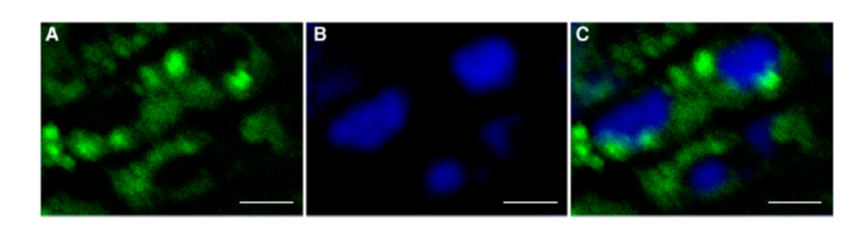
| 09:36, 1 June 2014 | Subcelluler localization of OsHMA2.png (file) |  |
43 KB | DLYmongol | 1 | |
| 09:42, 1 June 2014 | Structure 1.png (file) |  |
4 KB | Crystar | gene stucture of bc12 | 1 |
| 09:42, 1 June 2014 | Subcellular localization of OsHMA2.png (file) |  |
43 KB | DLYmongol | 1 | |
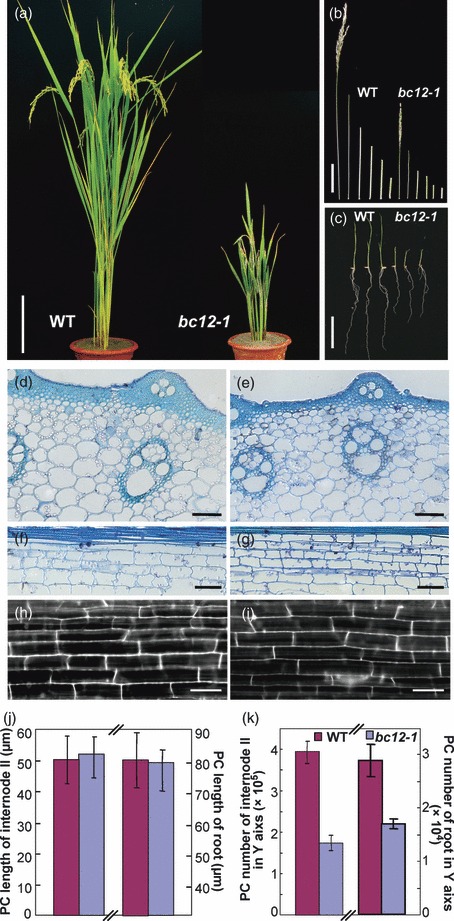
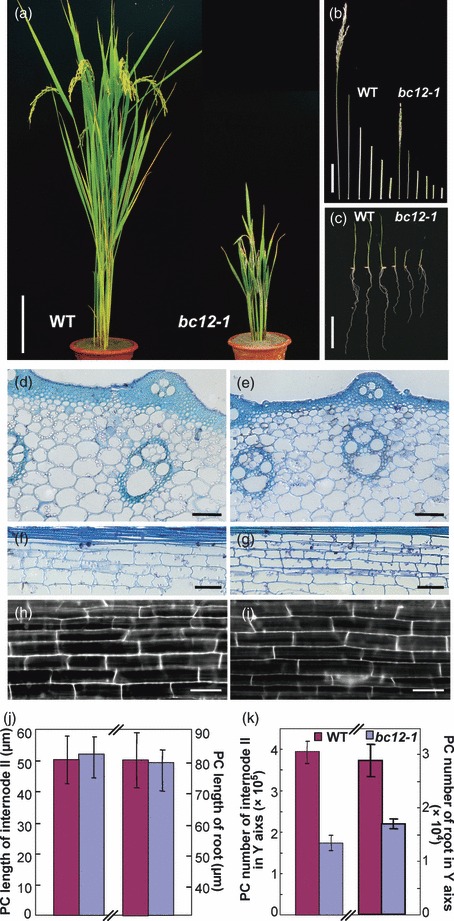
| 10:19, 1 June 2014 | Phenotype1.jpg (file) |  |
140 KB | Crystar | 2 | |
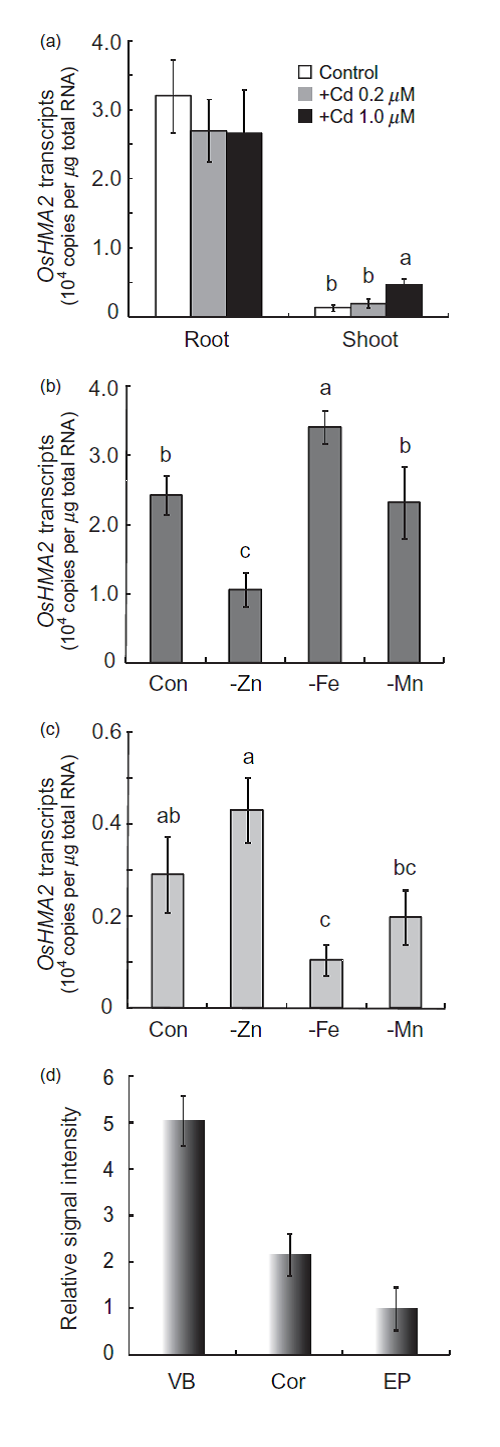
| 10:26, 1 June 2014 | The expression of OsHMA2.png (file) |  |
90 KB | DLYmongol | 1 | |
| 10:29, 1 June 2014 | Phenotype 1.jpg (file) |  |
140 KB | Crystar | 1 | |
| 10:35, 1 June 2014 | Expression pattern.gif (file) |  |
8 KB | Crystar | 1 | |
| 10:35, 1 June 2014 | Evolution11.png (file) |  |
65 KB | Vivian | 1 | |
| 10:37, 1 June 2014 | Expression pattern.jpg (file) |  |
172 KB | Crystar | 1 | |
| 11:47, 1 June 2014 | The concentration of Cd and Zn in shoots,roots and the whole plant.png (file) |  |
229 KB | DLYmongol | 1 | |
| 13:26, 1 June 2014 | Expression pattern of OsC6.jpg (file) |  |
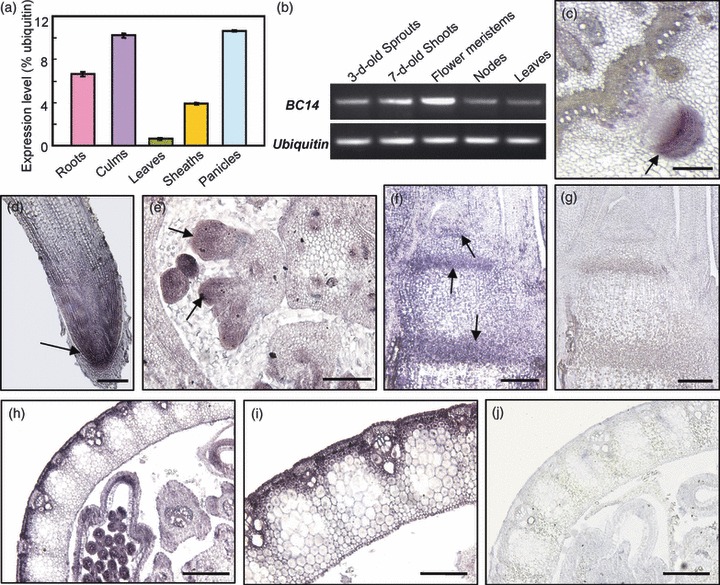
105 KB | Zhaocf | Expression pattern of OsC6. A, Spatial and temporal expression analyses of OsC6 by qRT-PCR. Rice Actin1 (OsActin1) expression was used as a control. Total RNA was isolated from rice tissues: root, shoot, leaf, glume, lemma, palea, pistil at stage 13, and | 1 |
| 13:31, 1 June 2014 | FL1.jpg (file) |  |
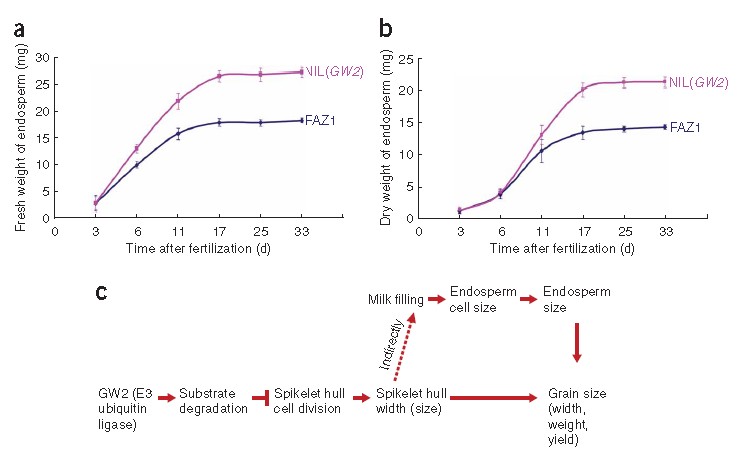
48 KB | Fcgbean | Characterization of grain milk filling in FAZ1 and NIL(GW2) and proposed model for the role of GW2. (a) Time-course of endosperm fresh weight increase. (b) Time-course of endosperm dry weight increase. Data are mean ± s.d. (n ¼ B10 to B15 plants) in a a | 1 |
| 15:25, 1 June 2014 | Ae.png (file) |  |
60 KB | Liyisong | 1 | |
| 15:27, 1 June 2014 | Ig.png (file) |  |
93 KB | Liyisong | 1 | |
| 15:32, 1 June 2014 | Pathway.png (file) |  |
16 KB | Liyisong | 1 | |
| 16:04, 1 June 2014 | FL2.jpg (file) |  |
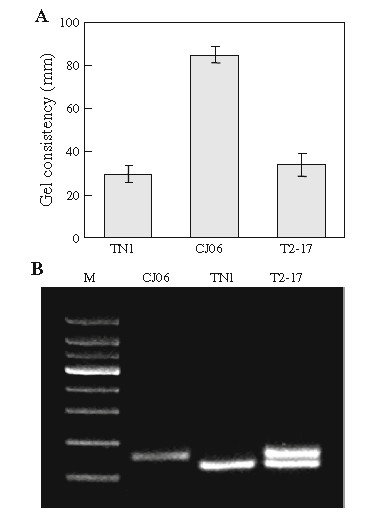
21 KB | Fcgbean | Identification and confirmation of the qGC-6 gene | 1 |
| 17:07, 1 June 2014 | Shijc-Os04g0106300-Fig1.png (file) |  |
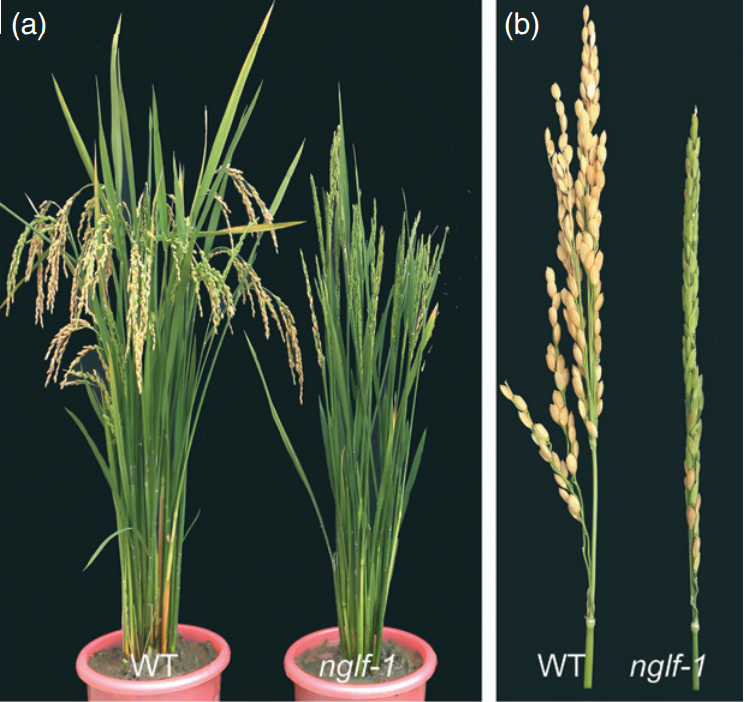
441 KB | Shijc | Phenotypic characteristics of the nglf-1 mutant. | 1 |
| 17:08, 1 June 2014 | Shijc-Os04g0106300-Fig2.png (file) |  |
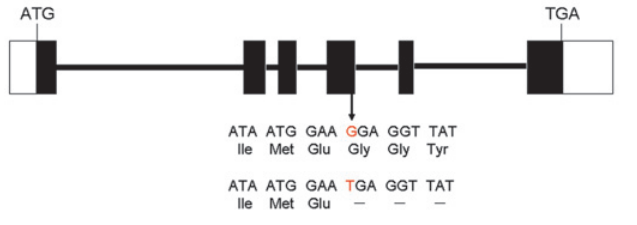
36 KB | Shijc | Schematic diagram of the structure of OsARG. | 1 |
| 17:09, 1 June 2014 | Shijc-Os04g0106300-Fig3.png (file) |  |
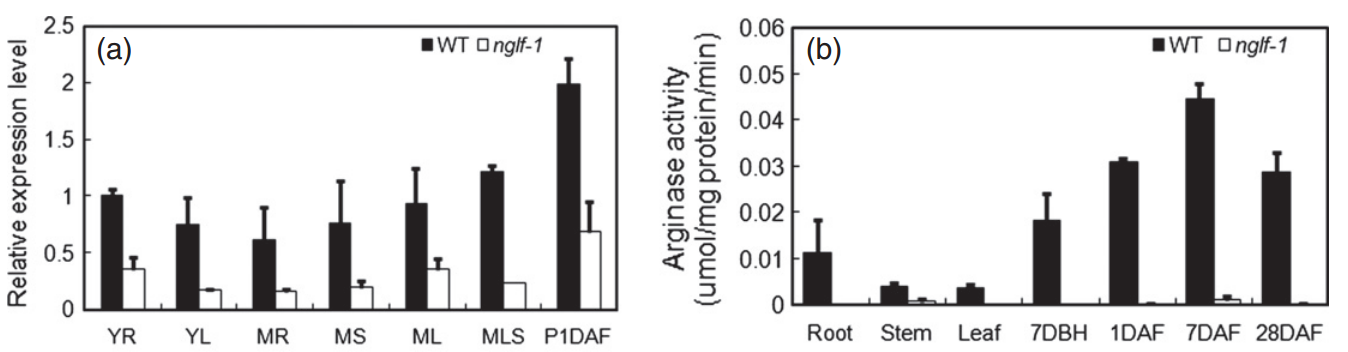
129 KB | Shijc | Expression of OsARG in various organs of WT and mutant nglf-1 analyzed by quantitative RT-PCR analysis. | 1 |
| 17:10, 1 June 2014 | Shijc-Os04g0106300-Fig4.png (file) |  |
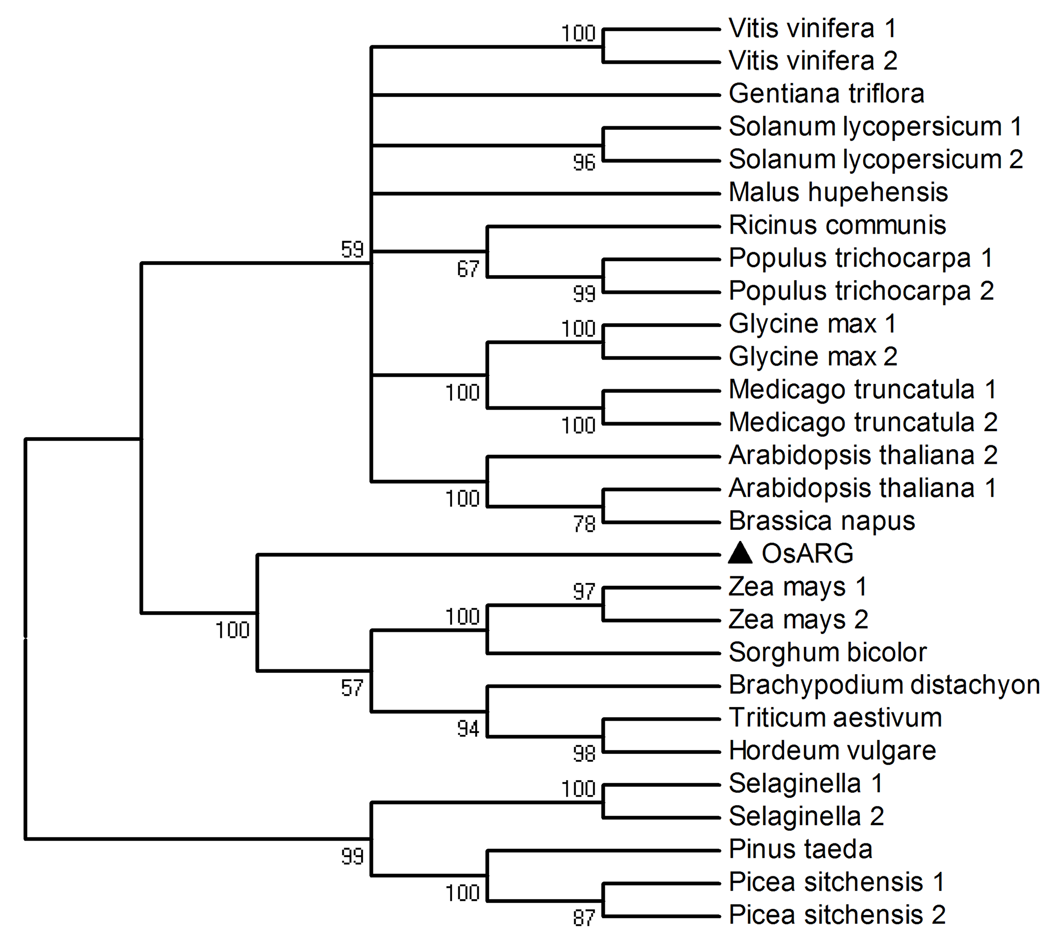
205 KB | Shijc | Phylogenetic analysis of OsARG and related proteins. | 1 |
| 17:58, 1 June 2014 | Y1.png (file) |  |
188 KB | YinQi | 1 |