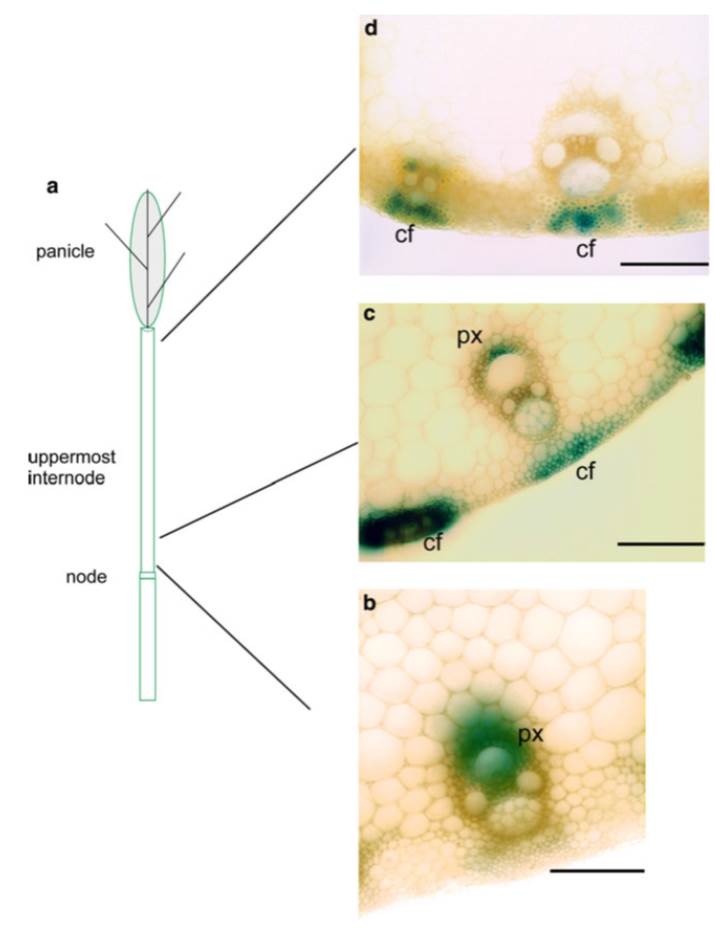
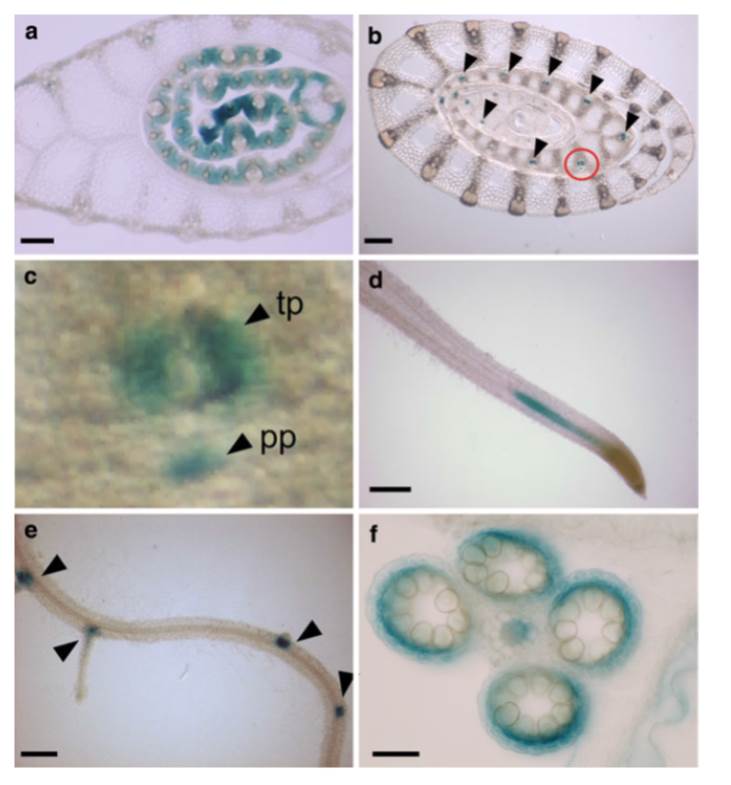
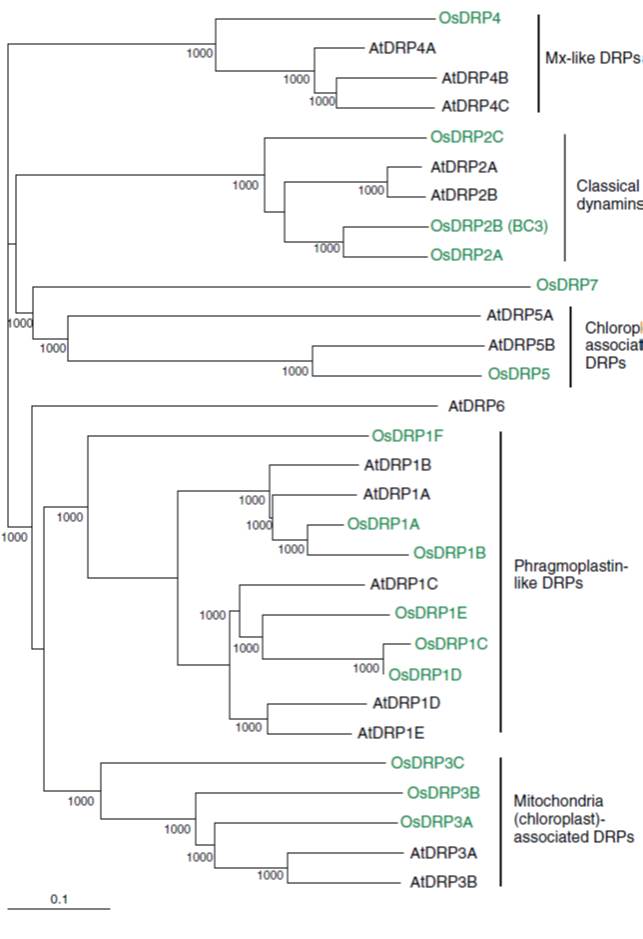
File list
This special page shows all uploaded files.
| Date | Name | Thumbnail | Size | User | Description | Versions |
|---|---|---|---|---|---|---|
| 11:18, 3 June 2014 | HFF7.jpg (file) |  |
27 KB | Huanghs | 1 | |
| 11:18, 3 June 2014 | HHT1.jpg (file) |  |
57 KB | Huanghs | 1 | |
| 11:18, 3 June 2014 | HHT2.jpg (file) |  |
62 KB | Huanghs | 1 | |
| 11:18, 3 June 2014 | HHT3.jpg (file) |  |
44 KB | Huanghs | 1 | |
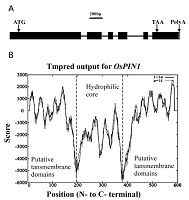
| 11:33, 3 June 2014 | Gene structure and characterization of OsPIN1(1).jpg (file) | .jpg) |
16 KB | Hylwayne | Gene structure and characterization of OsPIN1(1) | 1 |
| 11:34, 3 June 2014 | Gene structure and characterization of OsPIN1(2).jpg (file) | .jpg) |
11 KB | Hylwayne | Gene structure and characterization of OsPIN1(2) | 1 |
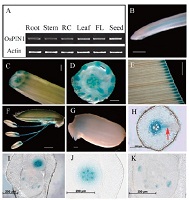
| 11:37, 3 June 2014 | OsPIN1 expression in different tissues.jpg (file) |  |
20 KB | Hylwayne | OsPIN1 expression in different tissues | 1 |
| 11:37, 3 June 2014 | Phenotypes and molecular analyses ofOsPIN2over-expression transgenic plants (O1 and O2) and untranformed wild-type plant (WT).jpg (file) | _and_untranformed_wild-type_plant_(WT).jpg) |
15 KB | Ct | Phenotypes_and_molecular_analyses_ofOsPIN2over-expression_transgenic_plants_(O1_and_O2)_and_untranformed_wild-type_plant_(WT) | 1 |
| 11:38, 3 June 2014 | Changes during grain development in (A) IAA content of rice grains measured by LCMSMS using 13C6 IAA as the internal standard, (B) mean fresh weight and (C) starch content. 1.jpg (file) | _IAA_content_of_rice_grains_measured_by_LCMSMS_using_13C6_IAA_as_the_internal_standard,_(B)_mean_fresh_weight_and_(C)_starch_content._1.jpg) |
12 KB | Liuchongdj | hanges_during_grain_development_in_(A)_IAA_content_of_rice_grains_measured_by_LCMSMS_using_13C6_IAA_as_the_internal_standard,_(B)_mean_fresh_weight_and_(C)_starch_content. | 1 |
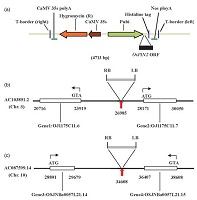
| 11:38, 3 June 2014 | Schematic map of integrated T-DNA insertion site in rice genome.jpg (file) |  |
13 KB | Ct | Schematic_map_of_integrated_T-DNA_insertion_site_in_rice_genome | 1 |
| 11:38, 3 June 2014 | Phenotypes of OsPIN1 transgenic plants.jpg (file) |  |
18 KB | Hylwayne | Phenotypes of OsPIN1 transgenic plants | 1 |
| 11:39, 3 June 2014 | Changes during grain development in (A) IAA content of rice grains measured by LCMSMS using 13C6 IAA as the internal standard, (B) mean fresh weight and (C) starch content. 2.jpg (file) | _IAA_content_of_rice_grains_measured_by_LCMSMS_using_13C6_IAA_as_the_internal_standard,_(B)_mean_fresh_weight_and_(C)_starch_content._2.jpg) |
13 KB | Liuchongdj | Changes during grain development in (A) IAA content of rice grains measured by LCMSMS using 13C6 IAA as the internal standard, (B) mean fresh weight and (C) starch content. | 1 |
| 11:39, 3 June 2014 | Changes during grain development in (A) IAA content of rice grains measured by LCMSMS using 13C6 IAA as the internal standard, (B) mean fresh weight and (C) starch content. 3.jpg (file) | _IAA_content_of_rice_grains_measured_by_LCMSMS_using_13C6_IAA_as_the_internal_standard,_(B)_mean_fresh_weight_and_(C)_starch_content._3.jpg) |
12 KB | Liuchongdj | Changes during grain development in (A) IAA content of rice grains measured by LCMSMS using 13C6 IAA as the internal standard, (B) mean fresh weight and (C) starch content. | 1 |
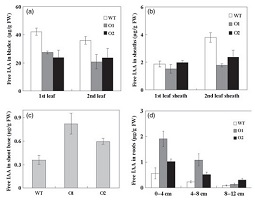
| 11:39, 3 June 2014 | High-performance liquid chromatography analysis.jpg (file) |  |
16 KB | Ct | High-performance liquid chromatography analysis of endogenous free indole-3-acetic acid concentrations in different tissues of 60-day-old wild type, O1 and O2 plants. Data are means of five replicates ± standard deviation. (a) First (left) and second (ri | 1 |
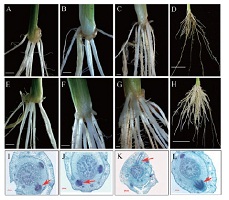
| 11:39, 3 June 2014 | Adventitious roots in OsPIN1 transgenic plants.jpg (file) |  |
26 KB | Hylwayne | Adventitious roots in OsPIN1 transgenic plants | 1 |
| 11:39, 3 June 2014 | Histochemical localization of GUS activity in wild type and O1O2.jpg (file) |  |
27 KB | Ct | Histochemical localization of GUS activity in wild type (A–E; a; d–f), O1 (F–J; b; g–i) and O2 (K–O; c; j–l) carrying DR5::GUS. Plants were stained for GUS activity for 2 h (d–l), 24 h (A–O; a–c). Bar = 1 mm. A, F and K, Tip areas of lea | 1 |
| 11:40, 3 June 2014 | Comparison of the expression of YUCCA, TAATAR and TDC orthologues during grainseed development..jpg (file) |  |
22 KB | Liuchongdj | Comparison of the expression of YUCCA, TAATAR and TDC orthologues during grainseed development. | 1 |
| 11:40, 3 June 2014 | GUS expression in root tips of wild type.jpg (file) |  |
14 KB | Ct | GUS expression in root tips of wild type (a, d), O1 (b, e) and O2 (c, f) seedlings carrying DR5::GUS with NPA treatment or not. Root tips were stained for GUS activity for 2 h. Bar = 100lm. (a–c) root tips of 21-day-old seedlings grown in IRRI nutrition | 1 |
| 11:40, 3 June 2014 | Quantitative RT–PCR results for OsYUC3, OsYUC 9, OsYUC 11, OsYUC 12, OsYUC 14, OsTAR1, OsTAR2 and OsTDC1..jpg (file) |  |
21 KB | Liuchongdj | Quantitative RT–PCR results for OsYUC3, OsYUC 9, OsYUC 11, OsYUC 12, OsYUC 14, OsTAR1, OsTAR2 and OsTDC1. | 1 |
| 11:40, 3 June 2014 | RT-PCR analysis of two tiller angle–related genes andOsPIN1expression level in wild type and O1O2.jpg (file) |  |
14 KB | Ct | RT-PCR analysis of two tiller angle–related genes andOsPIN1expression level in wild type (WT), O1 and O2.OsActinwas used as a control. The amplification ofOsLazy1(a), OsTAC1(b), OsPIN1(b) and OsActin(c) transcripts was performed from total RNA isolated | 1 |
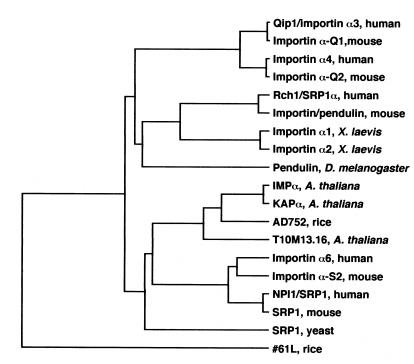
| 11:41, 3 June 2014 | Fig 7.jpg (file) |  |
22 KB | Lvying | Phylogenetic tree of importinK. The tree was constructed by the UPGMA method using the GENETYX-MAC 7.3 software(Software Development Co., Tokyo) with default parameters. The accession number of the putative open reading frame T10M13.16 which is predicted | 1 |
| 11:41, 3 June 2014 | Phylogenetic tree of Trp decarboxylases and sequence homologues sequences were obtained by BLASTp search of proteomes of Rice (Os), Arabidopsis (At), Sorghum (Sb) and Poplar (POPTR)..jpg (file) | ,_Arabidopsis_(At),_Sorghum_(Sb)_and_Poplar_(POPTR)..jpg) |
14 KB | Liuchongdj | Phylogenetic tree of Trp decarboxylases and sequence homologues sequences were obtained by BLASTp search of proteomes of Rice (Os), Arabidopsis (At), Sorghum (Sb) and Poplar (POPTR). | 1 |
| 11:41, 3 June 2014 | Phylogenetic tree of FMOs from rice (Os), Arabidopsis (At), Selaginella (Smoe), Physcomitrella (Ppls) and Chlamydomonas (CrCre)..jpg (file) | ,_Arabidopsis_(At),_Selaginella_(Smoe),_Physcomitrella_(Ppls)_and_Chlamydomonas_(CrCre)..jpg) |
17 KB | Liuchongdj | Phylogenetic tree of FMOs from rice (Os), Arabidopsis (At), Selaginella (Smoe), Physcomitrella (Ppls) and Chlamydomonas (CrCre). | 1 |
| 12:39, 3 June 2014 | One.jpg (file) |  |
227 KB | Zhchuny | 2 | |
| 12:41, 3 June 2014 | 图片.docx (file) |  |
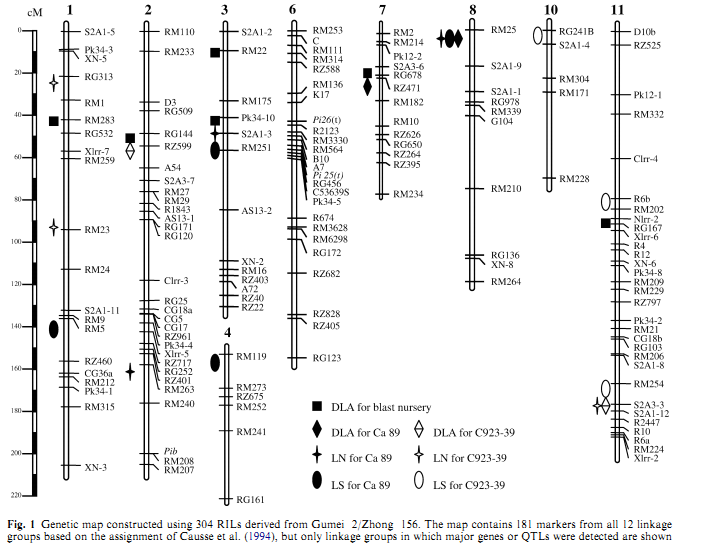
122 KB | Jiaofang13 | This is the genetic map constructed using 304 RILs derived from Gumei 2/Zhong 156. The map contains 181 markers from all 12 linkage groups based on the assignment of Causse et al. (1994), but only linkage groups in which major genes or QTLs were detected | 2 |
| 13:02, 3 June 2014 | 图片3.jpg (file) |  |
35 KB | Zengying | 3 | |
| 13:03, 3 June 2014 | 图片2.jpg (file) |  |
44 KB | Zengying | 3 | |
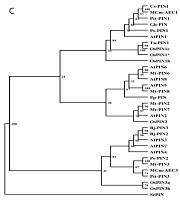
| 13:26, 3 June 2014 | Neighbour-joining phylogenetic trees showing the predicted relationship between Arabidopsis AtPINs and (a) dicot (Medicago, soybean and potato) and (b) monocot (rice and wheat) PINs.jpg (file) | _dicot_(Medicago,_soybean_and_potato)_and_(b)_monocot_(rice_and_wheat)_PINs.jpg) |
85 KB | Ct | The alignment on which the tree is based was prepared using ClustalX 1.81. The phylograms were drawn using Tree-View 1.6.6 (http://darwin.zoology.gla.ac.uk/∼rpage/treeviewx/). Amino acid sequences for Arabidopsis were taken from http://www.Arabidopsis.o | 1 |
| 13:27, 3 June 2014 | 图片2.docx (file) | |
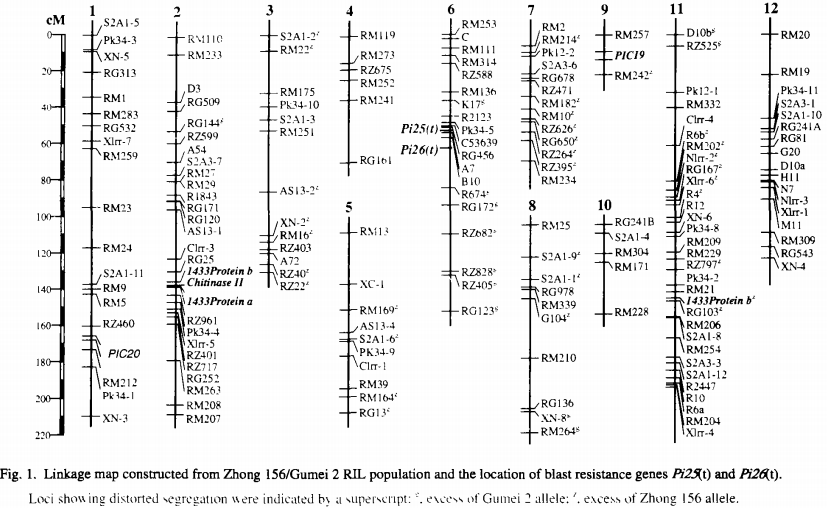
127 KB | Jiaofang13 | This is the linkage map constructed from Zhong 156/Gumei 2 RIL population and the location of blast resistance gene Pi25(t) and Pi26(t).Loci showing distorted segeration were indicated by a superseript:excess of Gumei 2 allele:excess of Zhong 156 allele. | 1 |
| 13:27, 3 June 2014 | 图片5.jpg (file) |  |
49 KB | Zengying | 3 | |
| 13:54, 3 June 2014 | Linkage map.png (file) |  |
190 KB | Jiaofang13 | 1 | |
| 14:02, 3 June 2014 | Genetic map.png (file) |  |
142 KB | Jiaofang13 | 1 | |
| 14:08, 3 June 2014 | Three.jpg (file) |  |
285 KB | Zhchuny | 2 | |
| 14:10, 3 June 2014 | Two.jpg (file) |  |
373 KB | Zhchuny | 5 | |
| 14:50, 3 June 2014 | Figure 1 In situ RNA expression patterns of OsMADS1 compared with OsMGH3. (a–f) OsMADS1 profile in developing inflorescence branch primordia and spikelets. Silver grains reveal regions with expression.jpg (file) | _OsMADS1_profile_in_developing_inflorescence_branch_primordia_and_spikelets._Silver_grains_reveal_regions_with_expression.jpg) |
135 KB | Zhdjsh | In situ RNA expression patterns of OsMADS1 compared with OsMGH3. (a–f) OsMADS1 profile in developing inflorescence branch primordia and spikelets. Silver grains reveal regions with expression. (a) Sense OsMADS1 RNA probe as a control. (b–f) Hybridizat | 1 |
| 14:59, 3 June 2014 | Map-based cloning of the DEP2 gene.png (file) |  |
62 KB | Wangzhaoyu | 1 | |
| 15:16, 3 June 2014 | DEP2 expression pattern.png (file) |  |
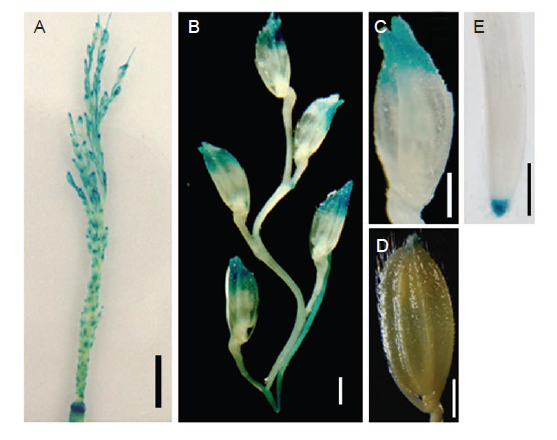
193 KB | Wangzhaoyu | DEP2 expression pattern was revealed by the transformants with DEP2 promoter – GUS. GUS staining is found in young panicles (A), young florets (B, C), and in root (E), but not in old panicles (D). | 1 |
| 15:40, 3 June 2014 | Four.jpg (file) |  |
502 KB | Zhchuny | 1 | |
| 15:41, 3 June 2014 | Resistance genes.png (file) |  |
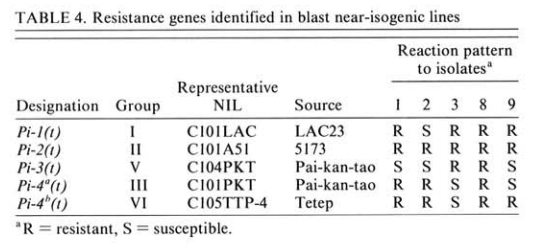
93 KB | Jiaofang13 | Resistance genes identified in blast near-isogenic lines. | 1 |
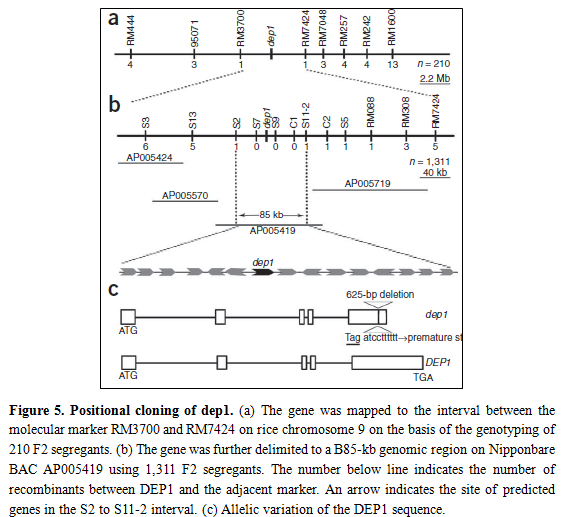
| 16:04, 3 June 2014 | Positonal cloning of dep1.jpg (file) |  |
292 KB | ZhuXiping | 3 | |
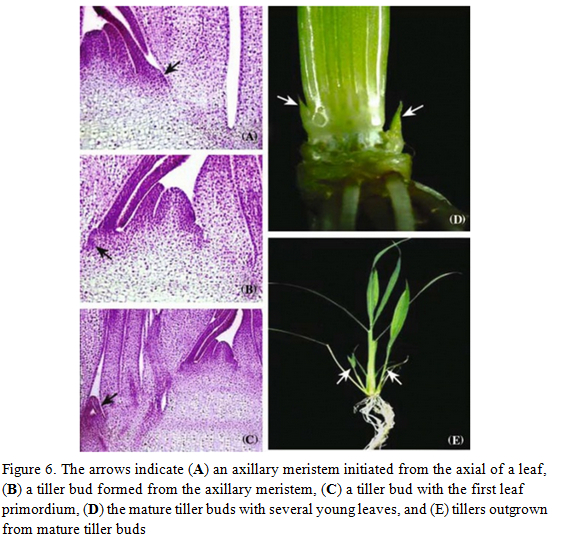
| 16:18, 3 June 2014 | The tillering of rice.jpg (file) |  |
343 KB | ZhuXiping | 1 | |
| 16:24, 3 June 2014 | The tillering of rice. .jpg (file) |  |
292 KB | ZhuXiping | 1 | |
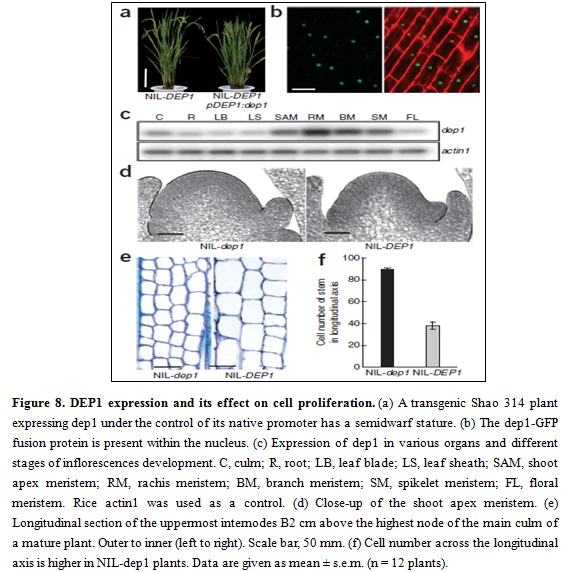
| 16:25, 3 June 2014 | DEP1 expression and its effect on cell proliferation.jpg (file) |  |
402 KB | ZhuXiping | 1 | |
| 16:25, 3 June 2014 | The phenotype of NIL-dep1 plants.jpg (file) |  |
311 KB | ZhuXiping | 1 | |
| 01:36, 4 June 2014 | Evolution.png (file) |  |
36 KB | Huifenghechang1990 | 3 | |
| 04:43, 4 June 2014 | Rice1.png (file) |  |
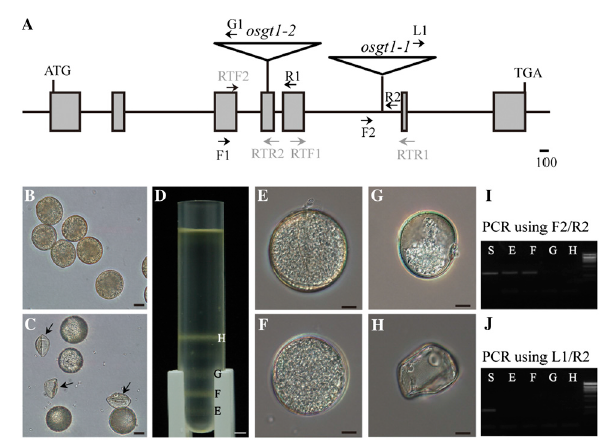
208 KB | Tracy | Figure 1. Schematic diagrams of OsGT1 and aberrant pollen phenotype in osgt1 mutant. A, T-DNA insertion positions. Start and stop codons are represented as ATG and TGA, respectively; positions of insertion are shown with triangles. Shaded boxes indicate e | 1 |
| 05:02, 4 June 2014 | Image2.png (file) |  |
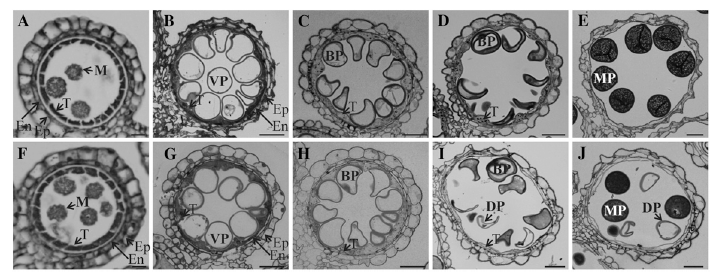
238 KB | Tracy | Figure 2. Light microscopy observation of anthers at different developmental stages. Cross sections are shown from segregating wild type (A–E) and OsGT1/osgt1-1 (F–J) at early microspore stage (A and F), vacuolated stage (B and G), mitotic division st | 1 |
| 05:10, 4 June 2014 | Image3-.png (file) |  |
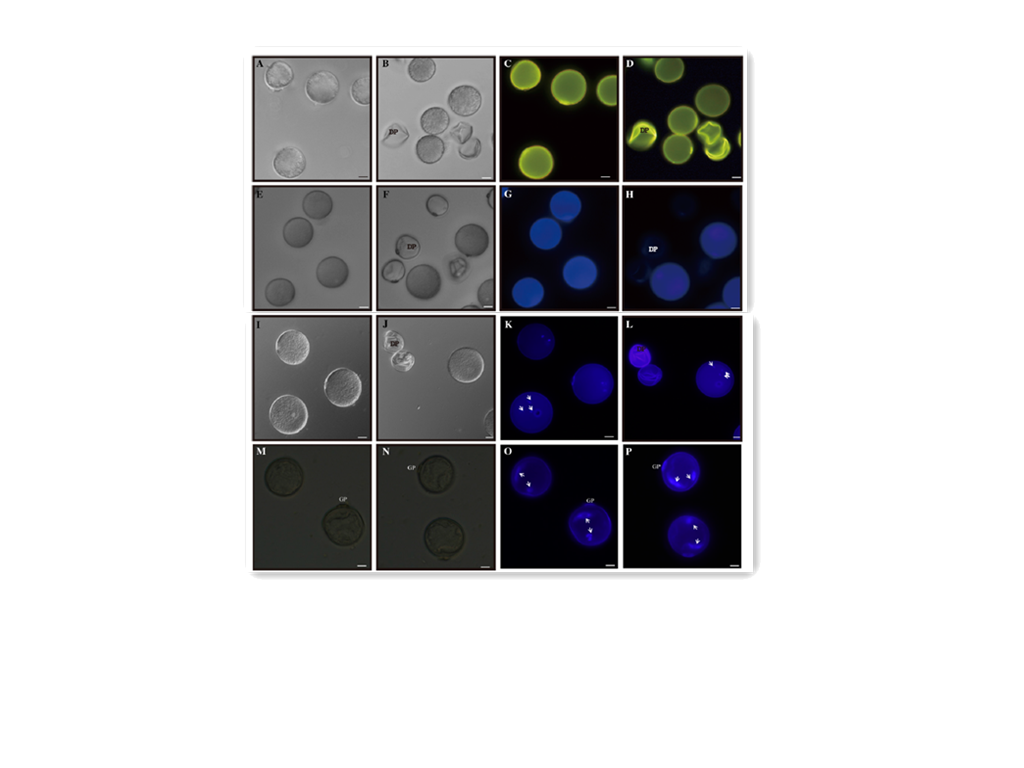
343 KB | Tracy | Figure 3. Phenotypes of pollen grains. A to D, Auramine O staining of grains from segregating wild-type (A and C) and OsGT1/ osgt1-1 (B and D) plants at stage 12 observed under bright-field (A and B) and fluorescence (C and D) microscopy. E to H, Calcoflu | 1 |
| 05:11, 4 June 2014 | Image4.png (file) |  |
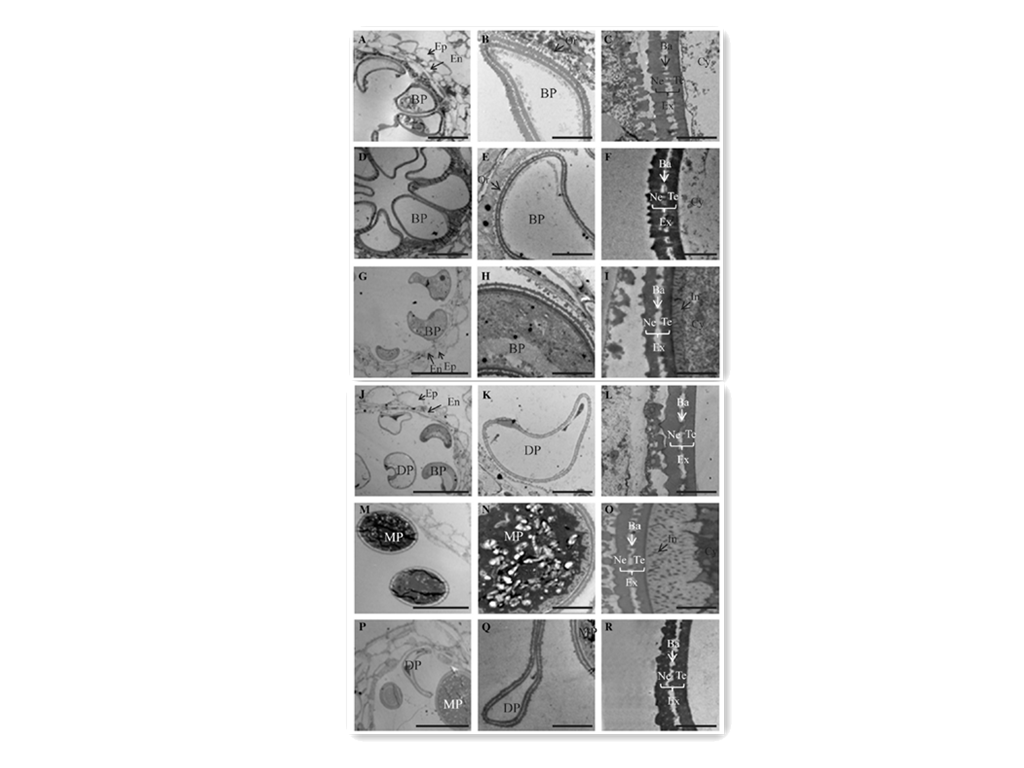
355 KB | Tracy | Figure 4. TEM analyses of developing anthers from wild-type (A–C, G–I, and M–O) and OsGT1/osgt1-1 (D–F, J–L, and P–R) plants at stage 11a (A–F), stage 11b (G–L), and stage 12 (M–R). Ba, Bacula; BP, binuclear pollen; Cy, cytosol; DP, defe | 1 |
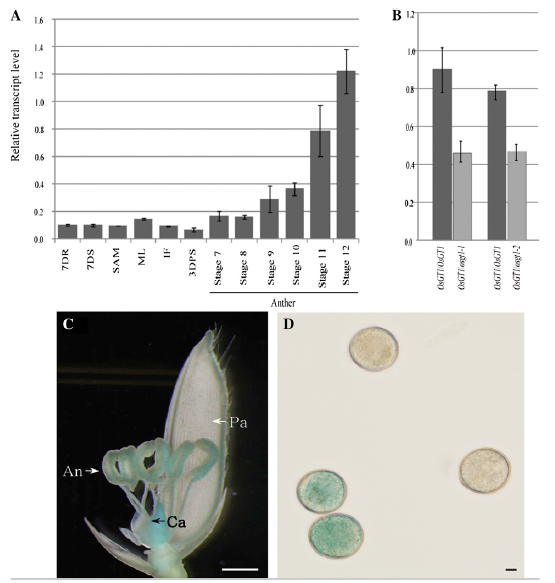
| 05:12, 4 June 2014 | Image5.png (file) |  |
166 KB | Tracy | Figure 5. Expression pattern of OsGT1. A, Quantitative RT-PCR analyses in various organs. Transcript levels were normalized to UBIQUITIN and calculated by the comparative cycle threshold method. Error bars indicate SD. 7DR, Seven-day-old seedling roots; 7 | 1 |