File list
This special page shows all uploaded files.
| Date | Name | Thumbnail | Size | User | Description | Versions |
|---|---|---|---|---|---|---|
| 05:13, 4 June 2014 | Image6.png (file) |  |
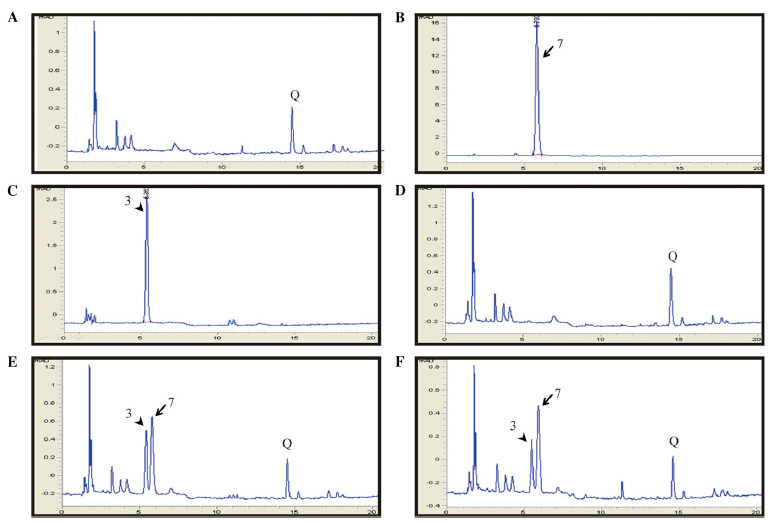
108 KB | Tracy | Figure 6. Glycosyltransferase assay. A to C, Quercetin (A) and its glucosides, quercetin-3-O-glucoside (B) and quercetin-7-Oglucoside (C), were separated by HPLC. D and E, Chromatograms of assay products using GST protein as a negative control (D) and AtG | 1 |
| 05:14, 4 June 2014 | Image7.png (file) |  |
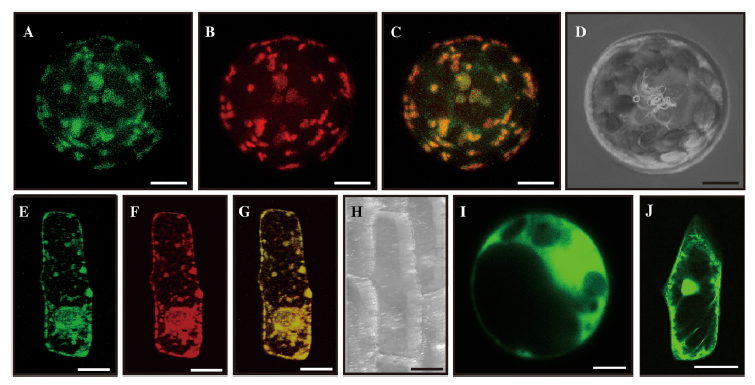
302 KB | Tracy | Figure 7. Subcellular localization. A to D, Mesophyll protoplasts prepared from young seedlings were cotransformed with fusion constructs Pubi::OsGT1-GFP and P35S::ManI-RFP. Images observed under GFP channel (A) and RFP channel (B) were merged (C); D is a | 1 |
| 05:15, 4 June 2014 | Image8.png (file) |  |
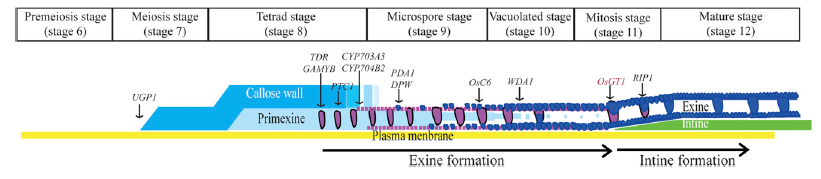
81 KB | Tracy | Figure 8. Schematic diagram of rice pollen wall development based on stages described by Li et al. (2010). Genes involved in this process are represented. Arrows indicate times when mutant phenotypes become visible. | 1 |
| 05:16, 4 June 2014 | Table1.png (file) |  |
24 KB | Tracy | 2 | |
| 05:16, 4 June 2014 | Table2.png (file) |  |
23 KB | Tracy | 1 | |
| 06:54, 4 June 2014 | Fig. 2.jpg (file) |  |
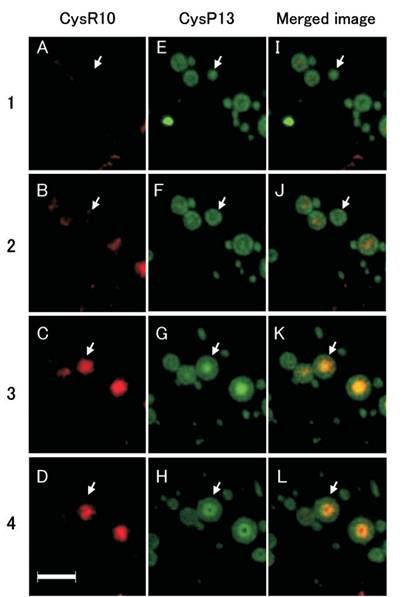
24 KB | Littlescrew | Immunofluorescence microscopy of serial sections of PB-Is obtained from developing rice endosperm at 3 WAF . The numbers at the left of the image denote the order of the sections. The PBs in each section were labeled with antibodies against CysR10 and Cys | 1 |
| 07:08, 4 June 2014 | Figure nmm1.jpg (file) |  |
107 KB | 海蓝生物 | BSP domain | 1 |
| 07:27, 4 June 2014 | BSP gene structure.jpg (file) |  |
273 KB | 海蓝生物 | BSP gene structure | 1 |
| 07:34, 4 June 2014 | BSP domain.jpg (file) |  |
107 KB | 海蓝生物 | 1 | |
| 07:52, 4 June 2014 | Eg-1.jpg (file) |  |
53 KB | Suchao13 | 1 | |
| 08:02, 4 June 2014 | Eg-2.jpg (file) |  |
71 KB | Suchao13 | 1 | |
| 08:02, 4 June 2014 | Eg-3.jpg (file) |  |
38 KB | Suchao13 | 1 | |
| 08:02, 4 June 2014 | Eg-4.jpg (file) |  |
159 KB | Suchao13 | 1 | |
| 08:03, 4 June 2014 | Eg-5.jpg (file) |  |
148 KB | Suchao13 | 1 | |
| 08:23, 4 June 2014 | Eg-6.jpg (file) |  |
59 KB | Suchao13 | 1 | |
| 08:23, 4 June 2014 | Eg-7.jpg (file) |  |
107 KB | Suchao13 | 1 | |
| 08:25, 4 June 2014 | Eg-9.jpg (file) |  |
154 KB | Suchao13 | 1 | |
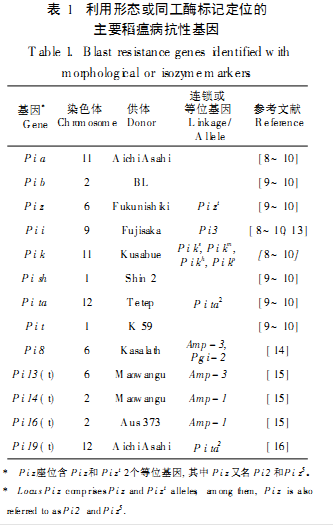
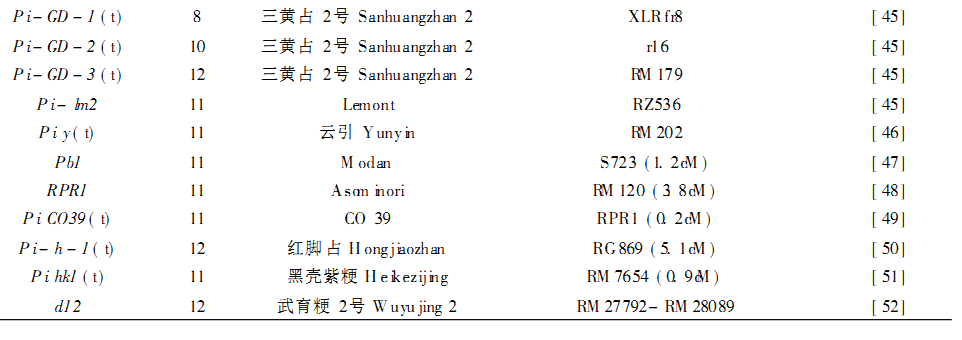
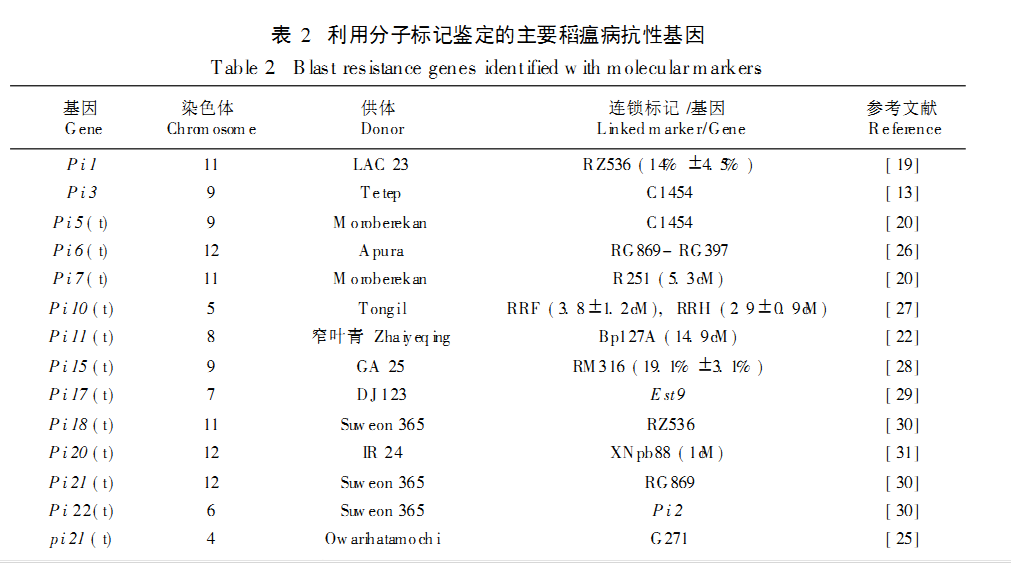
| 08:31, 4 June 2014 | Blast resistance genes.png (file) |  |
42 KB | Jiaofang13 | 1 | |
| 08:36, 4 June 2014 | Eg-10.jpg (file) |  |
137 KB | Suchao13 | 1 | |
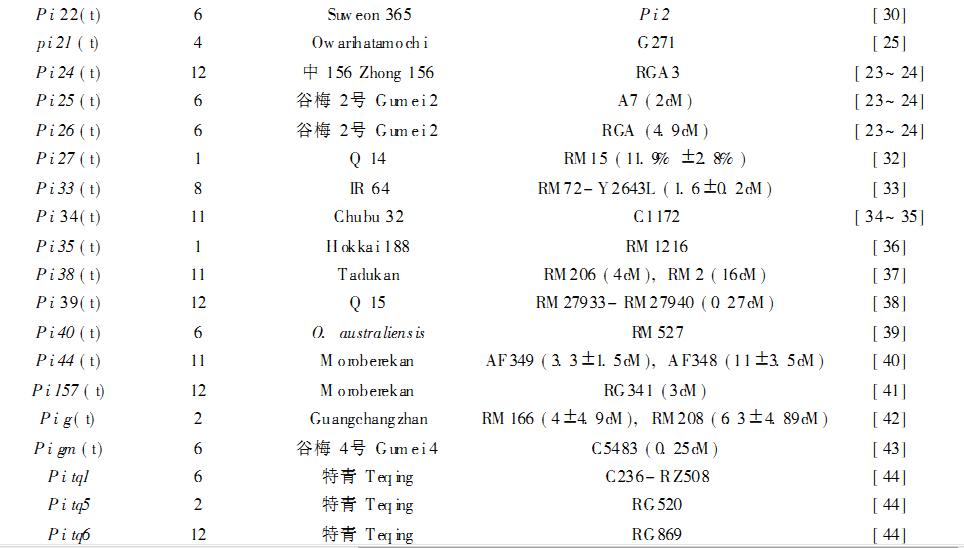
| 08:46, 4 June 2014 | Blast resistance genes4.png (file) |  |
57 KB | Jiaofang13 | 1 | |
| 08:47, 4 June 2014 | Blast resistance genes2.png (file) |  |
86 KB | Jiaofang13 | 1 | |
| 08:47, 4 June 2014 | Blast resistance genes3.png (file) |  |
90 KB | Jiaofang13 | 1 | |
| 09:08, 4 June 2014 | FIGURE4.png (file) |  |
1.61 MB | Jixiang | 1 | |
| 09:08, 4 June 2014 | FIGURE3.png (file) |  |
745 KB | Jixiang | 1 | |
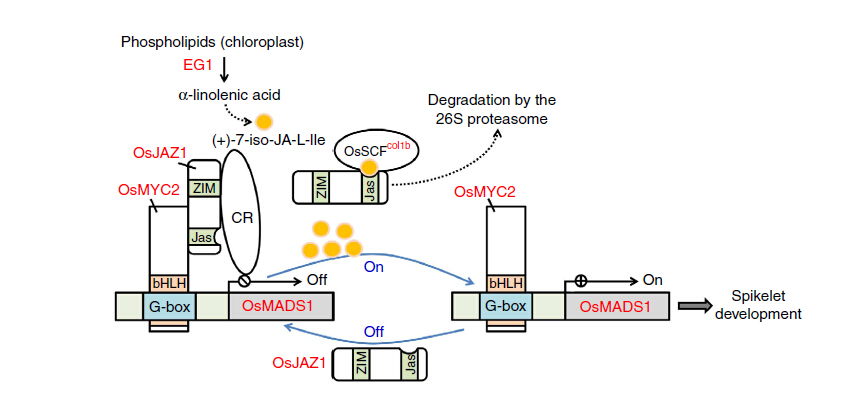
| 09:08, 4 June 2014 | Hypothetical model.jpg (file) |  |
74 KB | Jixiang | 1 | |
| 09:09, 4 June 2014 | THE STUCTURE.png (file) |  |
229 KB | Jixiang | 1 | |
| 09:14, 4 June 2014 | Figure 1.The rice hei10-1 mutant phenotype.jpg (file) |  |
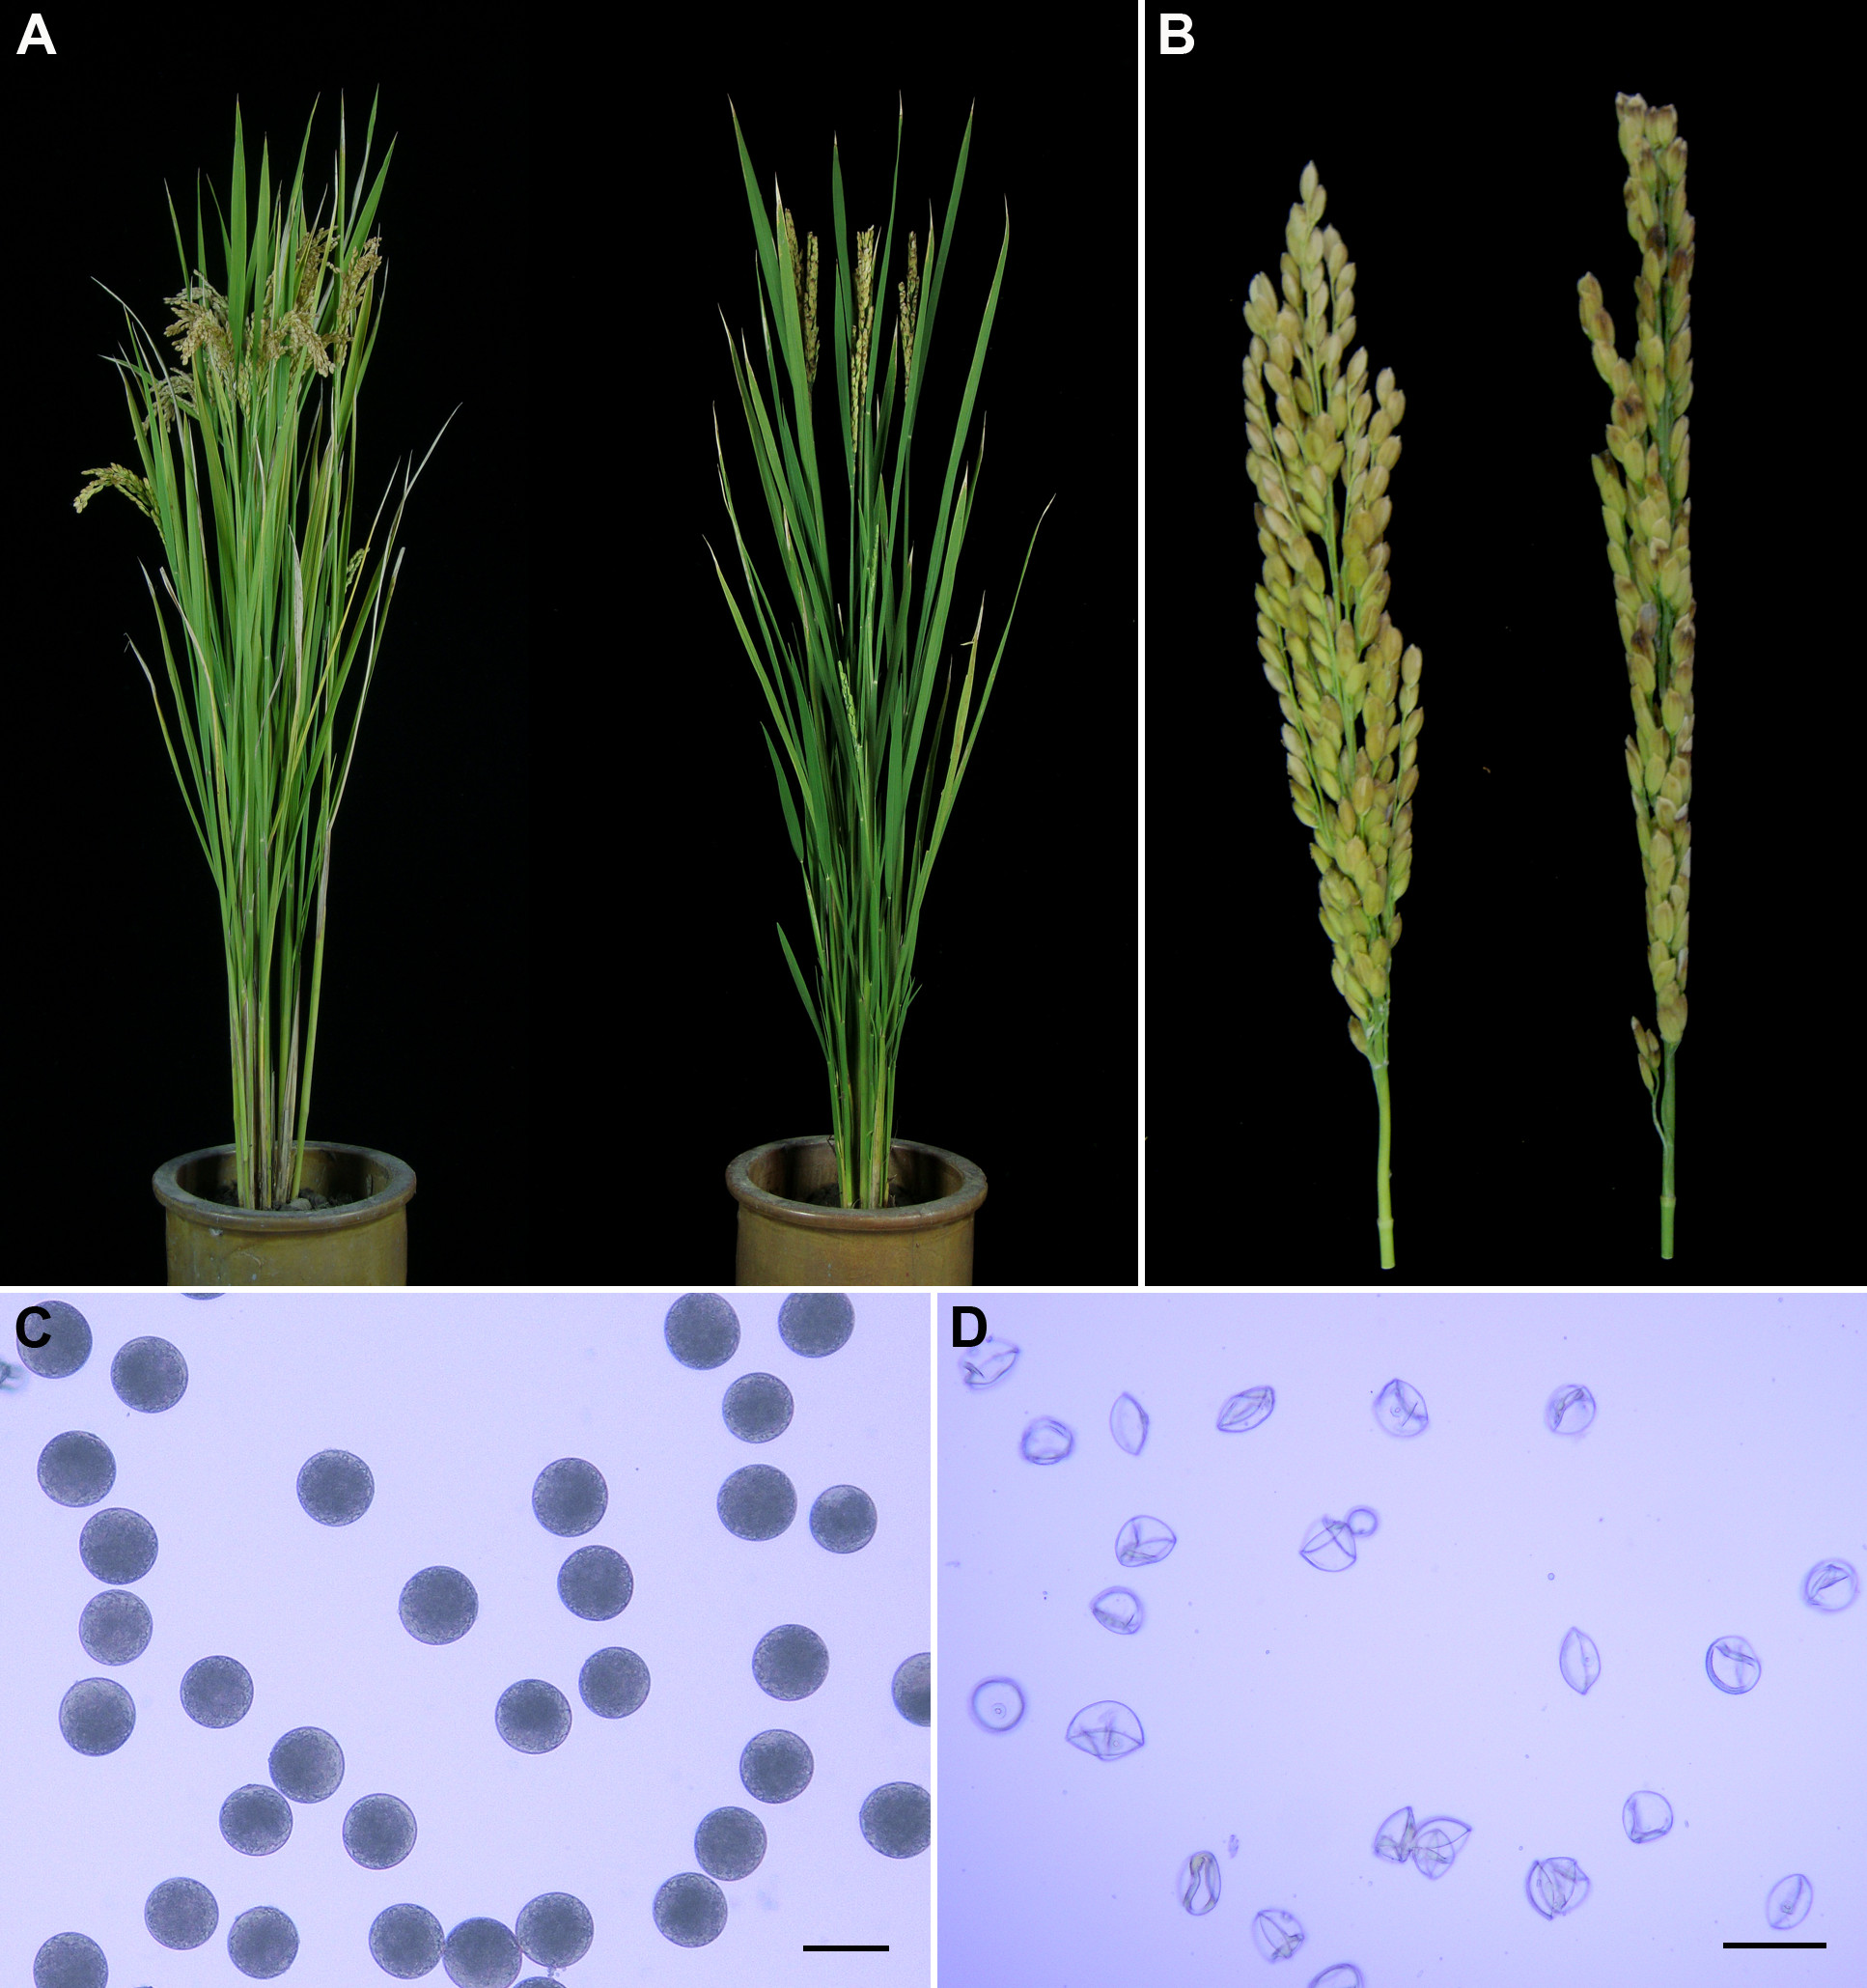
4.34 MB | Simon | (A) Comparison of a WT plant (left) and a hei10-1 mutant plant (right). (B) Comparison of a WT panicle (left) and a hei10-1 mutant panicle (right). (C) Fertile pollen grains in a WT plant. (D) Sterile pollen grains in a hei10-1 mutant plant. Scale bars: 5 | 1 |
| 09:15, 4 June 2014 | S.jpg (file) |  |
39 KB | Jixiang | 1 | |
| 09:30, 4 June 2014 | GEO profile1.jpg (file) |  |
106 KB | 海蓝生物 | 1 | |
| 09:30, 4 June 2014 | GEO profile2.jpg (file) |  |
99 KB | 海蓝生物 | 1 | |
| 09:31, 4 June 2014 | GEO profile3.jpg (file) |  |
125 KB | 海蓝生物 | 1 | |
| 09:31, 4 June 2014 | GEO profile4.jpg (file) |  |
129 KB | 海蓝生物 | 1 | |
| 09:31, 4 June 2014 | GEO profile5.jpg (file) |  |
141 KB | 海蓝生物 | 1 | |
| 09:32, 4 June 2014 | GEO profile6.jpg (file) |  |
112 KB | 海蓝生物 | 1 | |
| 09:32, 4 June 2014 | GEO profile7.jpg (file) |  |
132 KB | 海蓝生物 | 1 | |
| 09:32, 4 June 2014 | GEO profile8.jpg (file) |  |
99 KB | 海蓝生物 | 1 | |
| 09:33, 4 June 2014 | GEO profile9.jpg (file) |  |
149 KB | 海蓝生物 | 1 | |
| 09:33, 4 June 2014 | GEO profile10.jpg (file) |  |
201 KB | 海蓝生物 | 1 | |
| 09:33, 4 June 2014 | GEO profile11.jpg (file) |  |
200 KB | 海蓝生物 | 1 | |
| 09:34, 4 June 2014 | GEO profile12.jpg (file) |  |
150 KB | 海蓝生物 | 1 | |
| 09:34, 4 June 2014 | GEO profile13.jpg (file) |  |
137 KB | 海蓝生物 | 1 | |
| 09:34, 4 June 2014 | GEO profile14.jpg (file) |  |
245 KB | 海蓝生物 | 1 | |
| 09:34, 4 June 2014 | GEO profile15.jpg (file) |  |
341 KB | 海蓝生物 | 1 | |
| 09:50, 4 June 2014 | The rice hei10-1 mutant phenotype.jpg (file) |  |
647 KB | Simon | (A) Comparison of a WT plant (left) and a hei10-1 mutant plant (right). (B) Comparison of a WT panicle (left) and a hei10-1 mutant panicle (right). (C) Fertile pollen grains in a WT plant. (D) Sterile pollen grains in a hei10-1 mutant plant. Scale bars: 5 | 2 |
| 09:51, 4 June 2014 | Figure 2.Organization of the HEI10 gene and protein alignment.jpg (file) |  |
18 KB | Simon | (A) Schematic representation of HEI10 gene and the location of hei10 mutation. Translated regions are represented by black boxes and untranslated regions are indicated by white boxes. HEI10A and HEI10B indicate long and short transcripts, respectively. d | 1 |
| 10:00, 4 June 2014 | Figure 3.Meiosis in the hei10-1 mutant.jpg (file) |  |
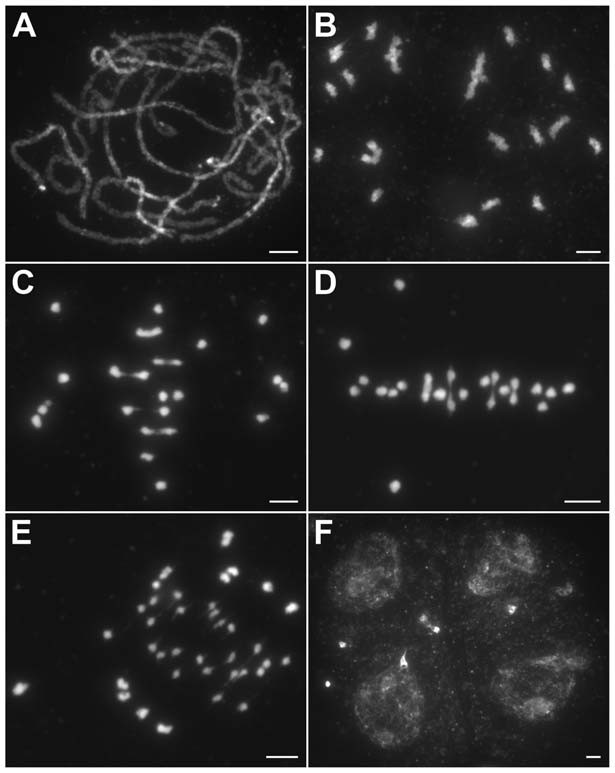
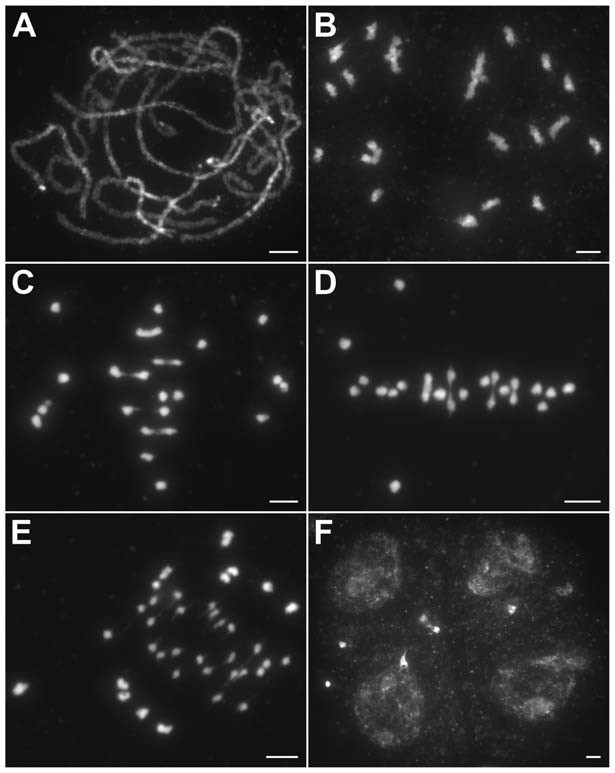
61 KB | Simon | (A) Pachytene. (B) Diakinesis with both bivalents and univalents. (C) Metaphase I with five bivalents and fourteen univalents. (D) Metaphase I with four bivalents and sixteen univalents. Thirteen univalents and all bivalents align on the equatorial plate | 1 |
| 10:02, 4 June 2014 | Figure 4. Analysis of the distribution of HEI10 bright foci in WT meiocytes.jpg (file) |  |
71 KB | Simon | (A) Dual immunolocalization of WT scattered chromosomes with REC8 (red) and HEI10 (green) antibodies. Scale bar: 5 mm. (B) Dual immunolocalization of CENH3 and HEI10 at late pachytene. (C) No HEI10 signals were detected at metaphase I, chromosomes are sta | 1 |
| 10:10, 4 June 2014 | Figure111.jpg (file) |  |
647 KB | Simon | (A) Comparison of a WT plant (left) and a hei10-1 mutant plant (right). (B) Comparison of a WT panicle (left) and a hei10-1 mutant panicle (right). (C) Fertile pollen grains in a WT plant. (D) Sterile pollen grains in a hei10-1 mutant plant. Scale bars: 5 | 1 |
| 10:10, 4 June 2014 | Figure222.jpg (file) |  |
18 KB | Simon | (A) Schematic representation of HEI10 gene and the location of hei10 mutation. Translated regions are represented by black boxes and untranslated regions are indicated by white boxes. HEI10A and HEI10B indicate long and short transcripts, respectively. | 2 |
| 10:11, 4 June 2014 | Figure333.jpg (file) |  |
61 KB | Simon | (A) Pachytene. (B) Diakinesis with both bivalents and univalents. (C) Metaphase I with five bivalents and fourteen univalents. (D) Metaphase I with four bivalents and sixteen univalents. Thirteen univalents and all bivalents align on the equatorial plate | 1 |