File list
This special page shows all uploaded files.
| Date | Name | Thumbnail | Size | User | Description | Versions |
|---|---|---|---|---|---|---|
| 04:56, 7 June 2014 | Fig7.png (file) |  |
45 KB | Amy | 2 | |
| 05:01, 7 June 2014 | Fig8.jpg (file) |  |
105 KB | Amy | 1 | |
| 05:02, 7 June 2014 | Tree.png (file) |  |
46 KB | Liyisong | Reverted to version as of 14:22, 1 June 2014 | 4 |
| 05:05, 7 June 2014 | Treelyss.png (file) |  |
46 KB | Liyisong | new | 1 |
| 05:25, 7 June 2014 | Rice 141.jpg (file) |  |
52 KB | Hancychan | 1 | |
| 05:33, 7 June 2014 | Rice 142.jpg (file) |  |
49 KB | Hancychan | 1 | |
| 05:44, 7 June 2014 | 图片6.png (file) |  |
67 KB | Ricelove | 1 | |
| 05:54, 7 June 2014 | 图片7.png (file) |  |
268 KB | Ricelove | 1 | |
| 06:09, 7 June 2014 | 图片8.png (file) |  |
183 KB | Ricelove | 1 | |
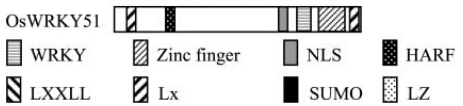
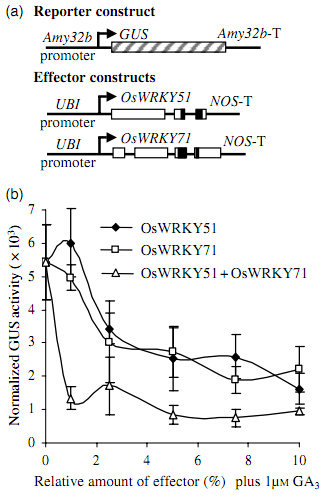
| 06:40, 7 June 2014 | OsWRKY51 CONSTYUCT.png (file) |  |
41 KB | Happinessforever | 1 | |
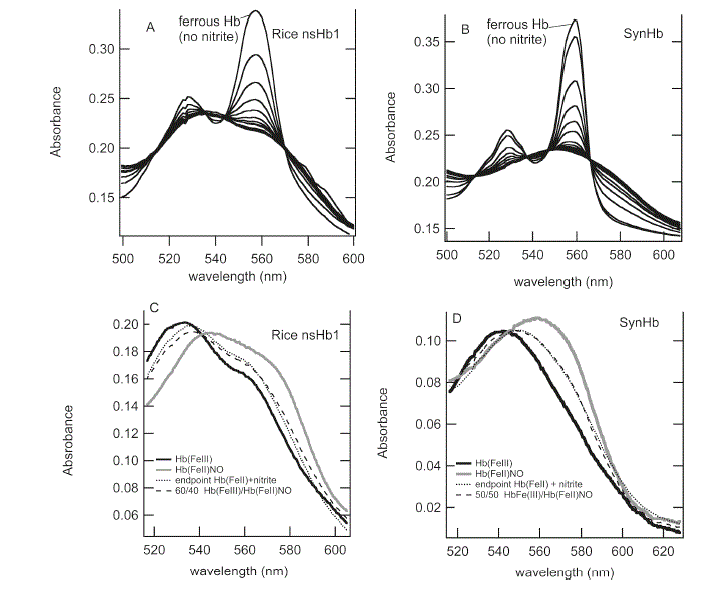
| 06:56, 7 June 2014 | Nshb1.GIF (file) |  |
36 KB | Wangjinlong | Reaction of rice nsHb1 and SynHb with nitrite. The spectral changes associated with Rice nsHb1 (A) and SynHb (B) oxidation are shown at 30 s intervals following the addition of 50 μM sodium nitrite. Panels C and D show ferric and ferrous nitrosyl (HbNO) | 1 |
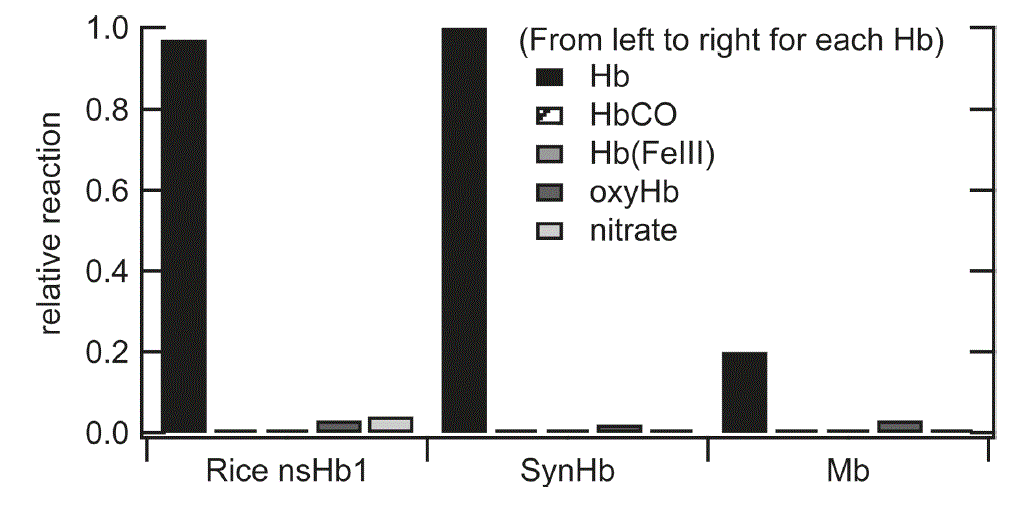
| 06:58, 7 June 2014 | Nshb1 Reactivity.GIF (file) |  |
37 KB | Wangjinlong | Reactivity of nitrite and nitrate with other forms of rice nsHb1, SynHb, and Mb. The deoxyferrous (Hb), CO (HbCO), ferric (metHb), and oxy (oxyHb) forms of each Hb were reacted with 100 μM nitrite, and the reaction progress was measured after 300 s. Each | 1 |
| 07:01, 7 June 2014 | Diversification.png (file) |  |
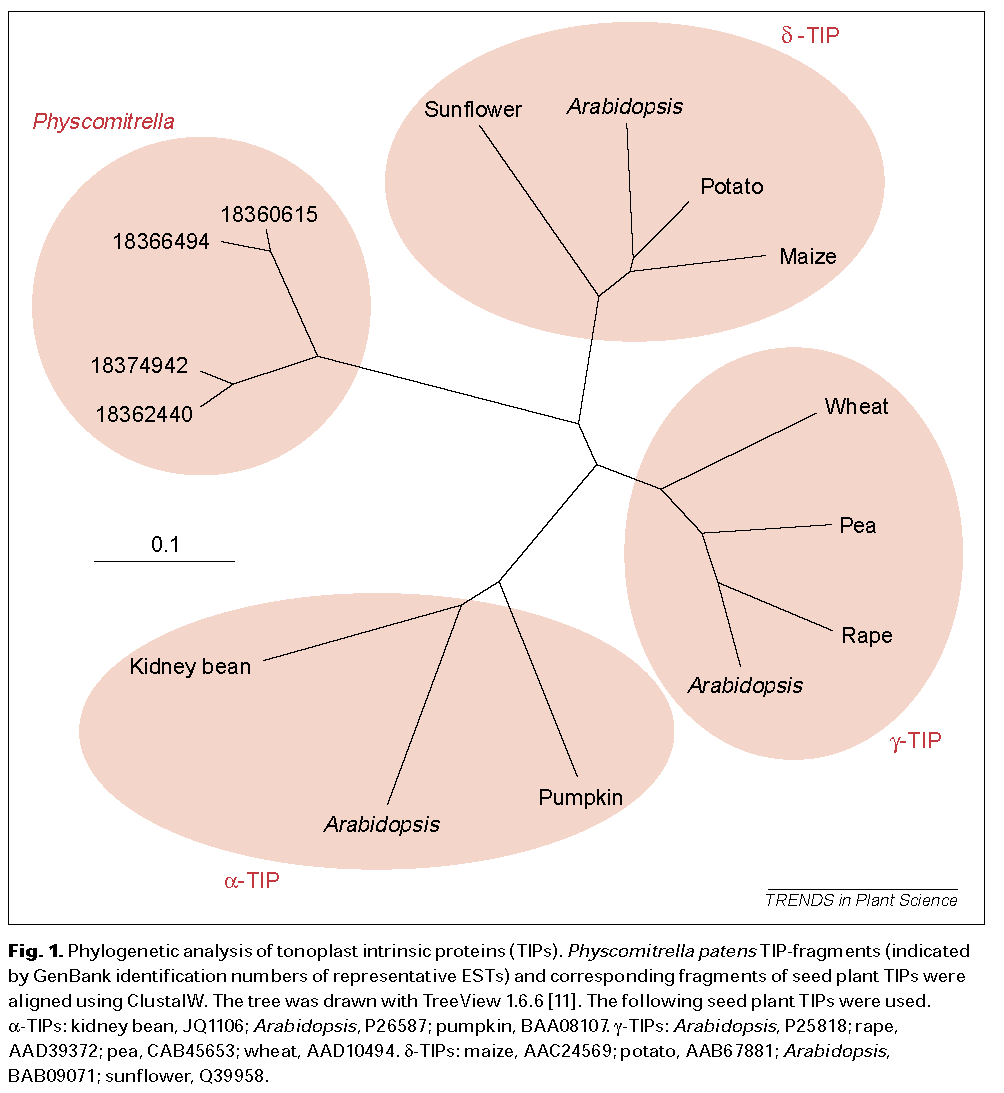
33 KB | Zhchang5 | diversification of aquaporins | 1 |
| 07:02, 7 June 2014 | Hydroxylamine reduction.GIF (file) |  |
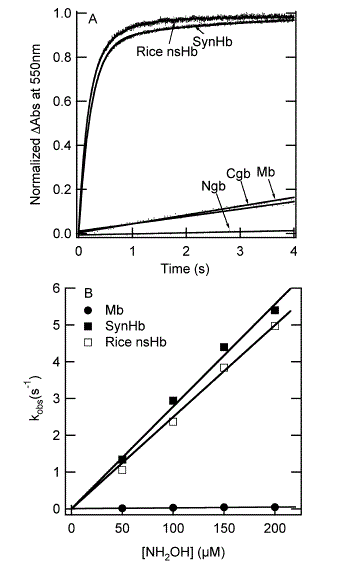
13 KB | Wangjinlong | Relative rates of hydroxylamine reduction by different Hbs. (A) Time courses for the reaction of deoxyferrous rice nsHb1, SynHb, Mb, Cgb, and Ngb with 150 μM HA, as measured by the oxidation of the Hb (as in Figure 1). (B) Dependence of the reaction rate | 1 |
| 07:04, 7 June 2014 | Reaction HA.GIF (file) |  |
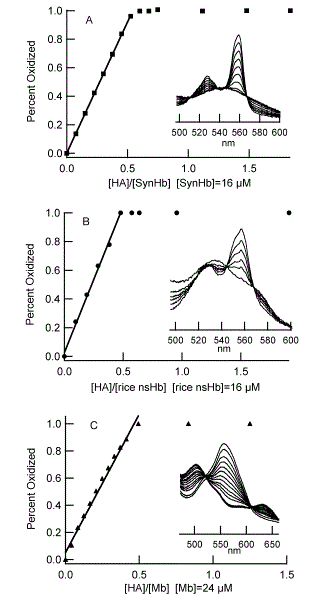
15 KB | Wangjinlong | Reaction of deoxyferrous Hbs with HA: (A) rice nsHb1 (16 μM); (B) SynHb (16 μM); (C) Mb (24 μM). All titrations exhibit sharp deviations from linearity at [HA]/[Hb] = 0.5, at which point the titration reaches 100% completion. This shows that the reacti | 1 |
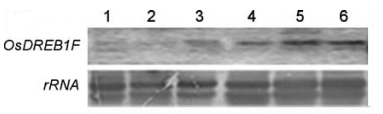
| 07:15, 7 June 2014 | OsDREB1F evolution.png (file) |  |
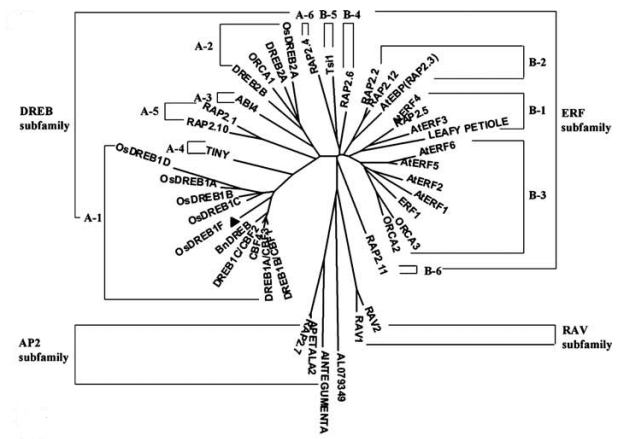
127 KB | Biolizhen | 1 | |
| 07:16, 7 June 2014 | 01.JPG (file) |  |
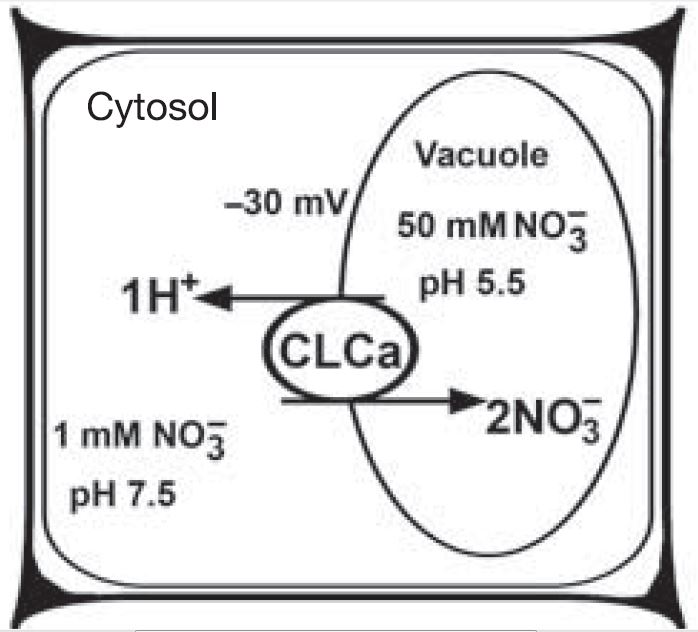
61 KB | Yangqingsong | Representation of the AtCLCaNO32/Ht antiporter in a plant cell | 1 |
| 07:17, 7 June 2014 | 02.JPG (file) |  |
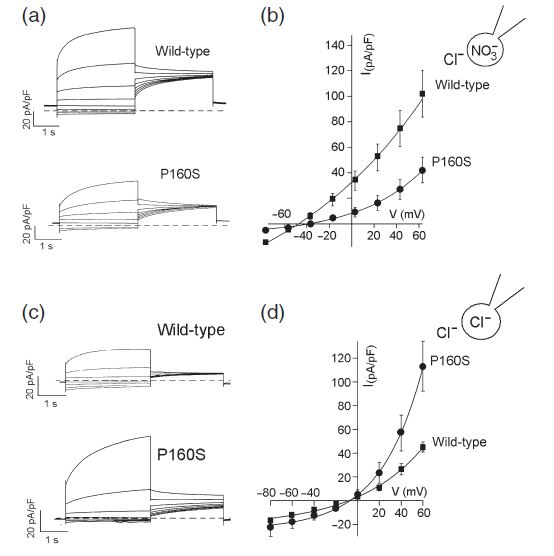
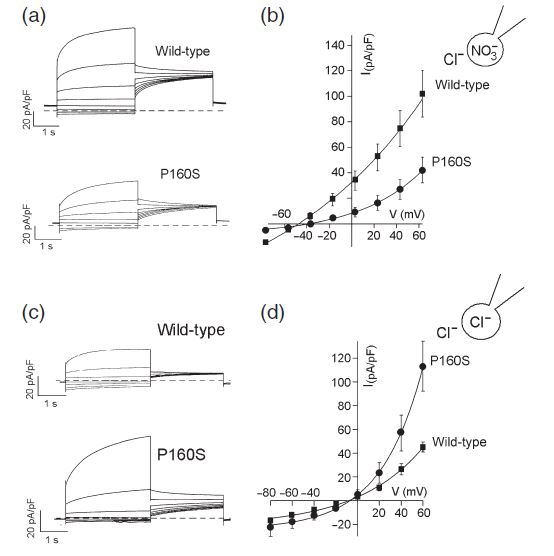
41 KB | Yangqingsong | Vacuolar chloride is transported differently by native AtCLCaWT andthe mutant AtCLCaP160S. Thus, compared with AtCLCaWT, AtCLCaP160S shows adecrease of the anion conductance directed to the vacuoleupon exchange of the cytosolic solution from Cl) to NO3 Th | 1 |
| 07:18, 7 June 2014 | 03.jpg (file) |  |
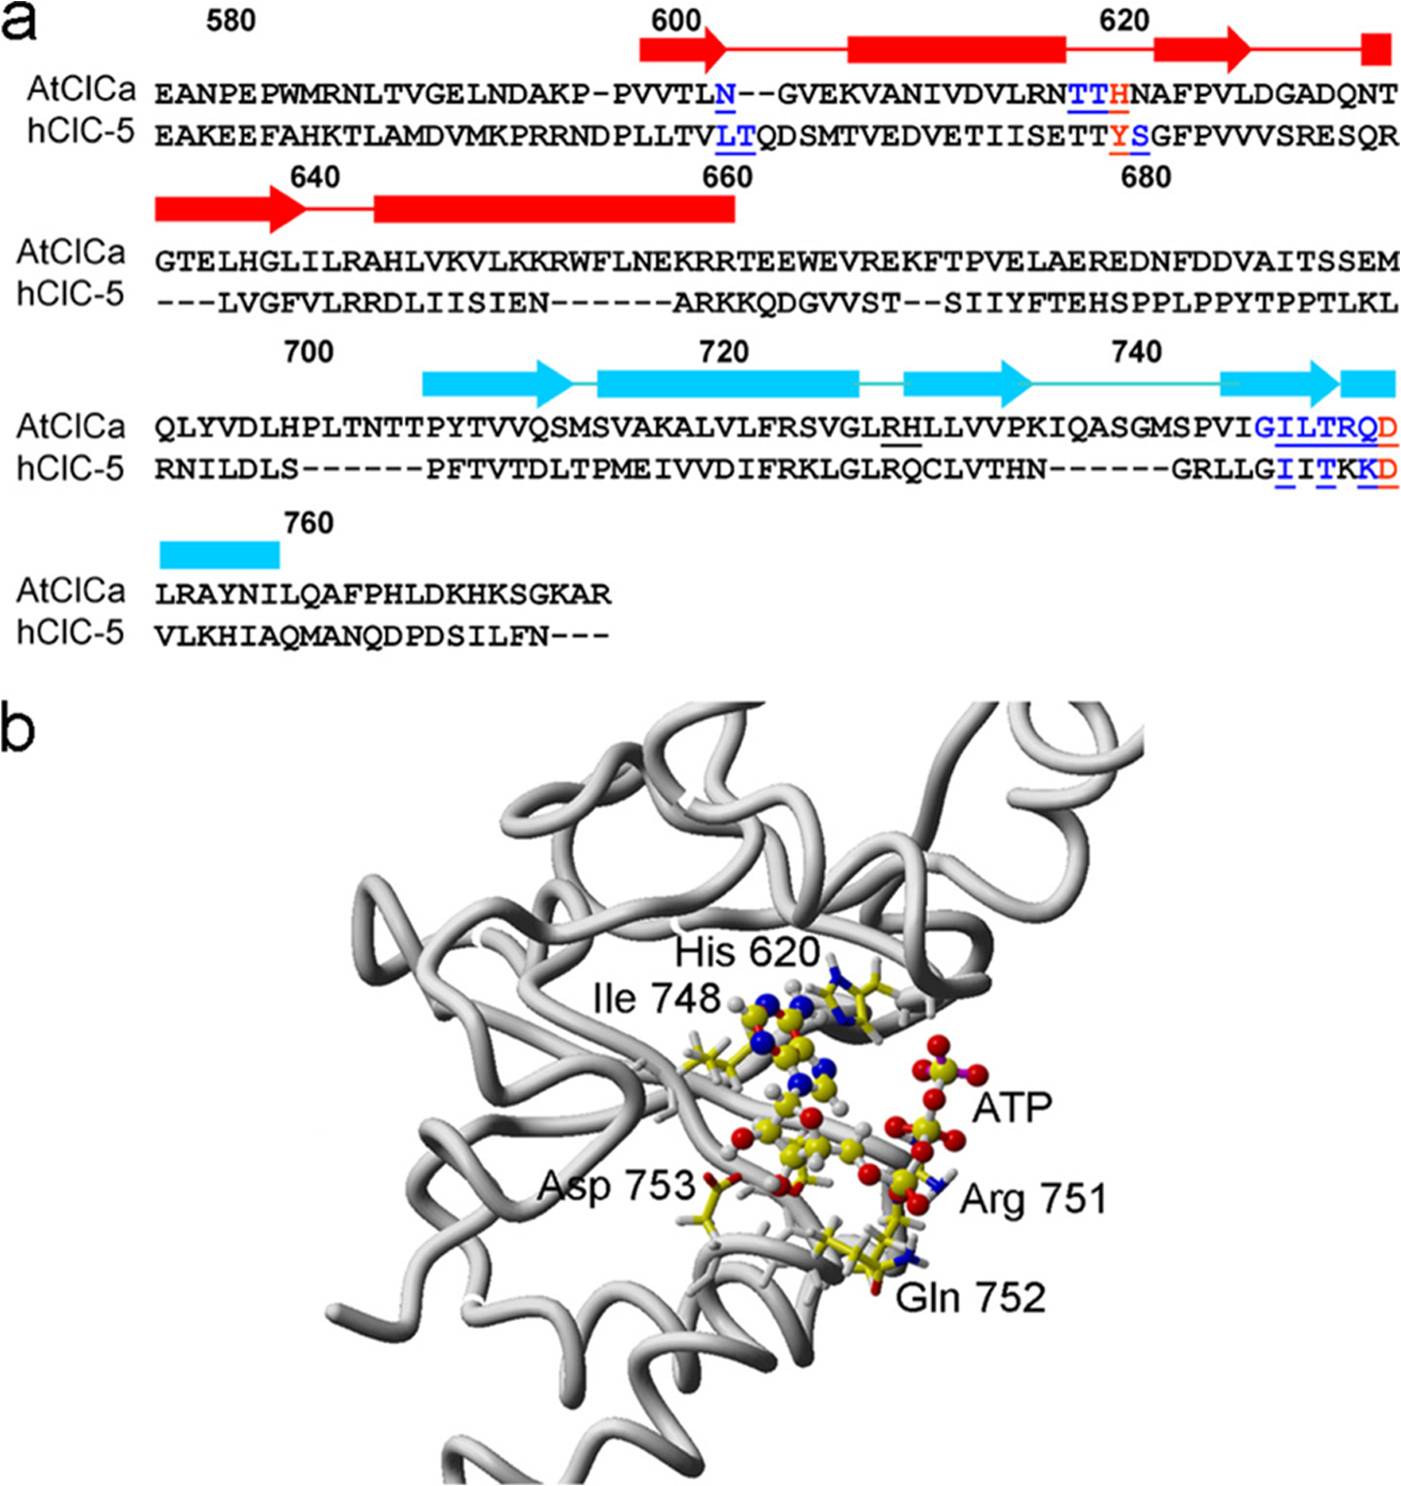
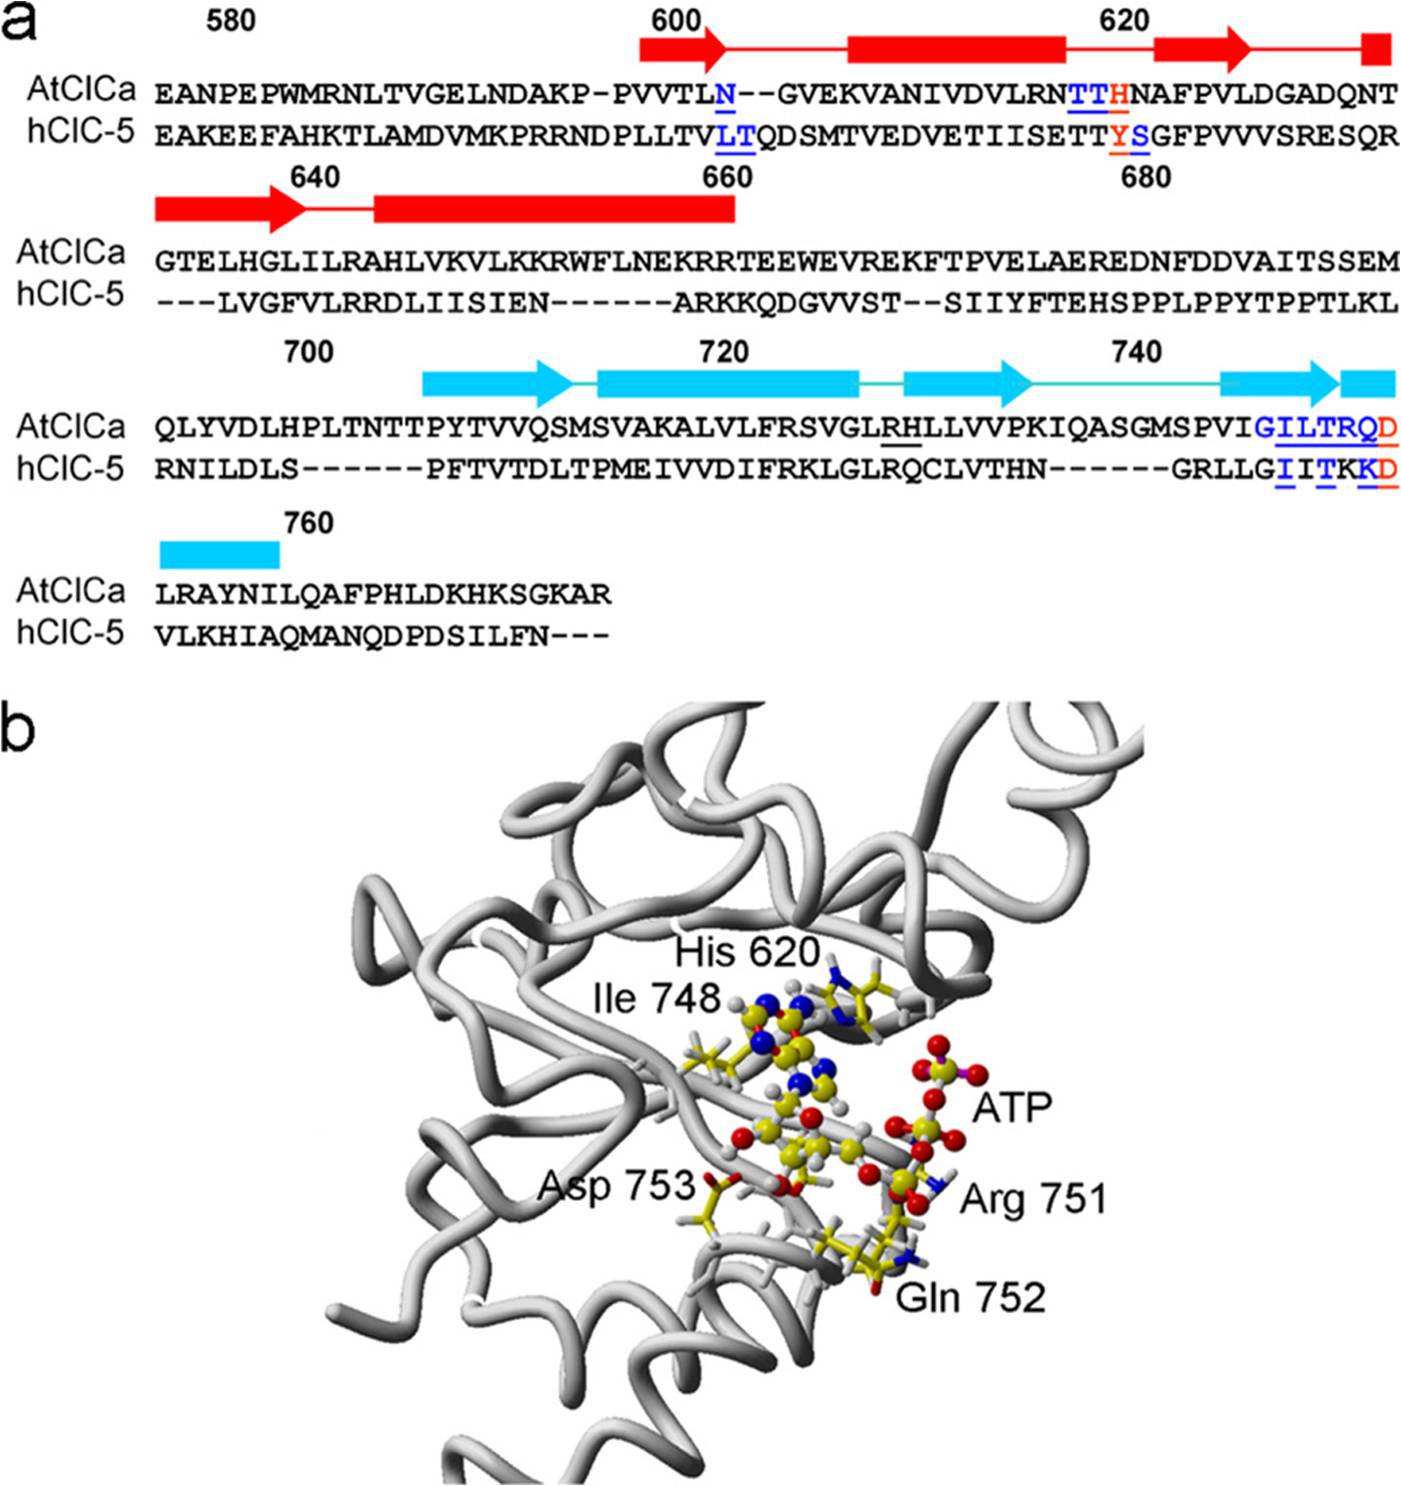
171 KB | Yangqingsong | Homology model of the AtCLCa C-terminal region. a, the alignment used for the homology modeling of AtCLCa C-terminal region on the hCLC-5 C-terminal region. b, detail of the region putatively involved in the ATP-AtCLCa interaction. | 1 |
| 07:19, 7 June 2014 | 04.JPG (file) |  |
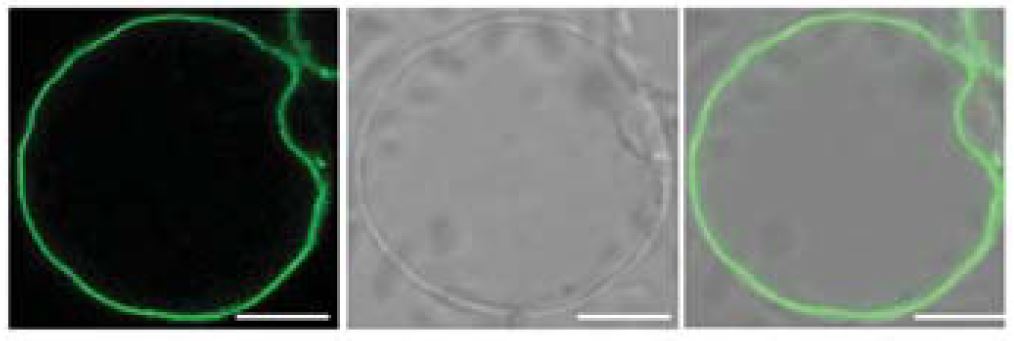
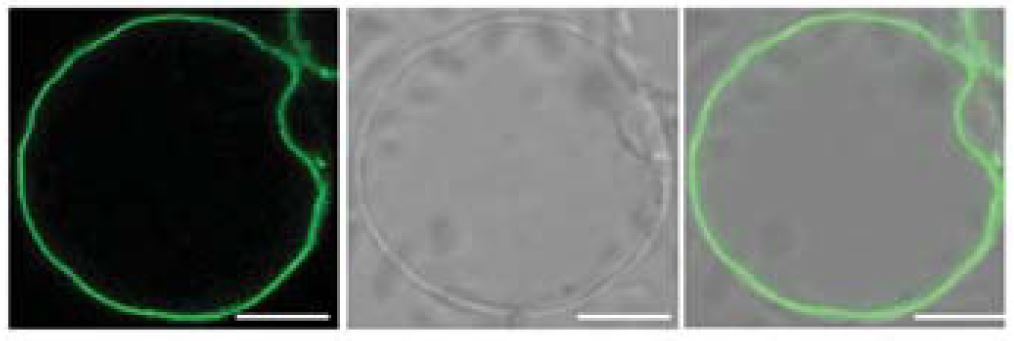
36 KB | Yangqingsong | Transient expression of AtCLCa–GFP fusion proteins in protoplasts. Laser-scanning images of GFP fluorescence (left), transmitted light (centre) and merge of both (right); scale bars correspond to 16 mm. | 1 |
| 07:19, 7 June 2014 | Result.jpg (file) |  |
142 KB | Happinessforever | 1 | |
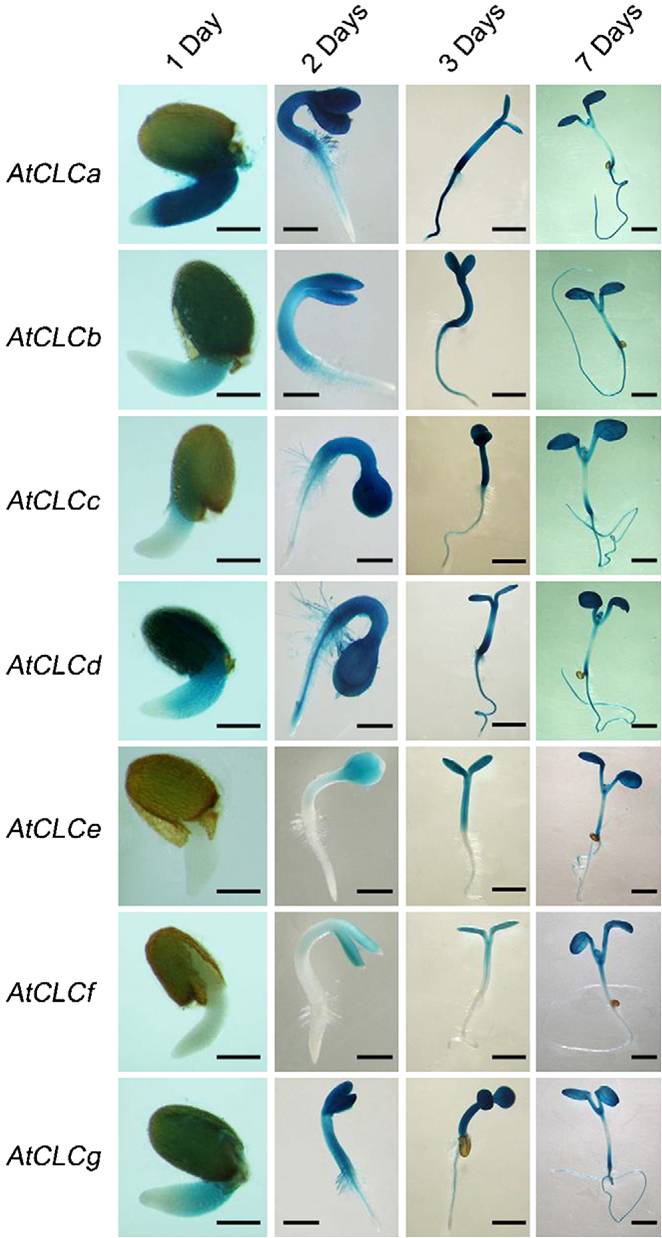
| 07:20, 7 June 2014 | 05.jpg (file) |  |
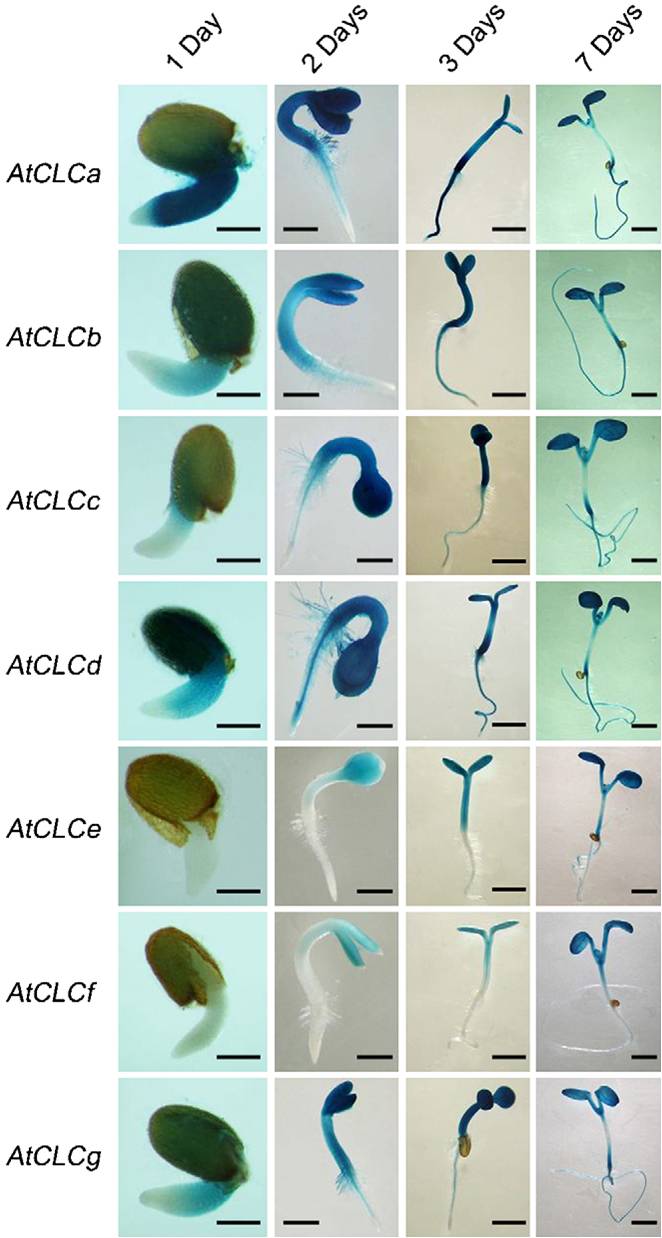
79 KB | Yangqingsong | Histochemical staining of AtCLC-Promoter::GUS activity in transgenic Arabidopsis young seedlings. From left to right: 1 day, bar = 0.25 mm; 2 days, bar = 0.5 mm; 3 days, bar = 1.0 mm; 7 days, bar = 2 mm. | 1 |
| 07:21, 7 June 2014 | 07.jpg (file) |  |
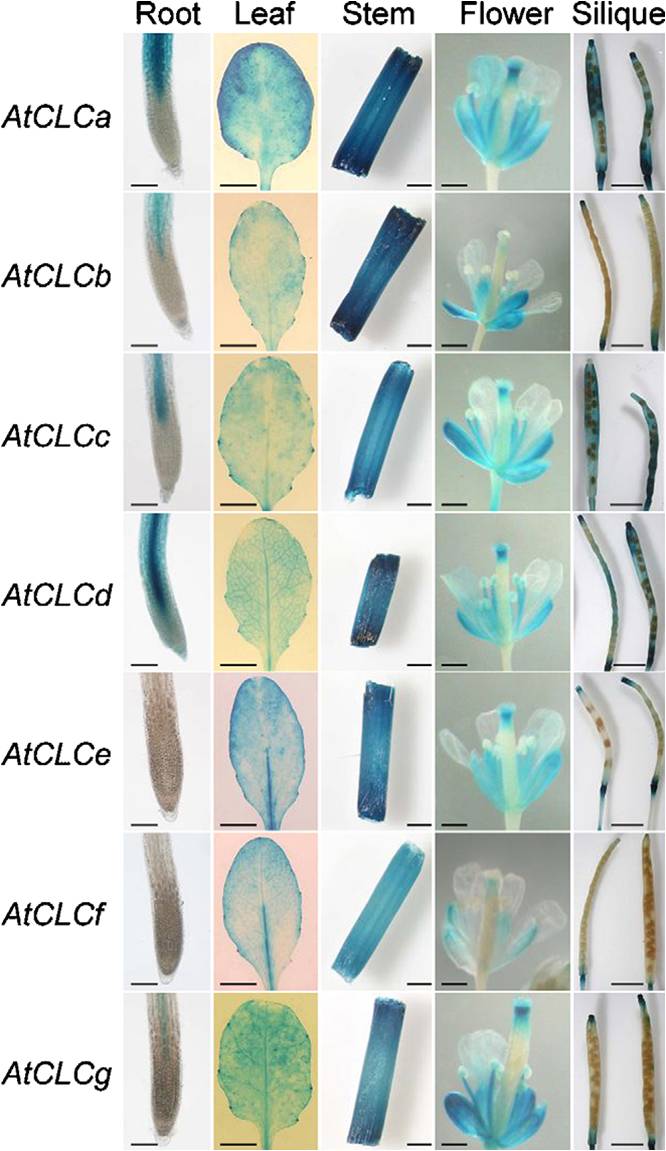
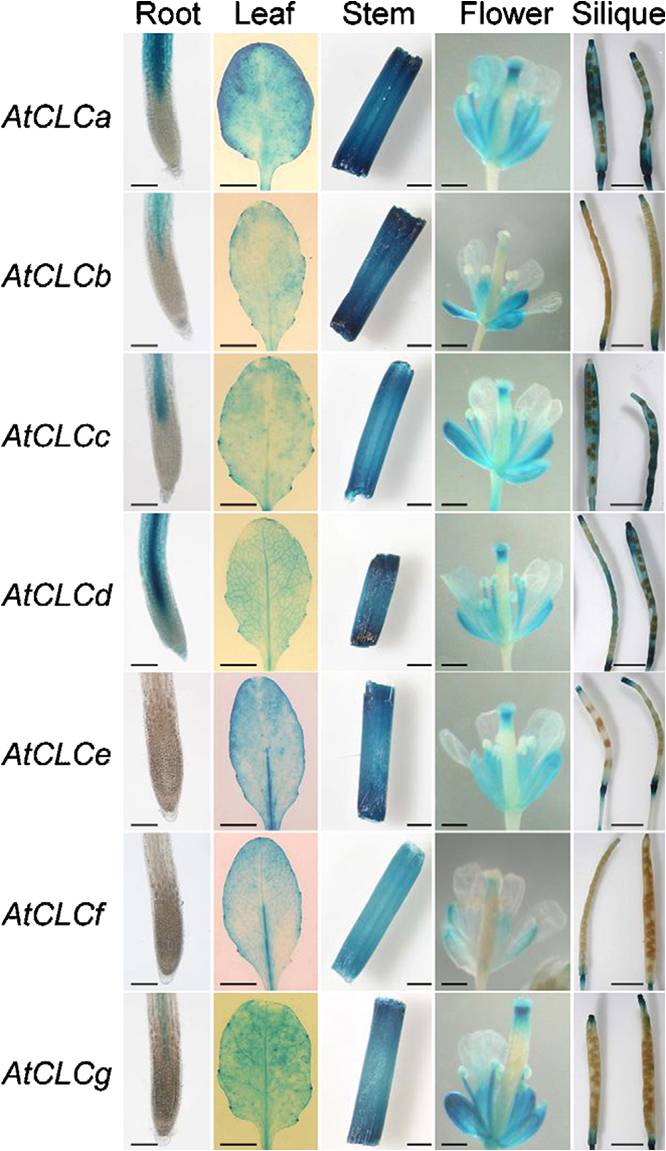
85 KB | Yangqingsong | Organ and tissue-specific expression of AtCLC members. GUS activity staining in different organs of transgenic Arabidopsis plants is shown. From left to right: root, bar = 0.05 mm; leaf, bar = 5 mm; stem, bar = 1 mm; flower, bar = 0.5 mm; silique, bar = | 1 |
| 07:21, 7 June 2014 | 08.jpg (file) |  |
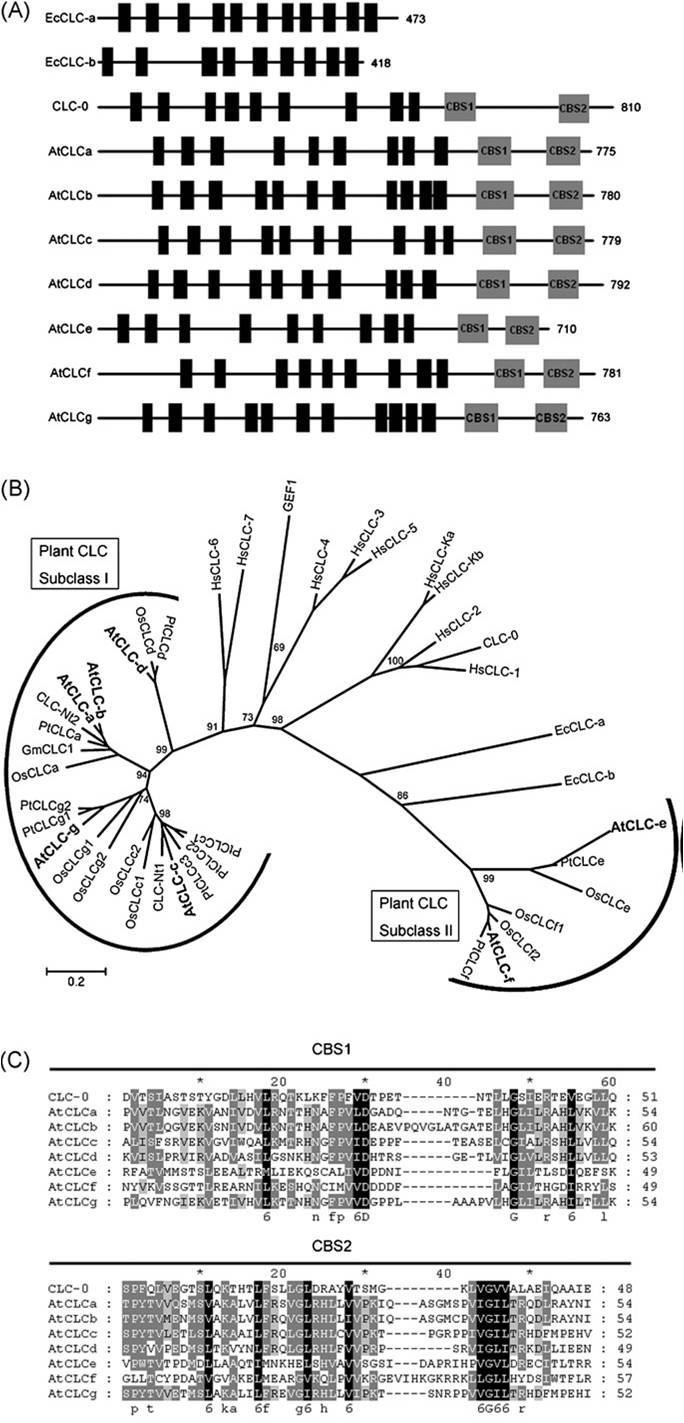
132 KB | Yangqingsong | Phylogeny of predicted AtCLC proteins. | 1 |
| 07:26, 7 June 2014 | Tissue.png (file) |  |
24 KB | Biolizhen | 1 | |
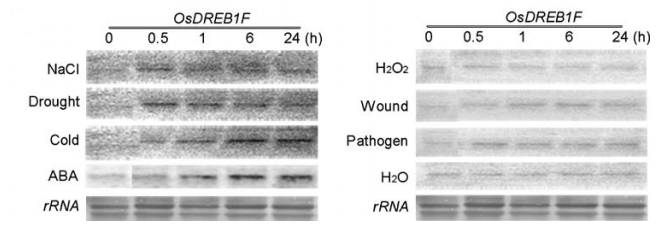
| 07:28, 7 June 2014 | Condition.png (file) |  |
100 KB | Biolizhen | 1 | |
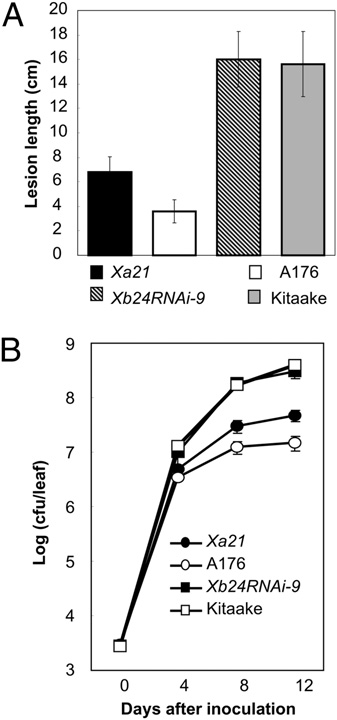
| 07:47, 7 June 2014 | Fig. 3.png (file) |  |
82 KB | Yang Yingying | Effects of reduced expression of Xb24 on Xa21-mediated resistance. (A) Quantitative lesion length measurements of rice leaves at 14 days after PXO99 inoculation. The means ± SD of each sample was calculated from 24 infected leaves of 8 plants. (B) Bacter | 1 |
| 07:48, 7 June 2014 | Histochemical staining of AtCLC-Promoter.jpg (file) |  |
79 KB | Yangqingsong | Histochemical_staining_of_AtCLC-Promoter | 1 |
| 07:48, 7 June 2014 | Homology model of the AtCLCa C-terminal region.jpg (file) |  |
171 KB | Yangqingsong | 1 | |
| 07:49, 7 June 2014 | Organ and tissue-specific expression of AtCLC members.jpg (file) |  |
85 KB | Yangqingsong | 1 | |
| 07:50, 7 June 2014 | Representation of the AtCLCaNO32Ht antiporter in a plant cell.JPG (file) |  |
61 KB | Yangqingsong | 1 | |
| 07:53, 7 June 2014 | Transient expression of AtCLCa–GFP fusion proteins in protoplasts.JPG (file) |  |
36 KB | Yangqingsong | 1 | |
| 07:53, 7 June 2014 | Vacuolar chloride is transported differently.JPG (file) |  |
41 KB | Yangqingsong | 1 | |
| 07:56, 7 June 2014 | Fig. 4.png (file) |  |
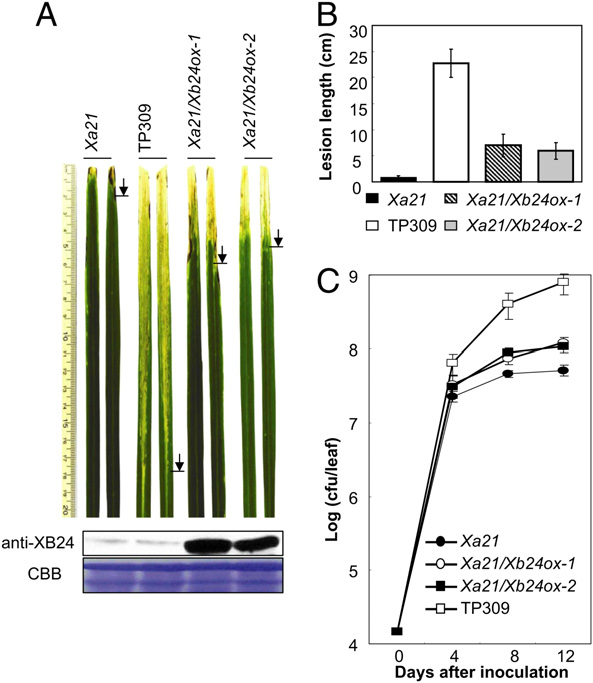
259 KB | Yang Yingying | Effects of overexpression of Xb24 on Xa21-mediated resistance. (A) Photograph of rice leaves 14 days after inoculation with PXO99 (Top). The disease lesions are indicated from the top of the leaf cuts to the arrows. The XB24 protein was detected by anti-X | 1 |
| 08:12, 7 June 2014 | OsWRKY51 express.png (file) |  |
37 KB | Happinessforever | 1 | |
| 08:39, 7 June 2014 | Fig. 5.jpg (file) |  |
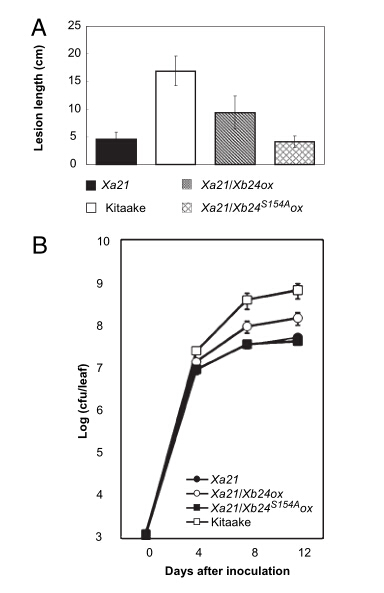
59 KB | Yang Yingying | Requirement of XB24 ATPase activity for regulation of XA21-mediated immunity. (A) Lesion lengths were measured for Xa21, Kitaake, Xa21/Xb24ox, and Xa21/Xb24S154Aox at 14 days after PXO99 inoculation. The mean and SD of each sample were determined using 32 | 1 |
| 09:54, 7 June 2014 | ABC 8.jpg (file) |  |
72 KB | Kathy | 1 | |
| 09:58, 7 June 2014 | Schematic representation of ROS1a.jpg (file) |  |
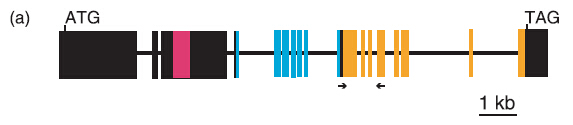
26 KB | Julie | Boxes and lines indicate exons and introns, respectively. Blue exons encode the conserved DNA glycosylase domain, and pink and orange exons encode conserved domains of unknown function. Arrows indicate the position of primers used for RT-PCR. | 1 |
| 10:09, 7 June 2014 | Tree.jpg (file) |  |
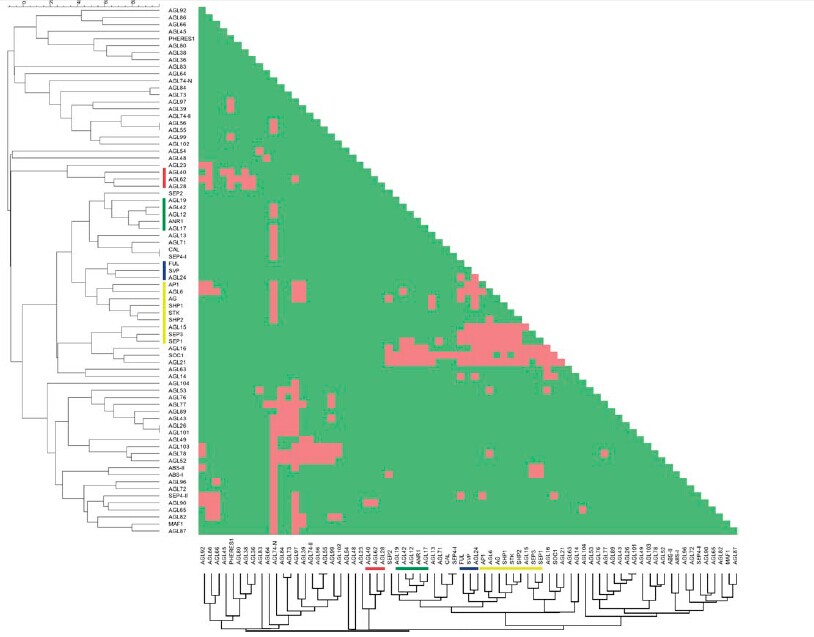
151 KB | Happinessforever | 1 | |
| 11:04, 7 June 2014 | OsGR2 Fig.1.png (file) |  |
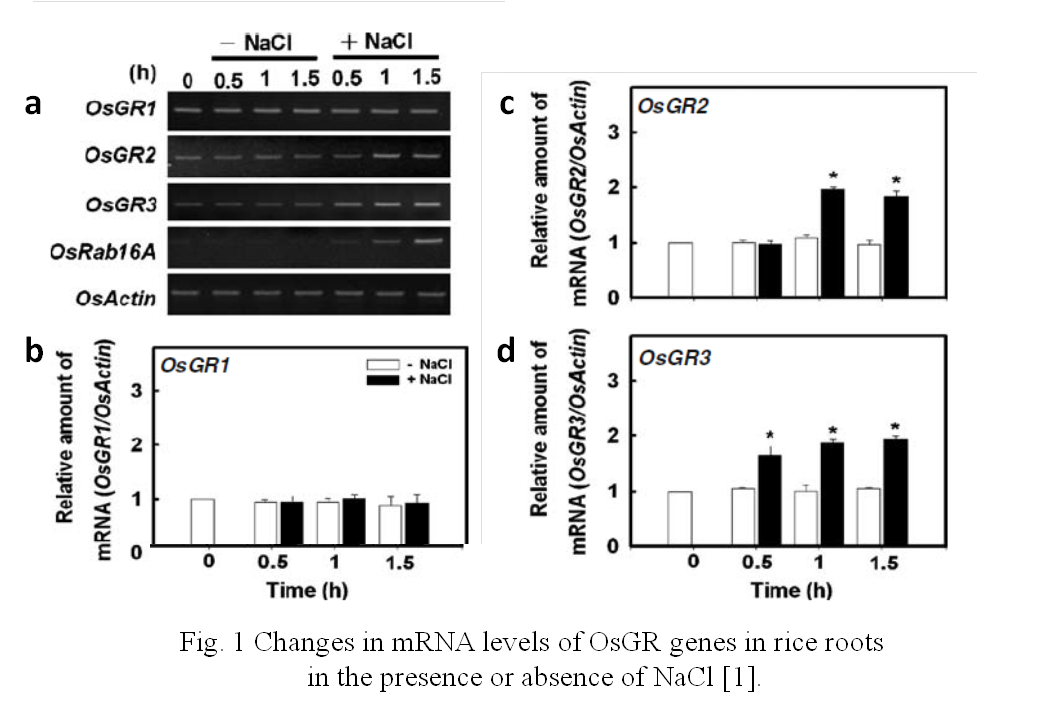
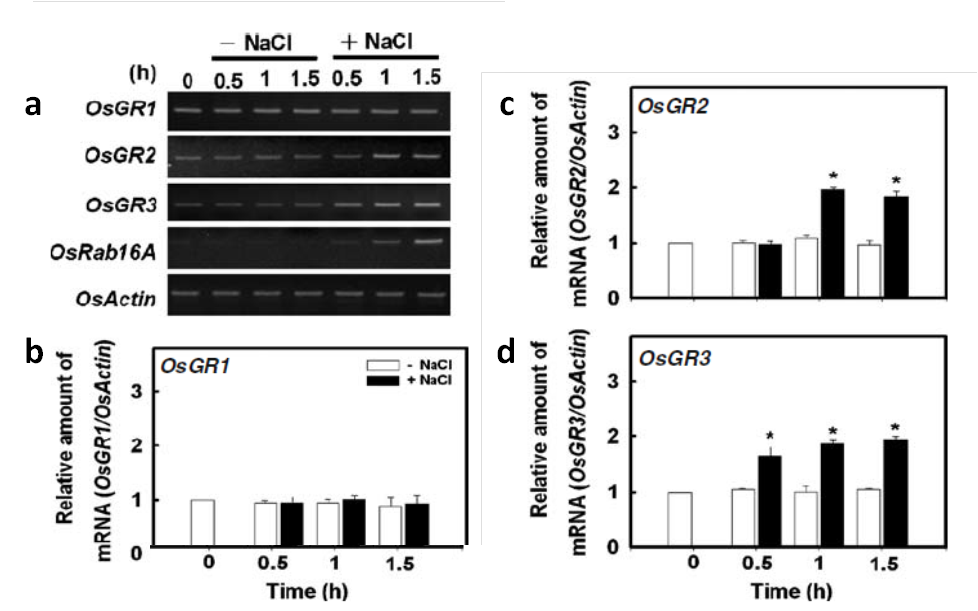
194 KB | Huangxiuting | Fig. 1 Changes in mRNA levels of OsGR genes in rice roots in the presence or absence of NaCl [1]. | 1 |
| 11:08, 7 June 2014 | ABC 9..jpg (file) |  |
41 KB | Kathy | 1 | |
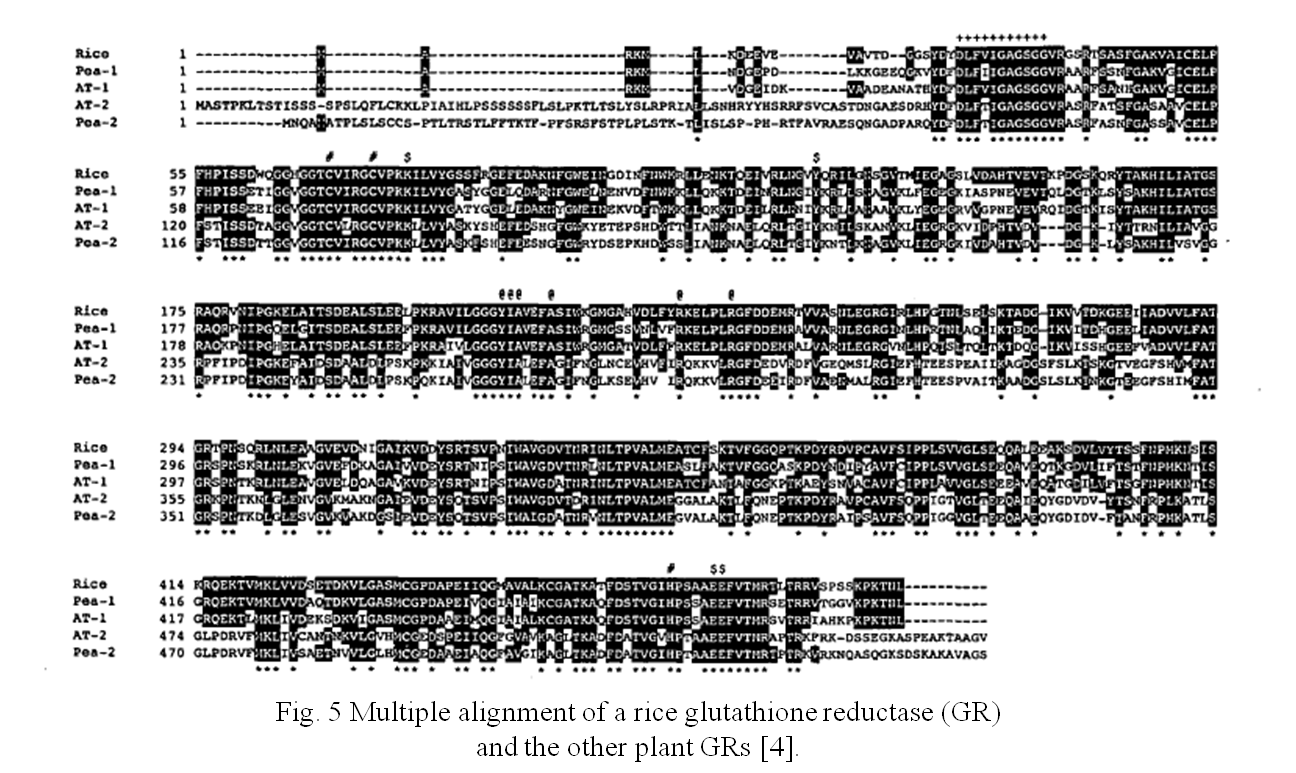
| 11:48, 7 June 2014 | OsGR2 Fig.5.png (file) |  |
501 KB | Huangxiuting | 1 | |
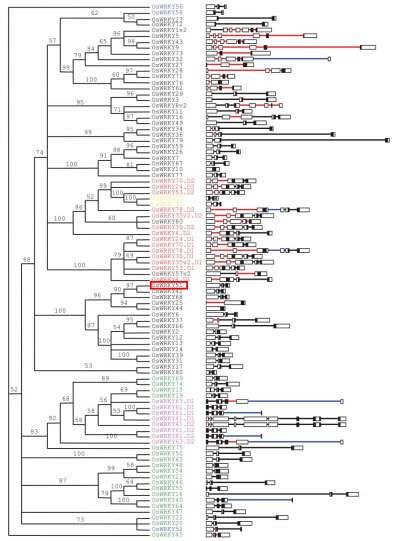
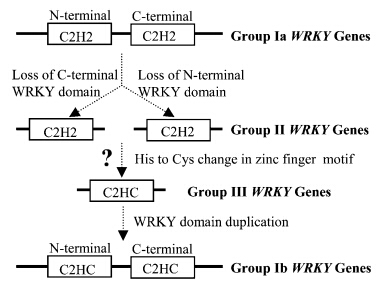
| 11:49, 7 June 2014 | OsWRKY gene family.jpg (file) |  |
57 KB | Happinessforever | 1 | |
| 11:53, 7 June 2014 | A subset of OsSERK genes, including OsBAK1, affects normal growth and leaf development of rice.pdf (file) |  |
1.05 MB | Singing | 1 | |
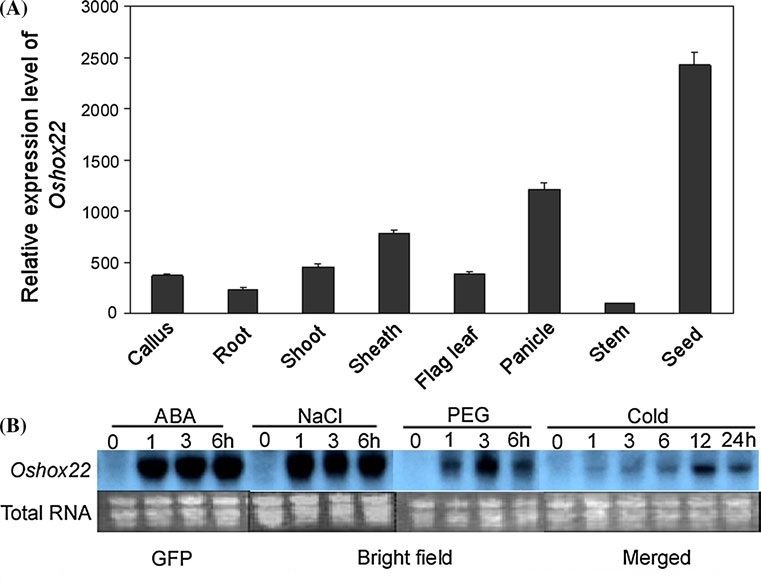
| 12:35, 7 June 2014 | Oshox22 expression.jpg (file) |  |
72 KB | Liujia | 1 | |
| 12:38, 7 June 2014 | OsGR2 Fig.3.png (file) |  |
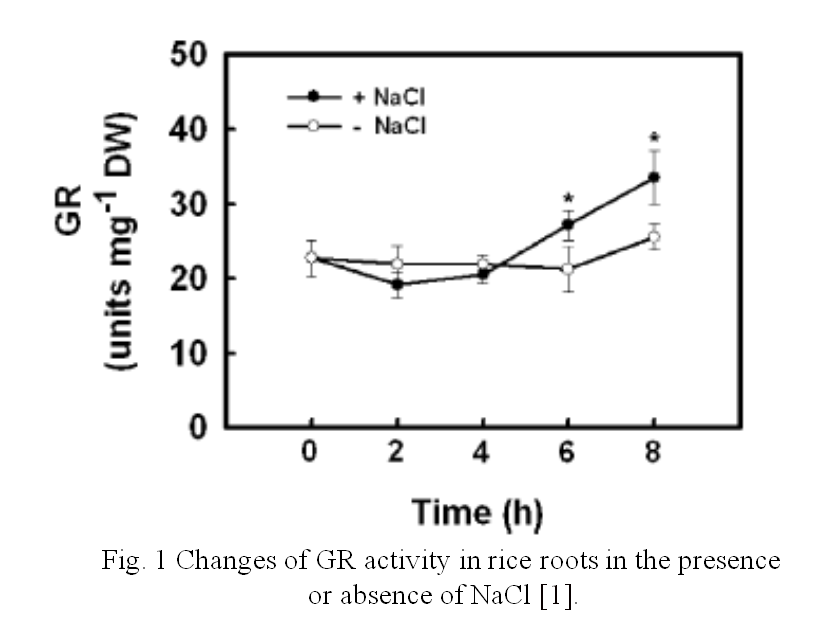
62 KB | Huangxiuting | Fig. 1 Changes of GR activity in rice roots in the presence or absence of NaCl [1]. | 1 |
| 12:43, 7 June 2014 | OsGR2 Fig.01.png (file) |  |
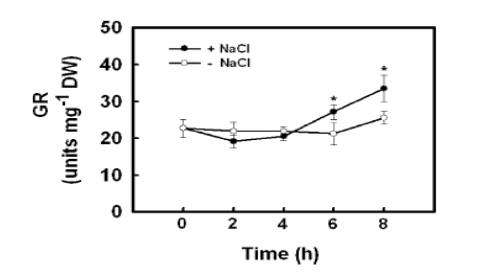
19 KB | Huangxiuting | right|thumb|300px|Fig. 1 Changes of GR activity in rice roots in the presence or absence of NaCl [1]. | 1 |
| 12:48, 7 June 2014 | OsGR2 Fig.02.png (file) |  |
184 KB | Huangxiuting | Fig. 2 Changes in mRNA levels of OsGR genes in rice roots in the presence or absence of NaCl [1]. | 1 |
| 12:51, 7 June 2014 | OsGR2 Fig.03.png (file) |  |
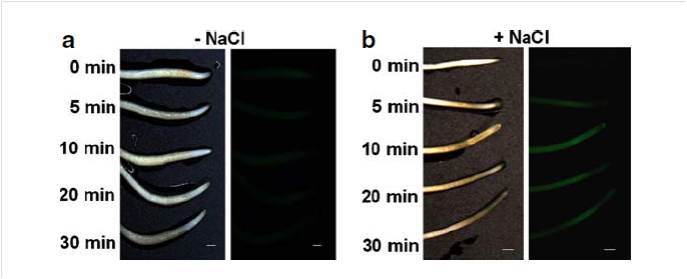
148 KB | Huangxiuting | Fig. 3 Changes in H2O2 production in rice roots treated with or without NaCl [1]. | 1 |
| 12:55, 7 June 2014 | OsGR2 Fig.04.png (file) |  |
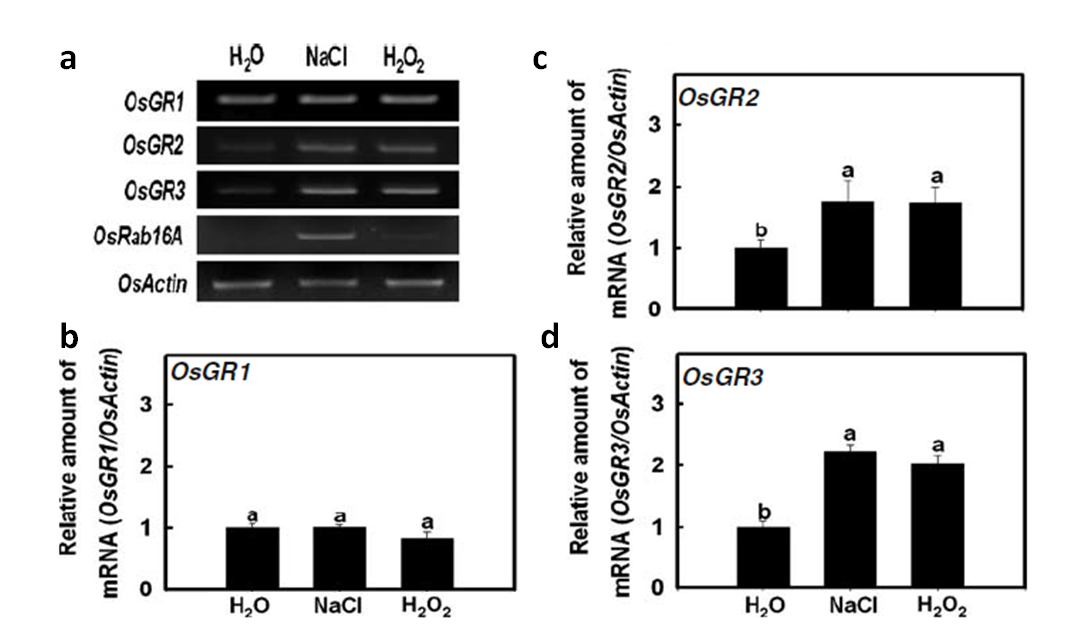
172 KB | Huangxiuting | Fig. 4 Effect of NaCl and H2O2 on mRNA levels for OsGR in roots of rice seedlings [1]. | 1 |