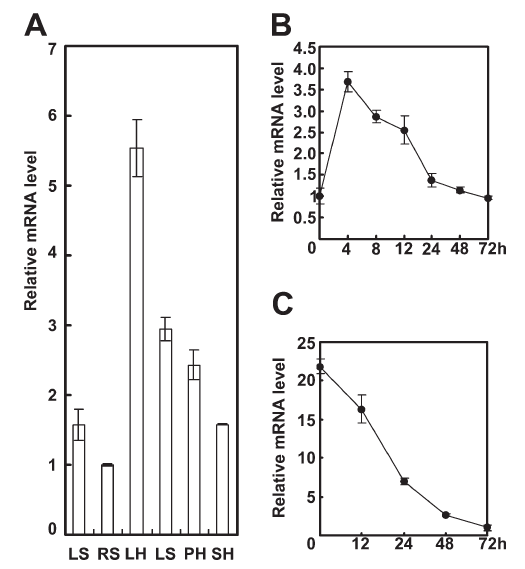
File list
This special page shows all uploaded files.
| Date | Name | Thumbnail | Size | User | Description | Versions |
|---|---|---|---|---|---|---|
| 12:30, 8 June 2014 | Comparison.jpg (file) |  |
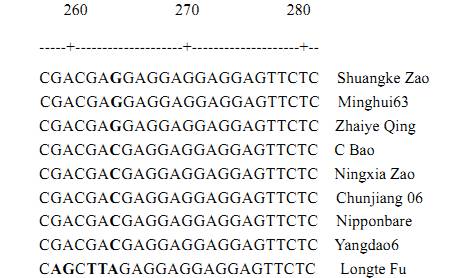
31 KB | Liangliangbig | Comparison between the conserved DNA fragments of ALK in 9 rice varieties. The different nucleotides are shown inbold. Numbers above the plus sign indicate the nucleotide position fromATG in ALK of Shuangke Zao. | 1 |
| 12:31, 8 June 2014 | Relationship.jpg (file) |  |
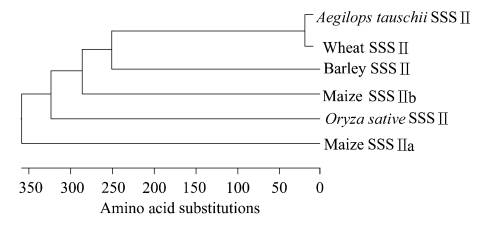
13 KB | Liangliangbig | Relationships between the primary amino acid sequences of SSSII in several plant species. The dendrogram was generated by the program CLUSTAL W. Accession numbers of source sequences are AY133248 for A. tauschii, AF155217 for wheat, AY133250 for barley, A | 1 |
| 12:33, 8 June 2014 | ExpressionRT.jpg (file) |  |
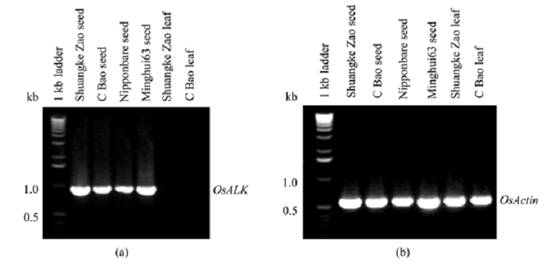
13 KB | Liangliangbig | (a) Transcriptional levels of predicted ALK in different tissues of several rice varieties. (b) Transcriptional levels of Actin in different tissues of several rice varieties. | 1 |
| 12:37, 8 June 2014 | Location of alk.jpg (file) |  |
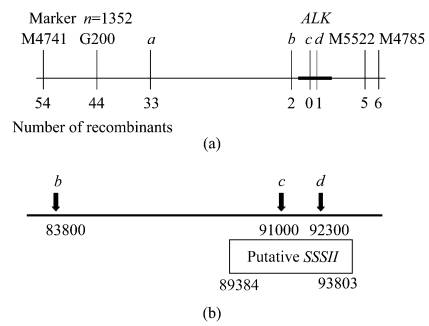
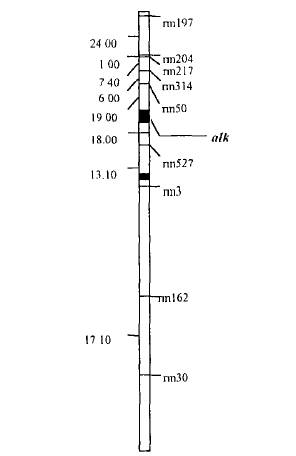
13 KB | Liangliangbig | Genetic (a) and physical map (b) of ALK. All molecular markers are located on short arm of rice chromosome 6. (a) Letters and numbers above the vertical lines represent molecular markers and numbers below the vertical line represent the recombinants in a | 1 |
| 12:51, 8 June 2014 | Map location.jpg (file) |  |
9 KB | Liangliangbig | genetic map of chromosome6 | 1 |
| 12:53, 8 June 2014 | 7.jpg (file) |  |
86 KB | Jieomlong | 3 | |
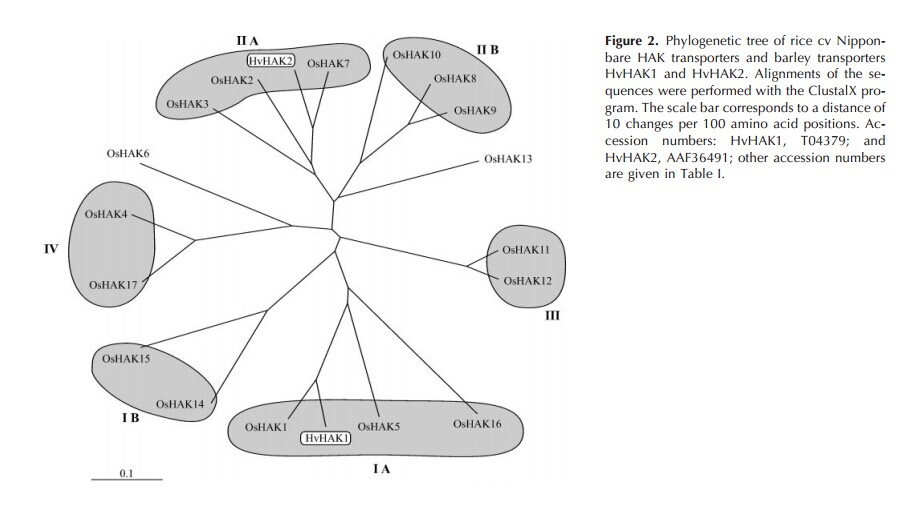
| 13:11, 8 June 2014 | Figure 1.. Phylogenetic analysis of the XB3 family .png (file) |  |
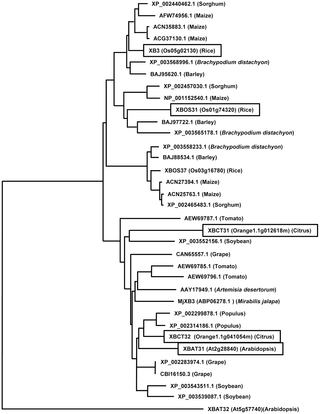
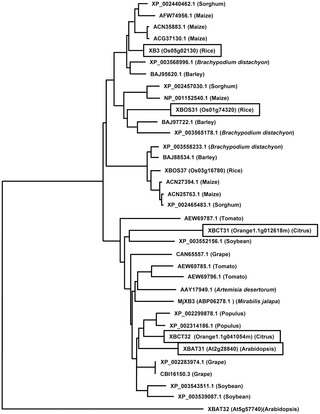
33 KB | Xwjessica | The phylogenetic tree was generated by the neighbor-joining method. Accession numbers for the sequences are indicated. The functionally characterized XB3 family members in this study are boxed. | 1 |
| 13:11, 8 June 2014 | Wjt1.jpg (file) |  |
40 KB | Jingtaowu | 1 | |
| 13:12, 8 June 2014 | Ma1.jpg (file) |  |
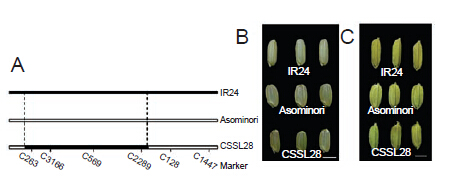
67 KB | Mafeifei | Figure 1 qGW5 controls grain width and weight in CSSL28. (A) Genotype of the narrow grain line, CSSL28 (a segment substitution between the RFLP markers C263 and R2289 on chromosome 5). The black bar indicates the fragment from IR24 in the Asominori genomi | 1 |
| 13:13, 8 June 2014 | Figure 1. Phylogenetic analysis of the XB3 family.png (file) |  |
33 KB | Xwjessica | 2 | |
| 13:14, 8 June 2014 | Wjt2.jpg (file) |  |
26 KB | Jingtaowu | 1 | |
| 13:14, 8 June 2014 | Wjt3.jpg (file) |  |
18 KB | Jingtaowu | 1 | |
| 13:14, 8 June 2014 | Wjt4.jpg (file) |  |
58 KB | Jingtaowu | 1 | |
| 13:15, 8 June 2014 | Wjt5.jpg (file) |  |
22 KB | Jingtaowu | 1 | |
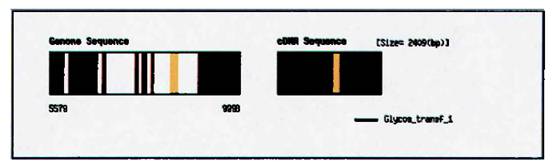
| 13:16, 8 June 2014 | CDNA of alk.jpg (file) |  |
11 KB | Liangliangbig | Demonstration of genome sequence and cDNA sequence of alk | 1 |
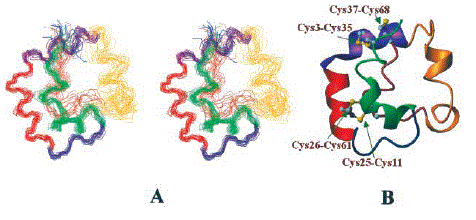
| 13:44, 8 June 2014 | Figure A and B.gif (file) |  |
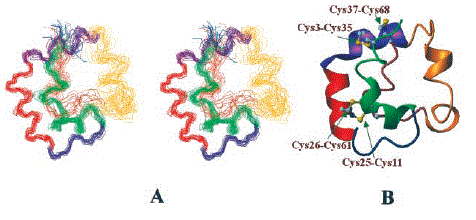
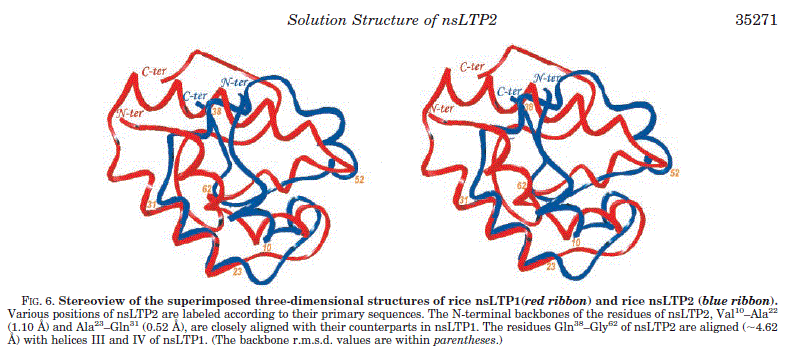
27 KB | Gylu | FIG A, stereo representation of the 15 best superimposed NMR structures of rice nsLTP2 (only the backbone atoms are shown for clarity). B, solution structure of rice nsLTP2. Disulfide bonds involved in the three-dimensional structure are shown in ball-and | 1 |
| 13:47, 8 June 2014 | Ma2.jpg (file) |  |
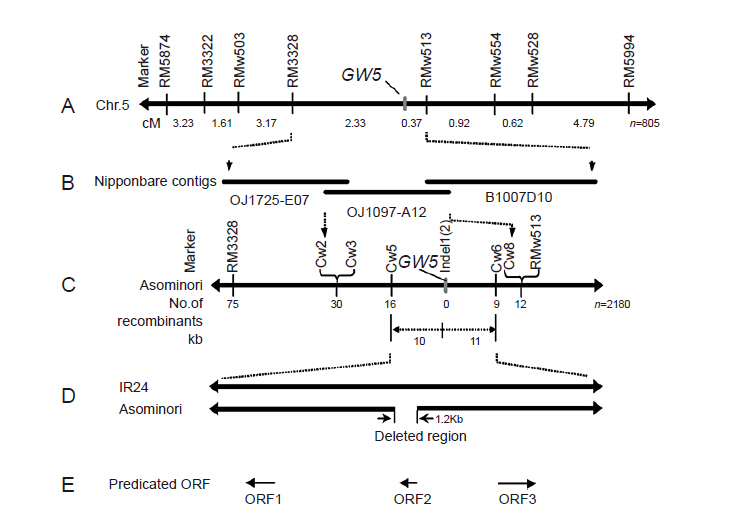
195 KB | Mafeifei | Figure 2 Fine mapping of GW5. This map was constructed on the basis of publicly available rice sequences. The CAPS and Indel markers developed in this work are indicated. (A) GW5 was mapped to a region between markers RM3328 and RMW513 in 805 recessive in | 1 |
| 13:49, 8 June 2014 | Ma3.jpg (file) |  |
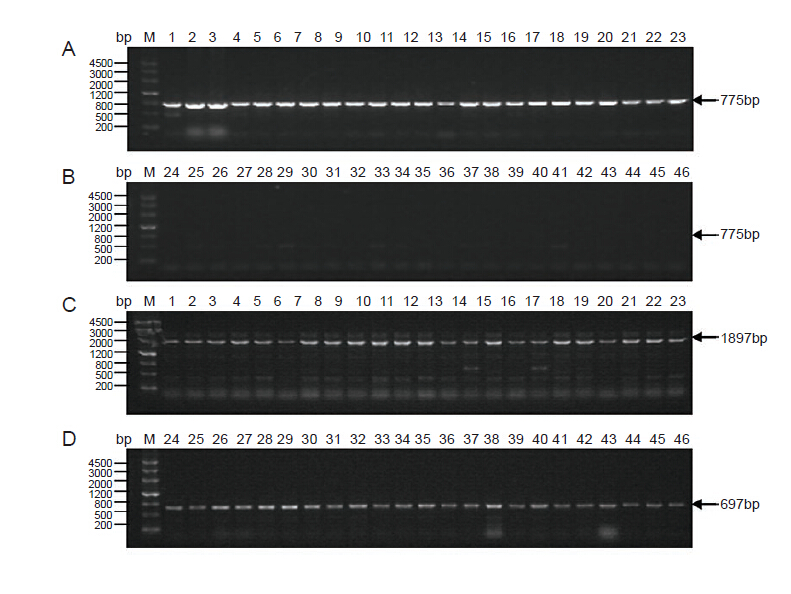
347 KB | Mafeifei | Figure 3 Genotyping analyses in 46 rice cultivars. (A) PCR products of the Indel1 marker in 23 narrow-grain rice lines; (B) PCR products of the Indel1 marker in 23 wide-grain rice varieties; (C) PCR products of the Indel2 marker in 23 narrow-grain rice li | 1 |
| 13:50, 8 June 2014 | 110.gif (file) |  |
27 KB | Gylu | 1 | |
| 13:50, 8 June 2014 | Ma4.jpg (file) |  |
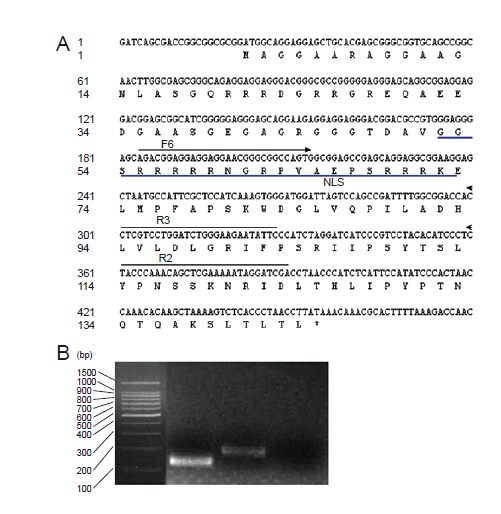
187 KB | Mafeifei | Figure 4 GW5 expression analyses. (A) The sequence of the predicted ORF2. The primers (F6, R2 and R3) used for RT-PCR analysis and the predicted NLS are denoted by arrows and a line, respectively. In addition, amino-acid residues 20-71 formed an arginine- | 1 |
| 13:52, 8 June 2014 | Ma5.jpg (file) |  |
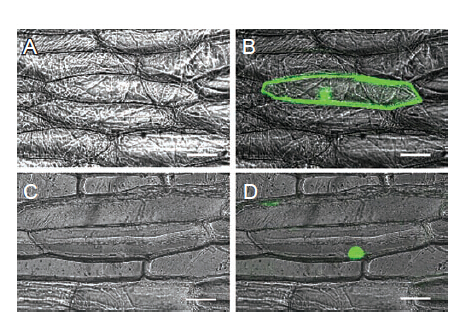
222 KB | Mafeifei | Figure 5 Sub-cellular localization of GW5. (A) and (C) Bright field images of onion epidermal cells. (B) GFP by itself (pCAMBIA 1302 vector) localizes to both cytoplasm and nucleus. (D) GW5-GFP fusion protein is localized only to the nucleus. Scale bars:5 | 1 |
| 13:55, 8 June 2014 | Ma6.jpg (file) |  |
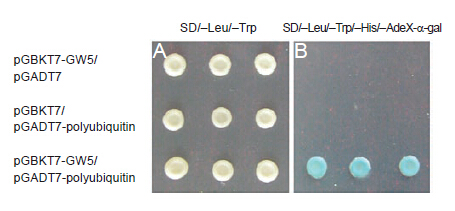
102 KB | Mafeifei | Figure 6 GW5 interacts with polyubiquitin in yeast two-hybrid assay. (A) AH109 yeast cells expressing pGBKT7-GW5/pGADT7(top), pGBKT7/pGADT7-polyubiquitin (middle) and pGBKT7-GW5/pGADT7-polyubiquitin (bottom) were selected on synthetic growth medium withou | 1 |
| 13:57, 8 June 2014 | Ma201.jpg (file) |  |
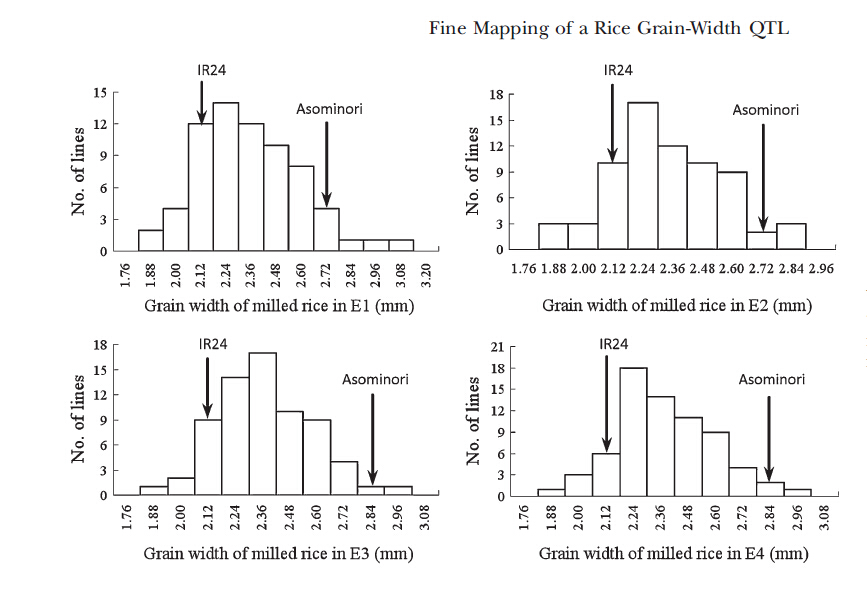
179 KB | Mafeifei | Figure 1.—Phenotypic distributions of rice grain width in the Asominori/IR24 recombinant inbred lines in four environments (E1–E4). | 1 |
| 13:59, 8 June 2014 | Ma202.jpg (file) |  |
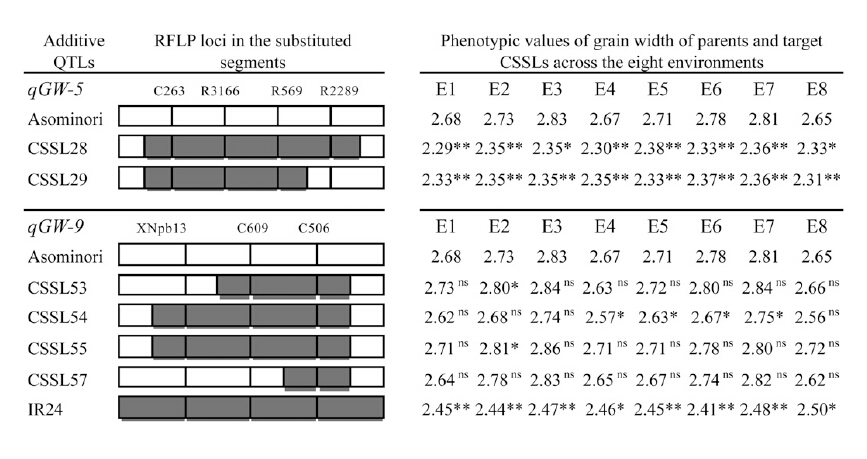
198 KB | Mafeifei | Figure 2.—Grain width of the milled rice in Asominori and target CSSLs carrying qGW-5 or qGW-9 alleles in eight environments (E1–E8). * and ** indicate significance levels of 5 and 1%, respectively; ns, nonsignificant difference. The open and shaded b | 1 |
| 14:00, 8 June 2014 | Ma203.jpg (file) |  |
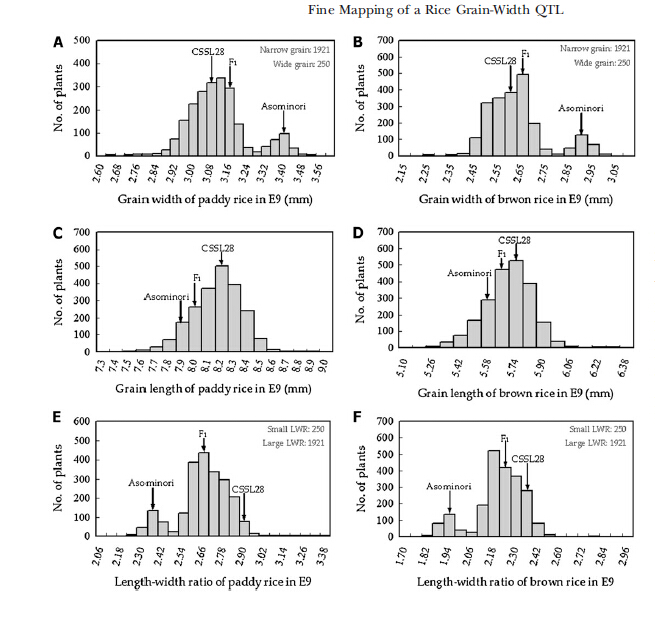
189 KB | Mafeifei | Figure 3.—Frequency distributions of grain width, grain length, and length–width ratio in the CSSL28/Asominori BC4F2 population (2171 individuals) in E9. (A) Grain width of paddy rice; (B) grain width of brown rice; (C) grain length of paddy rice; (D) | 1 |
| 14:02, 8 June 2014 | Ma204.jpg (file) |  |
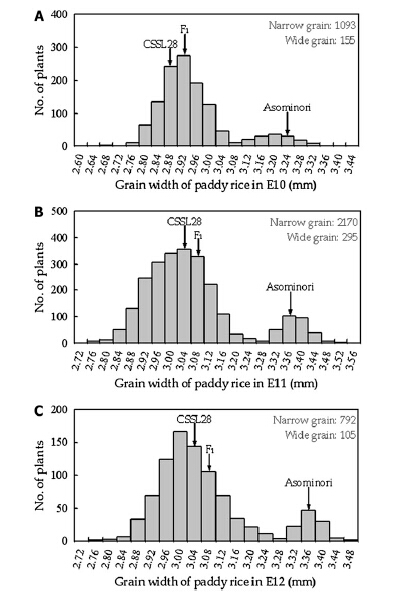
112 KB | Mafeifei | Figure 4.—Frequency distributions of grain width of paddy rice in the CSSL28/Asominori F2 populations grown in E10, E11, and E12. (A) Grain width of paddy rice in E10 (1248 individuals); (B) grain width of paddy rice in E11 (2465 individuals); (C) grain | 1 |
| 14:04, 8 June 2014 | Figure 1xxy.png (file) |  |
106 KB | Xiaoyanjie2012 | 1 | |
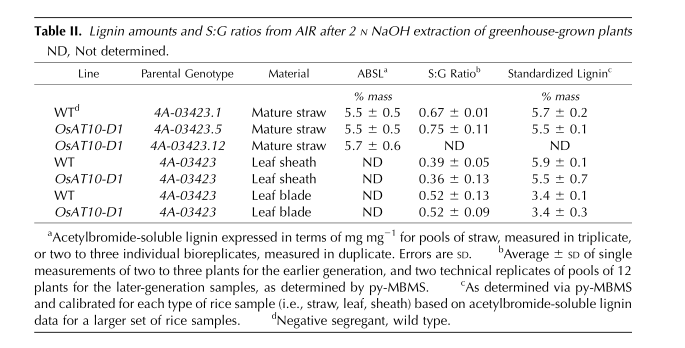
| 14:05, 8 June 2014 | Table 1xxy.png (file) |  |
76 KB | Xiaoyanjie2012 | 1 | |
| 14:05, 8 June 2014 | Ma205.jpg (file) |  |
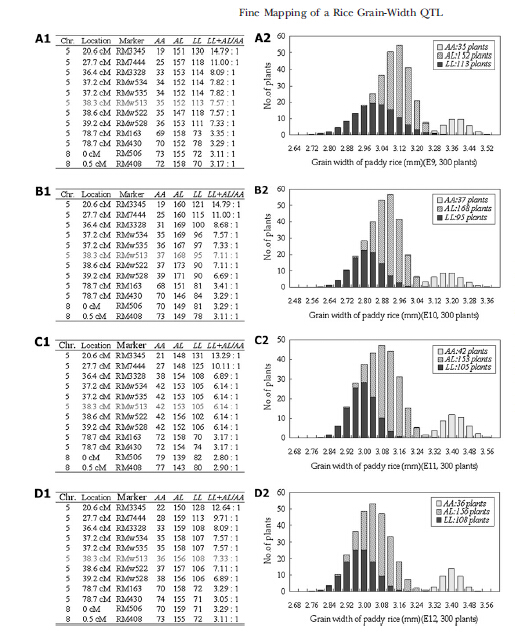
218 KB | Mafeifei | Figure 5.—The ratios of three genotypes of SSR markers and frequency distributions of grain width in 300 BC4F2 individuals across four environments (E9–E12). A1–D1 represent the ratios of three genotypes of 12 SSR markers in E9–E12, respectively; | 1 |
| 14:09, 8 June 2014 | Figure 2xxy.png (file) |  |
130 KB | Xiaoyanjie2012 | 1 | |
| 14:09, 8 June 2014 | Ma206.jpg (file) |  |
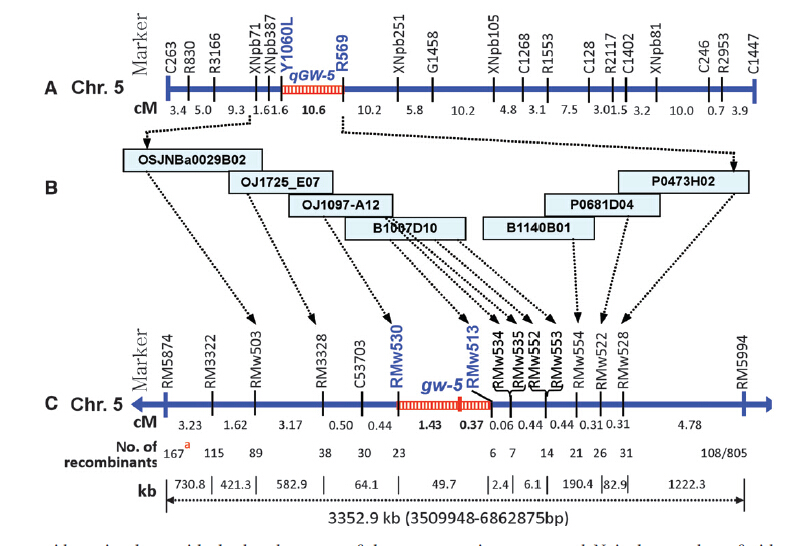
290 KB | Mafeifei | Figure 6.—Genetic and physical maps of the gw-5 gene on rice chromosome 5. (A) QTL mapping of the qGW-5 locus. (B) Six BAC/PAC contigs around the gw-5 locus. (C) Fine mapping of gw-5 using newly developed SSR markers. The red superscript a indicates tha | 1 |
| 14:10, 8 June 2014 | Ma207.jpg (file) |  |
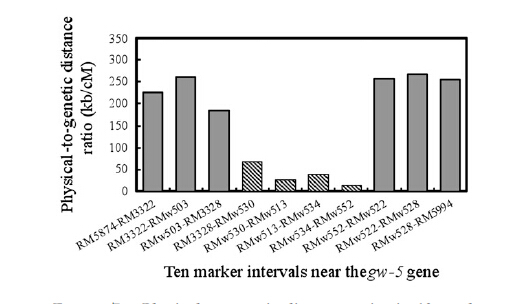
62 KB | Mafeifei | Figure 7.—Physical-to-genetic distance ratios in 10 marker intervals near the GW5 gene. | 1 |
| 14:12, 8 June 2014 | Figure 3xxy.png (file) |  |
128 KB | Xiaoyanjie2012 | 1 | |
| 14:12, 8 June 2014 | Figure 2.gif (file) |  |
52 KB | Gylu | 8 | |
| 14:12, 8 June 2014 | Figure 4xxy.png (file) |  |
127 KB | Xiaoyanjie2012 | 1 | |
| 14:17, 8 June 2014 | Figure 9xxy.png (file) |  |
74 KB | Xiaoyanjie2012 | 1 | |
| 14:26, 8 June 2014 | Table 2xxy.png (file) |  |
91 KB | Xiaoyanjie2012 | 1 | |
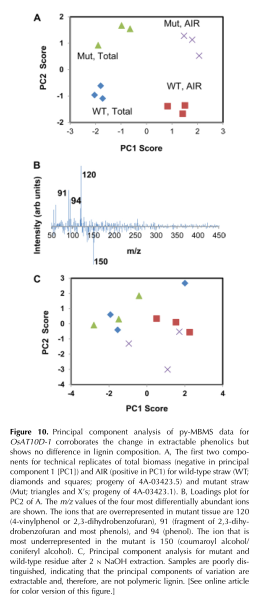
| 14:26, 8 June 2014 | Figure 10xxy.png (file) |  |
61 KB | Xiaoyanjie2012 | 1 | |
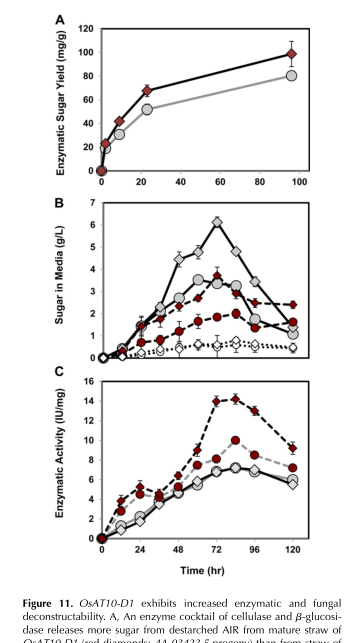
| 14:34, 8 June 2014 | Figure 11xxy.png (file) |  |
87 KB | Xiaoyanjie2012 | 1 | |
| 15:06, 8 June 2014 | Example.jpg (file) |  |
69 KB | Franky123 | ~ | 27 |
| 15:12, 8 June 2014 | RLS1.1.png (file) |  |
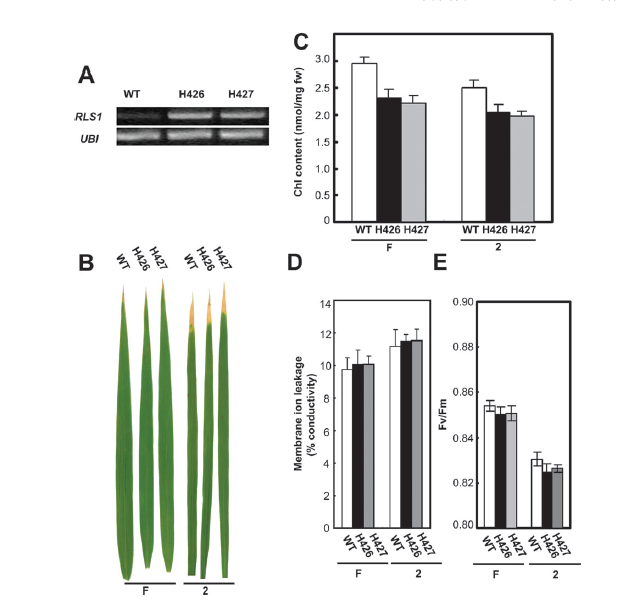
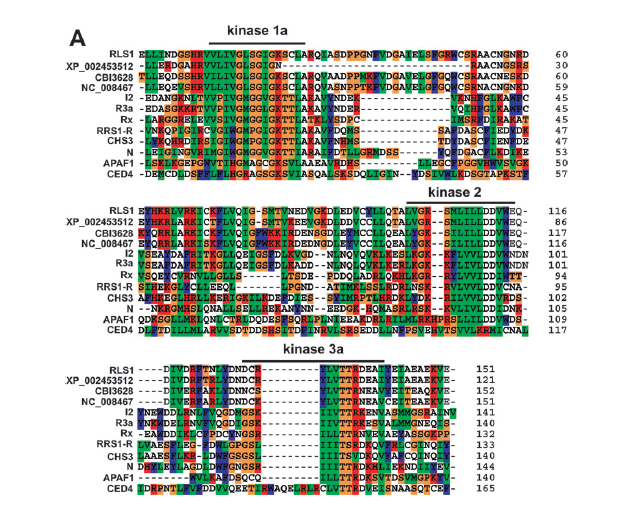
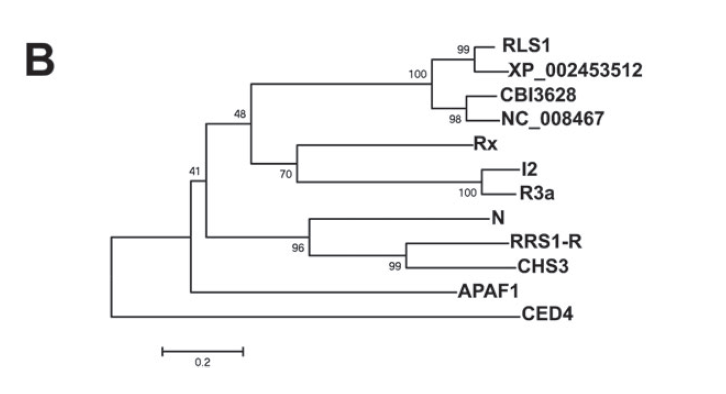
30 KB | YinQi | figure1 | 2 |
| 15:21, 8 June 2014 | Function-1.jpg (file) |  |
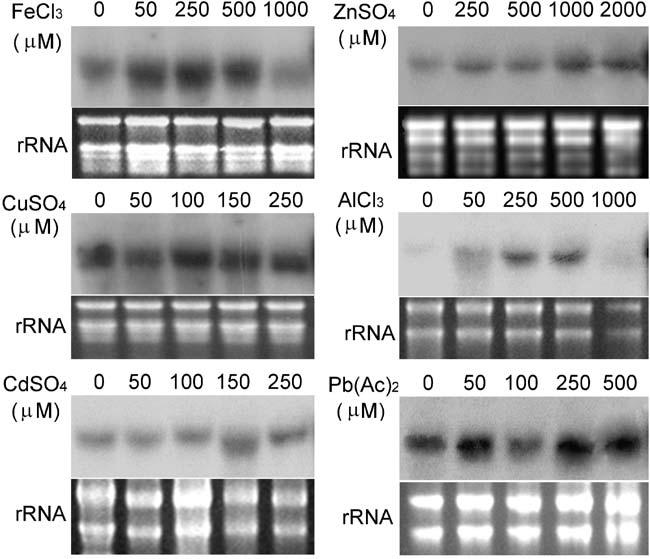
53 KB | Zhangyulong | Northern blot analysis of OsMT-II-1a under different metal ion treatments. Rice seedlings were treated with metals FeCl3, CuSO4, CdSO4, ZnSO4, AlCl3 or Pb(Ac)2 for 24 h. Total RNA was extracted from shoots. Total RNA (25 mg) was loaded in each lane. The e | 1 |
| 15:21, 8 June 2014 | RLS1.7.png (file) |  |
110 KB | YinQi | figure2 | 2 |
| 15:22, 8 June 2014 | Expression-1.jpg (file) |  |
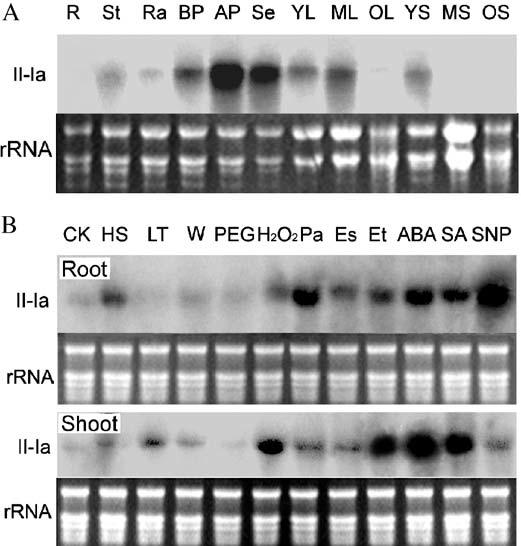
41 KB | Zhangyulong | Northern blot analysis of OsMT-II-1a expression: (A) spatial distribution of OsMT-II-1a expression using total RNA isolated from roots (R), stems (St), rachises (Ra), glumes before pollination (BP), 2-day glumes after pollination (AP), 15-day-old seeds (S | 1 |
| 15:23, 8 June 2014 | RLS1.7A.png (file) |  |
29 KB | YinQi | figure2 | 2 |
| 15:23, 8 June 2014 | Evolution-1.jpg (file) |  |
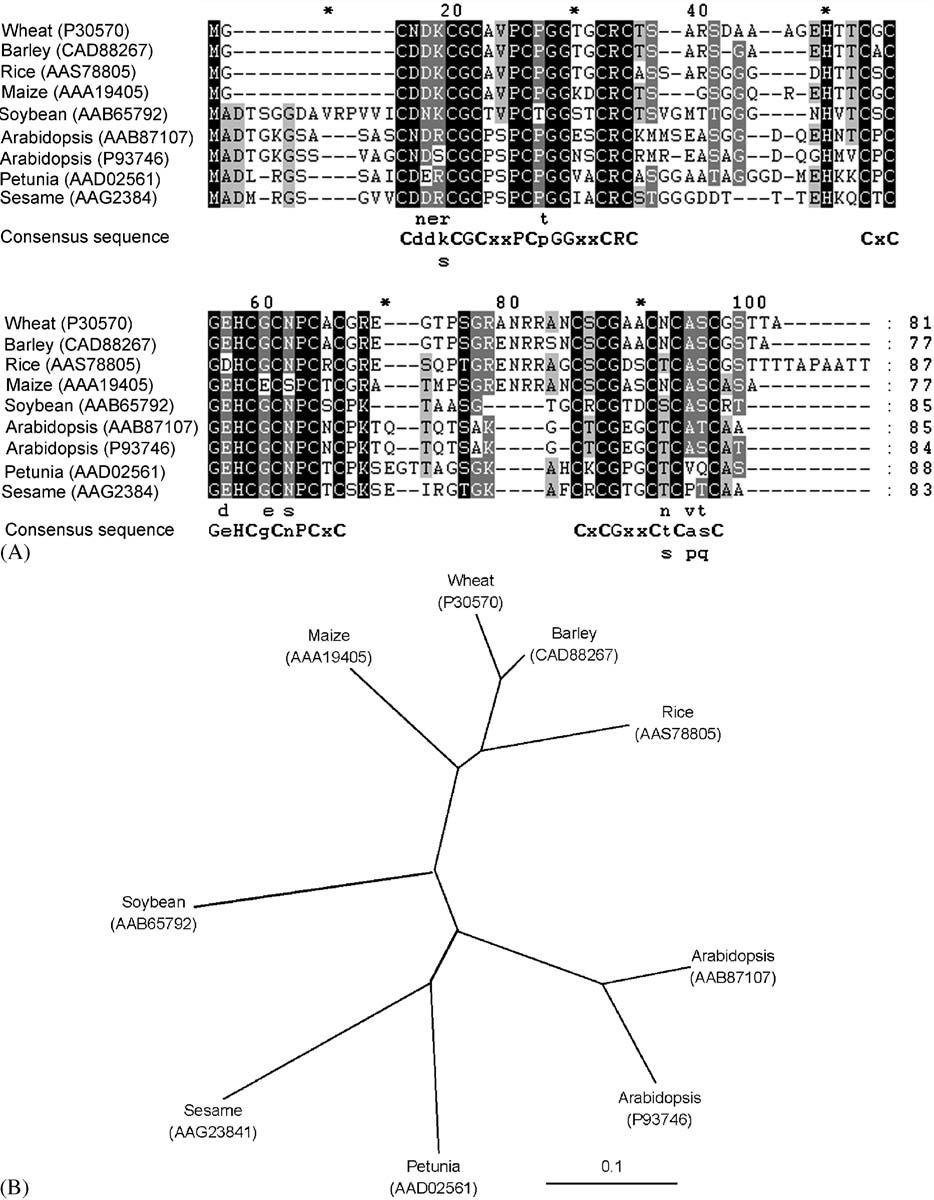
168 KB | Zhangyulong | An alignment (A) and phylogenetic tree (B) were constructed from the deduced amino acid sequence of OsMT-II-1a together with the sequences of other class II MT-like proteins. (A) Sequences were aligned with the ClustalX program. Amino acid residues identi | 1 |
| 15:24, 8 June 2014 | Evolution-2.jpg (file) |  |
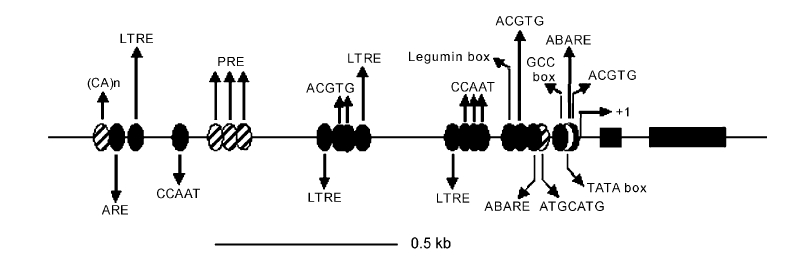
55 KB | Zhangyulong | A schematic diagram of the OsMT-II-1a gene structure. The relative positions of homologous sequences are labeled with ellipses in the figure. The ellipses shown are not proportional to the sizes of the respective elements. Filled ellipses indicate homolog | 1 |
| 15:26, 8 June 2014 | Table.jpg (file) |  |
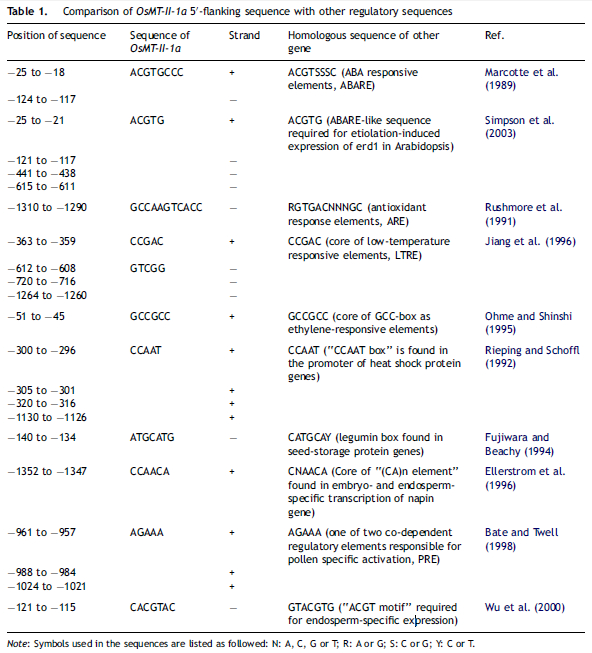
384 KB | Zhangyulong | 1 | |
| 15:31, 8 June 2014 | RLS1.5A.png (file) |  |
379 KB | YinQi | figure3A | 2 |
| 15:33, 8 June 2014 | RLS1.5B.png (file) |  |
52 KB | YinQi | figure3B | 2 |