File list
This special page shows all uploaded files.
| Date | Name | Thumbnail | Size | Description | Versions |
|---|---|---|---|---|---|
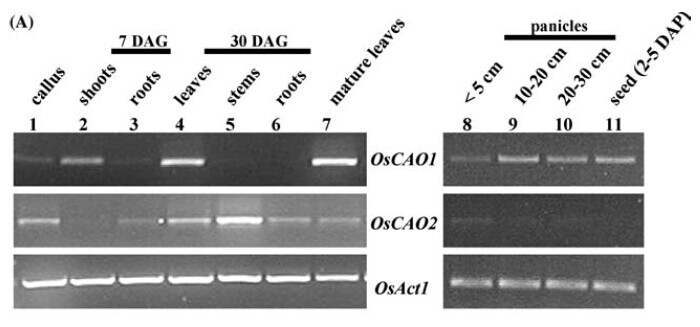
| 05:26, 1 June 2014 | Expression profiles of OsCAO1.jpg (file) |  |
41 KB | 1 | |
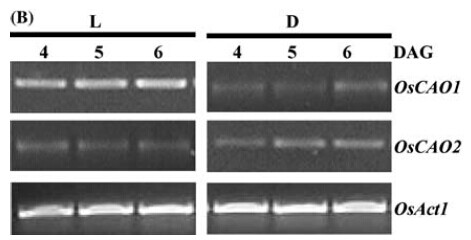
| 05:33, 1 June 2014 | Expression profiles of OsCAO1 B.jpg (file) |  |
22 KB | Expression levels of OsCAO1 and OsCAO2 in seedlings 4, 5, and 6 d after germination; DAG grown under continuous light L or darkness D. | 1 |
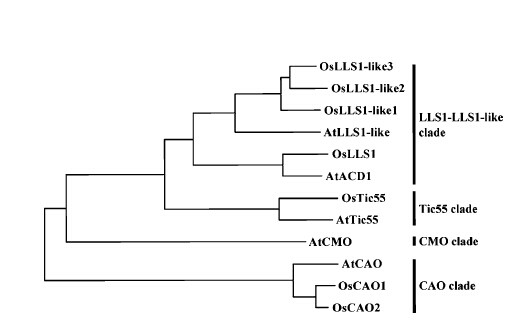
| 05:46, 1 June 2014 | Phylogeneic trees of the proteins.jpg (file) |  |
21 KB | Phylogeneic trees of the proteins containing the conserved Rieske [2Fe–2S] binding site from rice and Arabidopsis. Note that there are two genes related to the CAO clade in rice, but only one in Arabidopsis. | 1 |
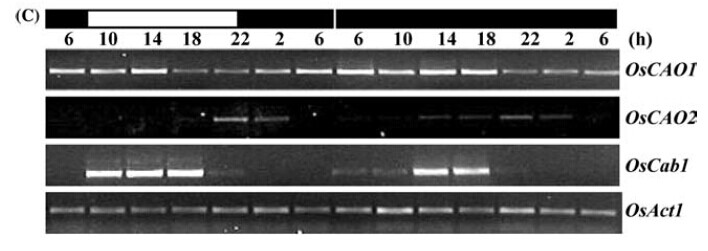
| 06:34, 1 June 2014 | Circadian regulation of OsCAO1.jpg (file) |  |
37 KB | Circadian regulation of OsCAO1. Plants were grown in greenhouse 14 h/10 h light/dark, and then transferred to continuous darkness. Flag leaves of two or three plants were harvested for RNA extraction. | 1 |
| 06:35, 1 June 2014 | Analysis of OsCAO1 under different light conditions.jpg (file) |  |
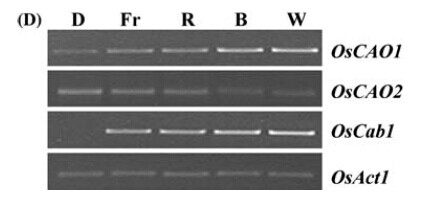
15 KB | Analysis of OsCAO1.Expression levels were determined in 4-day-old dark-grown wild-type seedlings after exposure to various light sources. D, darkness; Fr, far-red light; R, red light; B, blue light; W, white light. | 1 |
| 06:45, 1 June 2014 | Effect of light on OsCAO1.jpg (file) |  |
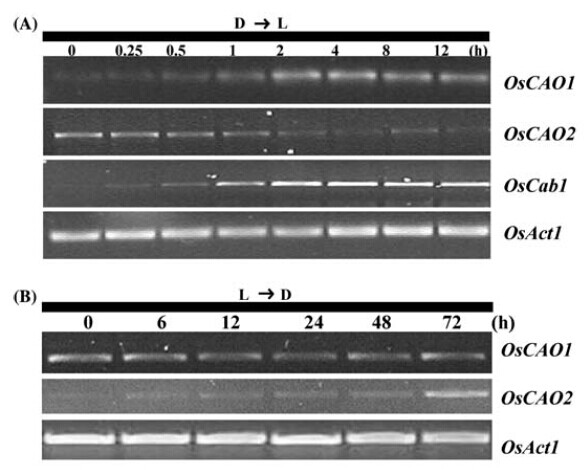
53 KB | (A) Expression levels after etiolated 4 DAG seedlings were exposed to illumination. (B) Expression patterns of 4 DAG light-grown seedlings after transfer to dark conditions. | 1 |
| 07:46, 1 June 2014 | Schematic diagrams of the rice CAO genes and insertion positions of T-DNA and Tos17.jpg (file) |  |
12 KB | The nine exons are shaded and eight introns are indicated with open boxes. In Line 1C-039-43, T-DNA is inserted into the first intron of OsCAO1. | 1 |
| 07:46, 1 June 2014 | Phenotype comparisons between OsCAO1 KO and WT.jpg (file) |  |
26 KB | 1 | |
| 07:47, 1 June 2014 | Genotyping and GUS activity in progeny of Line 1C-039-43.jpg (file) |  |
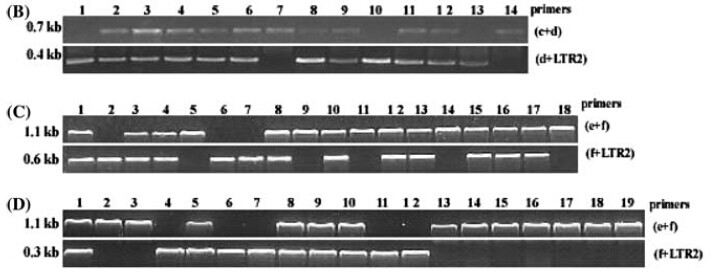
23 KB | Genotyping and GUS activity in progeny of Line 1C-039-43. Thirty plants were genotyped with primers a and b (upper), or primers a and RB (lower). The 0.6-kb genomicDNAbands are PCR product using primers a and b, if no T-DNA insertion; 0.4-kb bands are PCR | 1 |
| 07:49, 1 June 2014 | Genotyping of T2 progeny of Line 1B-044-10.jpg (file) |  |
44 KB | 1 |