Difference between revisions of "File:Fig.1w.png"
| (One intermediate revision by the same user not shown) | |||
| Line 1: | Line 1: | ||
| − | Figure | + | Figure 1w. Northern- and Southern-blot analysis of Bphi008a in wild-type and transgenic plants, and evaluation of its contribution to resistance to the BPH. A, Bphi008a expression levels in normal wild-type (WT) and six T0 OE plants. OE17 was a three-copy insertion plant, OE10 was a two-copy insertion plant, and the rest were one-copy insertion plants. B, Bphi008a expression levels in normal wild-type and six T0 RNAi plants after the BPH had been feeding for 48 h. C, Southern-blot analysis of OE21 T2 progeny. Lanes 1 to 6, Samples from six randomly chosen T2 plants; lane M, lDNA/HindIII marker. D, Evaluation of resistance to the BPH. Fifty plants of each line were chosen for analysis of percentage of severity score to BPH after the BPH had been feeding for 72, 96, and 120 h. Five independent experiments were performed with similar results, and the results of one representative experiment are shown. E, Electronic penetration graph evaluation of BPH phloem-feeding times on OE10, OE21, wild-type, RNAi5, and RNAi7 plants. Each bar represents the mean time 6 SE of five replicates. F, Honeydew area evaluation after the BPH had been feeding for 48 and 72 h on OE21 and wild-type plants. The size of the honeydew area and the intensity of the honeydew color indicate the BPH feeding activity. Standard bars indicate mean values from eight replicates. Significant differences in E and F are indicated with asterisks (* P<0.05, ** P<0.01, by Student’s t test). |
Latest revision as of 09:11, 26 May 2014
Figure 1w. Northern- and Southern-blot analysis of Bphi008a in wild-type and transgenic plants, and evaluation of its contribution to resistance to the BPH. A, Bphi008a expression levels in normal wild-type (WT) and six T0 OE plants. OE17 was a three-copy insertion plant, OE10 was a two-copy insertion plant, and the rest were one-copy insertion plants. B, Bphi008a expression levels in normal wild-type and six T0 RNAi plants after the BPH had been feeding for 48 h. C, Southern-blot analysis of OE21 T2 progeny. Lanes 1 to 6, Samples from six randomly chosen T2 plants; lane M, lDNA/HindIII marker. D, Evaluation of resistance to the BPH. Fifty plants of each line were chosen for analysis of percentage of severity score to BPH after the BPH had been feeding for 72, 96, and 120 h. Five independent experiments were performed with similar results, and the results of one representative experiment are shown. E, Electronic penetration graph evaluation of BPH phloem-feeding times on OE10, OE21, wild-type, RNAi5, and RNAi7 plants. Each bar represents the mean time 6 SE of five replicates. F, Honeydew area evaluation after the BPH had been feeding for 48 and 72 h on OE21 and wild-type plants. The size of the honeydew area and the intensity of the honeydew color indicate the BPH feeding activity. Standard bars indicate mean values from eight replicates. Significant differences in E and F are indicated with asterisks (* P<0.05, ** P<0.01, by Student’s t test).
File history
Click on a date/time to view the file as it appeared at that time.
| Date/Time | Thumbnail | Dimensions | User | Comment | |
|---|---|---|---|---|---|
| current | 08:08, 26 May 2014 | 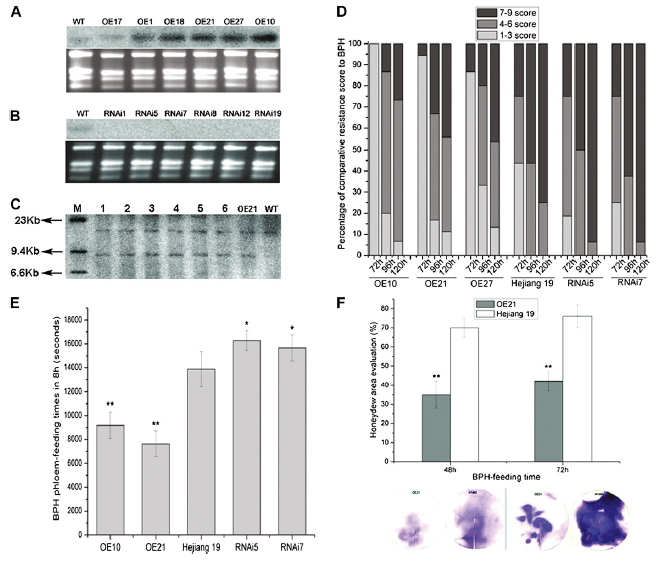 | 658 × 562 (226 KB) | WilliamE (talk | contribs) | |
| 08:03, 26 May 2014 | 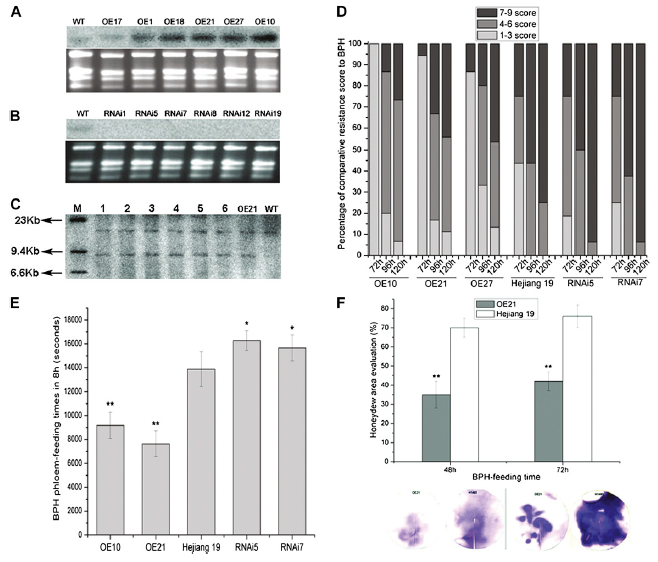 | 658 × 562 (226 KB) | WilliamE (talk | contribs) | Figure 1. Northern- and Southern-blot analysis of Bphi008a in wild-type and transgenic plants, and evaluation of its contribution to resistance to the BPH. A, Bphi008a expression levels in normal wild-type (WT) and six T0 OE plants. OE17 was a three-copy |
- You cannot overwrite this file.
File usage
The following file is a duplicate of this file (more details):
There are no pages that link to this file.


