Difference between revisions of "File:Expression pattern of OsC6.jpg"
(Expression pattern of OsC6. A, Spatial and temporal expression analyses of OsC6 by qRT-PCR. Rice Actin1 (OsActin1) expression was used as a control. Total RNA was isolated from rice tissues: root, shoot, leaf, glume, lemma, palea, pistil at stage 13, and ) |
|||
| Line 1: | Line 1: | ||
| − | Expression pattern of OsC6. A, Spatial and temporal expression | + | Expression pattern of OsC6. A, Spatial and temporal expression analyses of OsC6 by qRT-PCR. Rice Actin1 (OsActin1) expression was used as a control. Total RNA was isolated from rice tissues: root, shoot, leaf, glume, lemma, palea, pistil at stage 13, and anthers at various stages (St 8, stage 8; St 9, stage 9; St 10, stage 10; St 11, stage 11; St 13, stage 13). B, GUS expression in anthers at stage 10 of wild-type (WT; left) and tdr (right) background. C, GUS expression was visible in immature anthers at different stages (from stage 8 to stage 13). D, GUS expression (arrowhead) in the tapetal cells at stage 10. The section was counterstained by Safranin O. E to H, In situ analyses of OsC6. E, A wild-type anther at stage 8 showing no OsC6 expression. F, A wild-type anther at stage 10 showing stronger OsC6 expression in tapetal cells. G, The expression of OsC6 decreased at stage 11. H, Successive section to that shown in F, probed with the OsC6 sense probe. A, Anther; E, epidermis; L, lemma; Msp, microspore; P, palea; T, tapetum; Tds, tetrads. Bars = 2 mm in B, 100 mm in C, and 20 mm in D to H. |
| − | analyses of OsC6 by qRT-PCR. Rice Actin1 (OsActin1) expression | ||
| − | was used as a control. Total RNA was isolated from rice tissues: root, | ||
| − | shoot, leaf, glume, lemma, palea, pistil at stage 13, and anthers at | ||
| − | various stages (St 8, stage 8; St 9, stage 9; St 10, stage 10; St 11, stage 11; | ||
| − | St 13, stage 13). B, GUS expression in anthers at stage 10 of wild-type | ||
| − | (WT; left) and tdr (right) background. C, GUS expression was visible in | ||
| − | immature anthers at different stages (from stage 8 to stage 13). D, GUS | ||
| − | expression (arrowhead) in the tapetal cells at stage 10. The section was | ||
| − | counterstained by Safranin O. E to H, In situ analyses of OsC6. E, A | ||
| − | wild-type anther at stage 8 showing no OsC6 expression. F, A wild-type | ||
| − | anther at stage 10 showing stronger OsC6 expression in tapetal cells. G, | ||
| − | The expression of OsC6 decreased at stage 11. H, Successive section to | ||
| − | that shown in F, probed with the OsC6 sense probe. A, Anther; E, | ||
| − | epidermis; L, lemma; Msp, microspore; P, palea; T, tapetum; Tds, | ||
| − | tetrads. Bars = 2 mm in B, 100 mm in C, and 20 mm in D to H. | ||
Latest revision as of 13:29, 1 June 2014
Expression pattern of OsC6. A, Spatial and temporal expression analyses of OsC6 by qRT-PCR. Rice Actin1 (OsActin1) expression was used as a control. Total RNA was isolated from rice tissues: root, shoot, leaf, glume, lemma, palea, pistil at stage 13, and anthers at various stages (St 8, stage 8; St 9, stage 9; St 10, stage 10; St 11, stage 11; St 13, stage 13). B, GUS expression in anthers at stage 10 of wild-type (WT; left) and tdr (right) background. C, GUS expression was visible in immature anthers at different stages (from stage 8 to stage 13). D, GUS expression (arrowhead) in the tapetal cells at stage 10. The section was counterstained by Safranin O. E to H, In situ analyses of OsC6. E, A wild-type anther at stage 8 showing no OsC6 expression. F, A wild-type anther at stage 10 showing stronger OsC6 expression in tapetal cells. G, The expression of OsC6 decreased at stage 11. H, Successive section to that shown in F, probed with the OsC6 sense probe. A, Anther; E, epidermis; L, lemma; Msp, microspore; P, palea; T, tapetum; Tds, tetrads. Bars = 2 mm in B, 100 mm in C, and 20 mm in D to H.
File history
Click on a date/time to view the file as it appeared at that time.
| Date/Time | Thumbnail | Dimensions | User | Comment | |
|---|---|---|---|---|---|
| current | 13:26, 1 June 2014 | 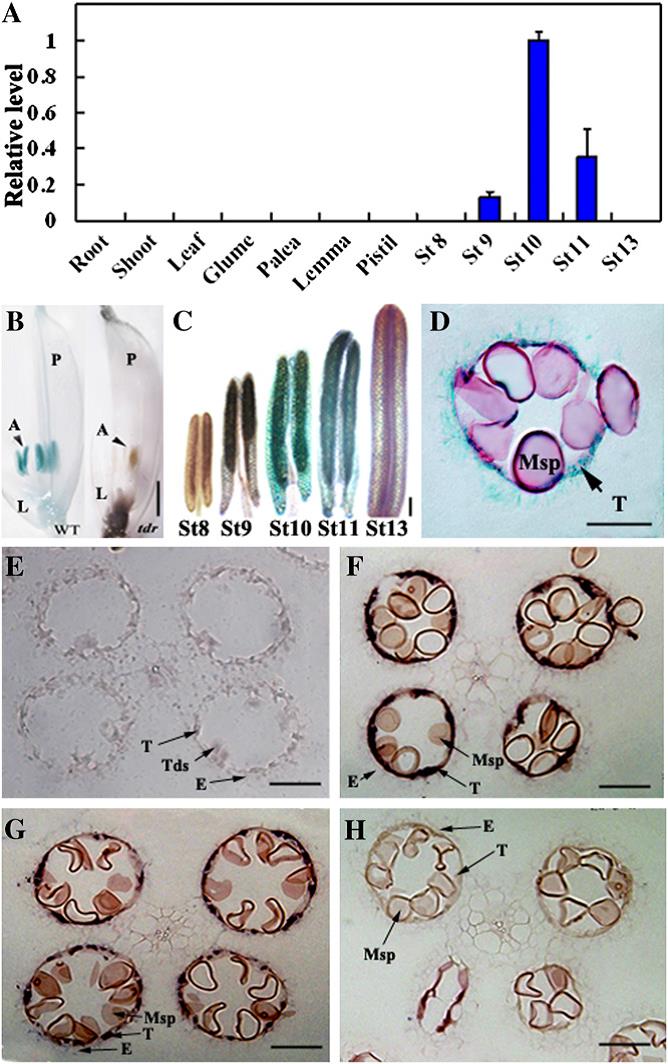 | 668 × 1,064 (105 KB) | Zhaocf (talk | contribs) | Expression pattern of OsC6. A, Spatial and temporal expression analyses of OsC6 by qRT-PCR. Rice Actin1 (OsActin1) expression was used as a control. Total RNA was isolated from rice tissues: root, shoot, leaf, glume, lemma, palea, pistil at stage 13, and |
- You cannot overwrite this file.
File usage
There are no pages that link to this file.