File list
This special page shows all uploaded files.
| Date | Name | Thumbnail | Size | User | Description | Versions |
|---|---|---|---|---|---|---|
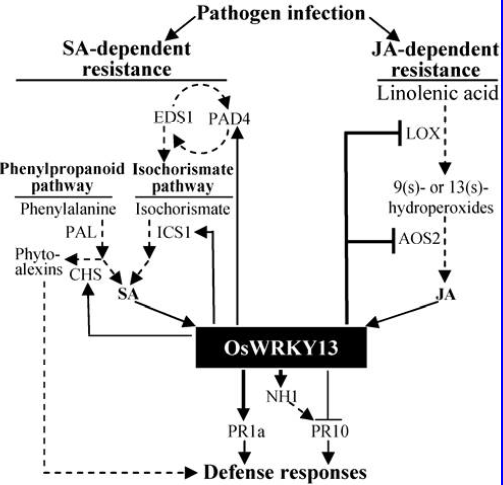
| 16:25, 24 May 2014 | FIG1.png (file) |  |
119 KB | Xunaizia | Defense signaling model for the roles of OsWRKY13 in regulation of salicylic acid (SA)- and jasmonic acid (JA)-dependent pathways. Thick solid lines indicate direct action of OsWRKY13 has been confirmed by protein-DNA binding assays; thin solid lines, reg | 1 |
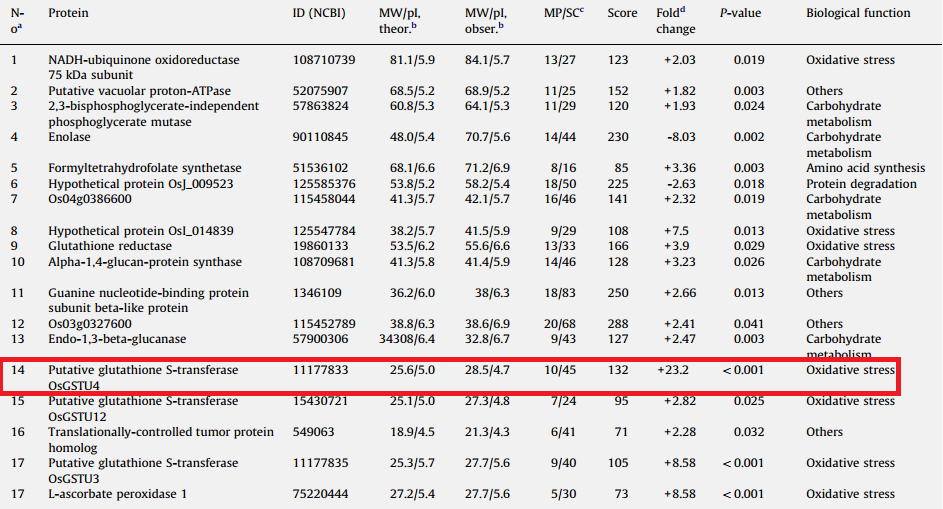
| 15:08, 24 May 2014 | GSTs function.png (file) |  |
189 KB | Wangyl | Reverted to version as of 15:03, 24 May 2014 | 6 |
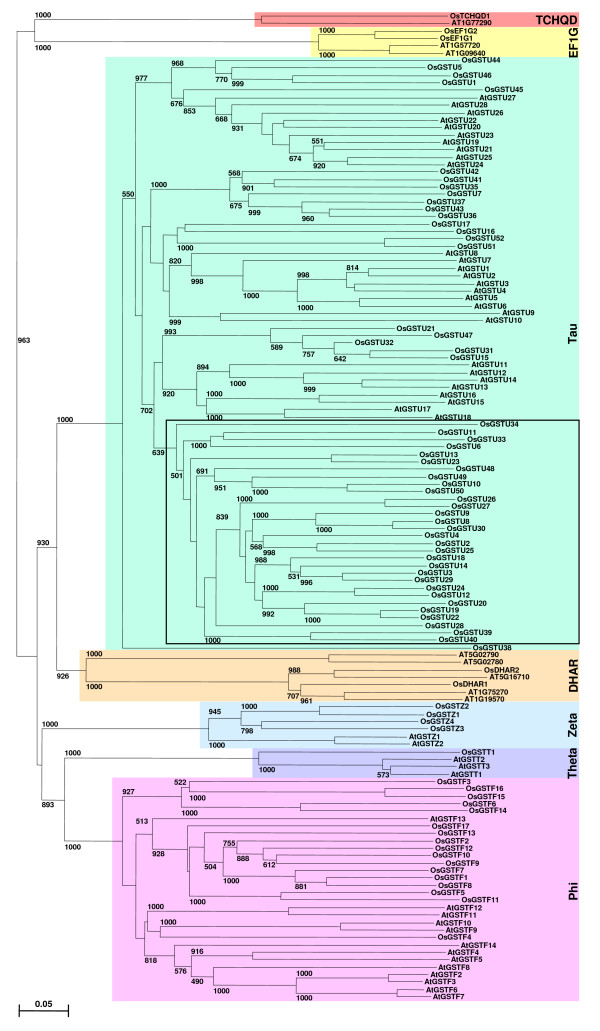
| 14:52, 24 May 2014 | Phylogenetic tree.png (file) |  |
327 KB | Wangyl | 4 | |
| 13:19, 24 May 2014 | Picture3 Transcriptional profile of OsDREB1B in rice seedlings subjected to different stress treatments.jpg (file) |  |
438 KB | Anthea | 1 | |
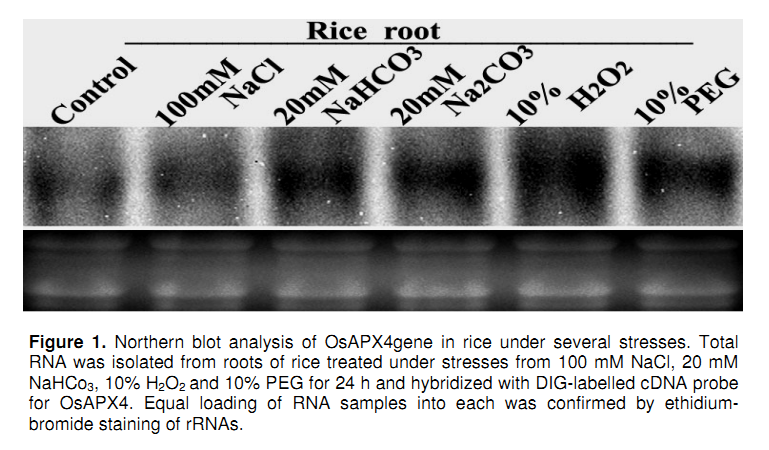
| 13:18, 24 May 2014 | Picture2 Expression of rice DREB1s under drought, salt, and cold stresses in rice seedlings from the SALK RiceGE database.jpg (file) |  |
79 KB | Anthea | 1 | |
| 13:17, 24 May 2014 | Picture1 RNA-gel blot analysis of the OsDREB transcripts under various stress conditions.jpg (file) |  |
36 KB | Anthea | 1 | |
| 13:10, 24 May 2014 | 搜狗截图14年05月24日2044 1.png (file) |  |
57 KB | LQ | 1 | |
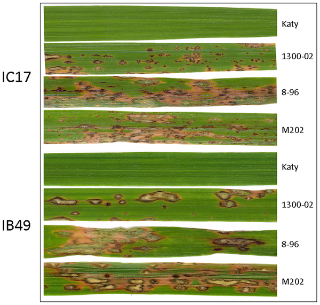
| 12:58, 24 May 2014 | Figure 4. Blast symptoms of rice.png (file) |  |
131 KB | Zhonghongming | Name of weedy rice and blast race were indicated. Pictures were scanned 7 days after inoculation | 1 |
| 12:56, 24 May 2014 | Figure 5. Extended haplotype homozygosity (EHH) at and around Pi-ta.png (file) | _at_and_around_Pi-ta.png) |
50 KB | Zhonghongming | The EHH of two core haplotypes (alanine-918 for resistant Pi-ta allele and serine-918 for representing susceptible pi-ta allele) were compared in the Pi-ta region of US weedy rice (A), Asian (B) and US cultivated rice (C), and wild species O. rufipogon (D | 1 |
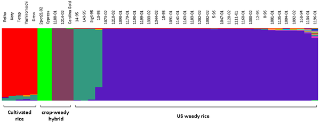
| 12:51, 24 May 2014 | Figure 3. Structure diagram of rice accessions carrying Pi-ta.png (file) |  |
13 KB | Zhonghongming | Name of accessions and presumed crop-weedy hybrid progeny were indicated | 1 |
| 12:49, 24 May 2014 | Figure 2. Phylogenetic tree showing groups of US weedy rice among rice.png (file) |  |
79 KB | Zhonghongming | (A) An evolutionary tree with genetic distance and group name shown. Red group indicates accession with Pi-ta (Ala-918). Yellow group indicates pi-ta (Ser-918). Dark black group indicates pi-ta (Ser-918 with more amino acid polymorphisms at different posi | 1 |
| 12:38, 24 May 2014 | Figure 2.1 Phylogenetic tree showing groups of US weedy rice among rice populationsjournal.pone.0026260.g002.png (file) |  |
96 KB | Zhonghongming | (A) An evolutionary tree with genetic distance and group name shown. Red group indicates accession with Pi-ta (Ala-918). Yellow group indicates pi-ta (Ser-918). Dark black group indicates pi-ta (Ser-918 with more amino acid polymorphisms at different posi | 1 |
| 12:26, 24 May 2014 | Figure 4. Blast symptoms of ricejournal.pone.0026260.g004.png (file) |  |
3.55 MB | Zhonghongming | Name of weedy rice and blast race were indicated. Pictures were scanned 7 days after inoculation. | 1 |
| 12:22, 24 May 2014 | Figure 2. Phylogenetic tree showing groups of US weedy rice among rice populationsjournal.pone.0026260.g002.png (file) |  |
1.24 MB | Zhonghongming | (A) An evolutionary tree with genetic distance and group name shown. Red group indicates accession with Pi-ta (Ala-918). Yellow group indicates pi-ta (Ser-918). Dark black group indicates pi-ta (Ser-918 with more amino acid polymorphisms at different posi | 1 |
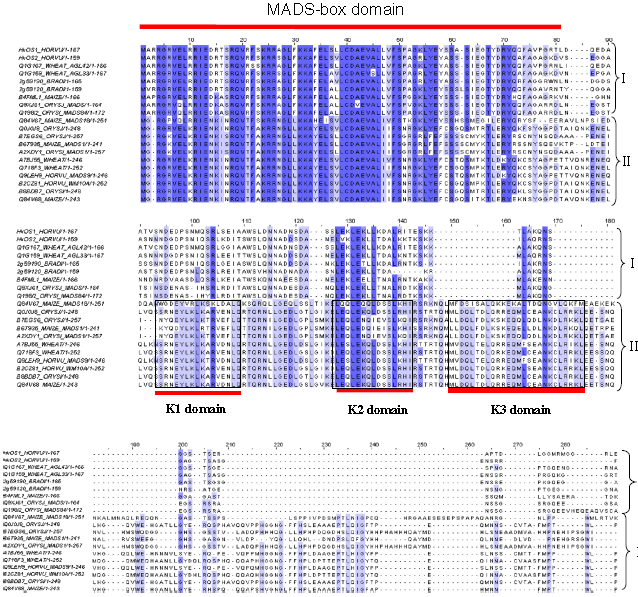
| 10:31, 24 May 2014 | MADSbosdomain.png (file) |  |
302 KB | Sherlock0088 | 1 | |
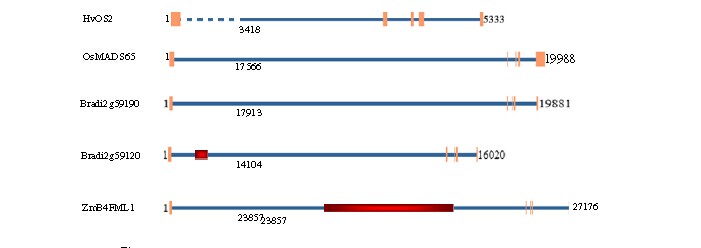
| 10:05, 24 May 2014 | Schematic.jpg (file) |  |
20 KB | Sherlock0088 | 1 | |
| 08:38, 24 May 2014 | F3.small.gif (file) |  |
9 KB | Sancunriguang | 2 | |
| 08:33, 24 May 2014 | Pic4.png (file) |  |
282 KB | Guanyuyan | 1 | |
| 08:30, 24 May 2014 | Pic3.png (file) |  |
123 KB | Guanyuyan | 1 | |
| 08:29, 24 May 2014 | Pic2.png (file) |  |
191 KB | Guanyuyan | 1 | |
| 08:27, 24 May 2014 | Pic1.png (file) |  |
197 KB | Guanyuyan | 1 | |
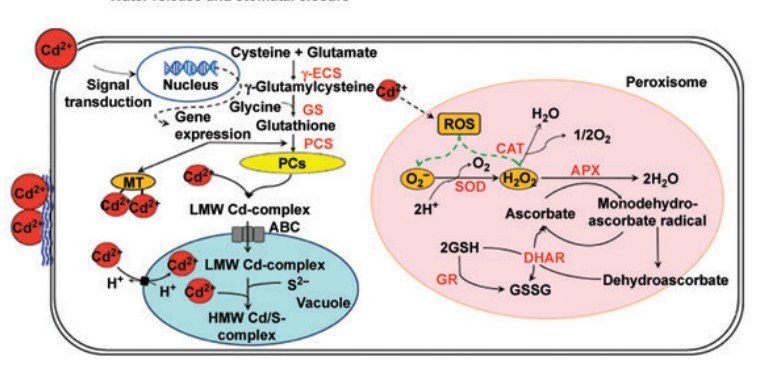
| 08:17, 24 May 2014 | Reponses to Cd.jpg (file) |  |
66 KB | Mofanxing | 1 | |
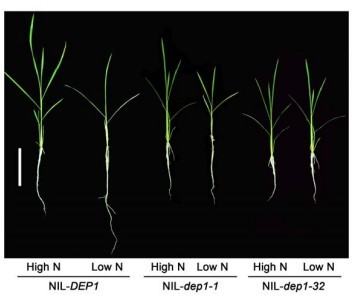
| 08:17, 24 May 2014 | 2 mutation.jpg (file) |  |
19 KB | Mofanxing | 1 | |
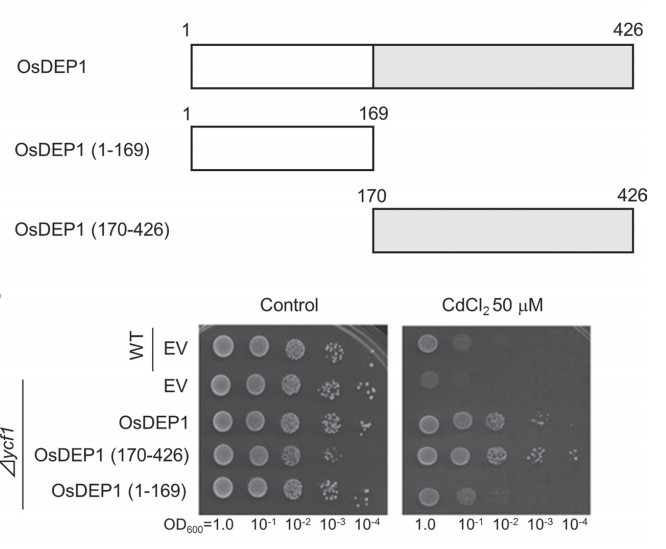
| 08:16, 24 May 2014 | Cd tolerance.jpg (file) |  |
48 KB | Mofanxing | 1 | |
| 07:33, 24 May 2014 | Picture 12 Neighbor joining tree representing the RSUS3 haplotype relationships based on the entire region excluding intron (upstream, transcript, and 3' downstream NTR sequence).jpg (file) | .jpg) |
22 KB | Chenlizhao | 1 | |
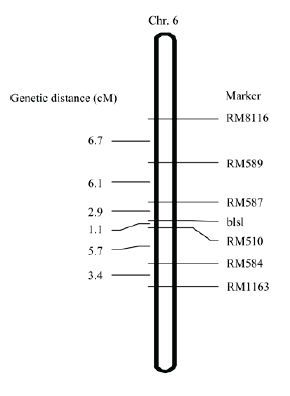
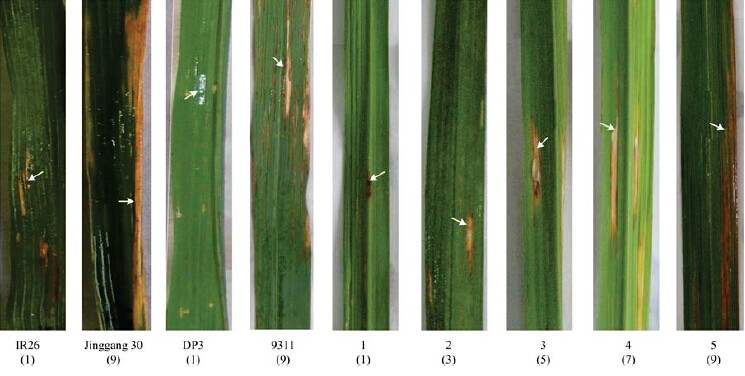
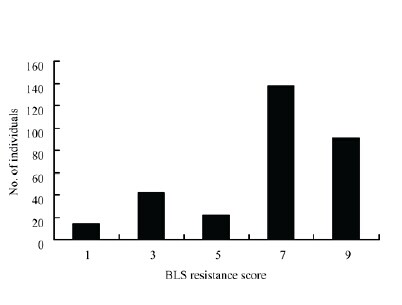
| 07:13, 24 May 2014 | Figure3--bls1.png (file) |  |
16 KB | Julia | 2 | |
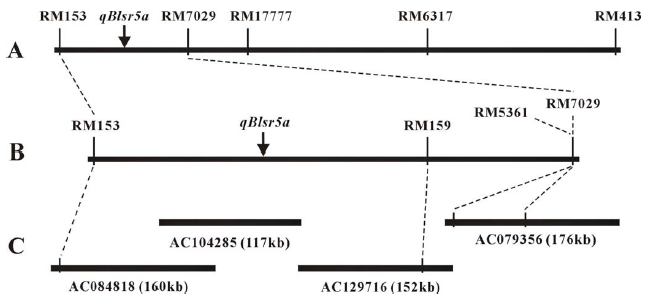
| 07:11, 24 May 2014 | Figure4--bls1.png (file) |  |
61 KB | Julia | 1 | |
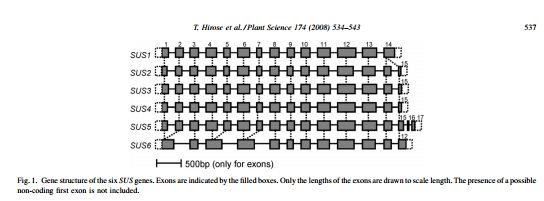
| 07:10, 24 May 2014 | Picture2 Gene structure of the six SUS genes.jpg (file) |  |
29 KB | Chenlizhao | 1 | |
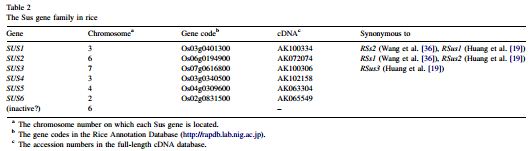
| 07:08, 24 May 2014 | Picture1 The Sus gene family in rice.jpg (file) |  |
25 KB | Chenlizhao | 1 | |
| 06:59, 24 May 2014 | Figure1--bls1.jpg (file) |  |
67 KB | Julia | 2 | |
| 06:57, 24 May 2014 | Figure2--bls1.jpg (file) |  |
11 KB | Julia | 1 | |
| 06:29, 24 May 2014 | Evolutiontree0fOsmads51(65).png (file) | .png) |
17 KB | Sherlock0088 | 1 | |
| 06:29, 24 May 2014 | Phylogenetic Analysis.png (file) |  |
500 KB | Eniacgui | 1 | |
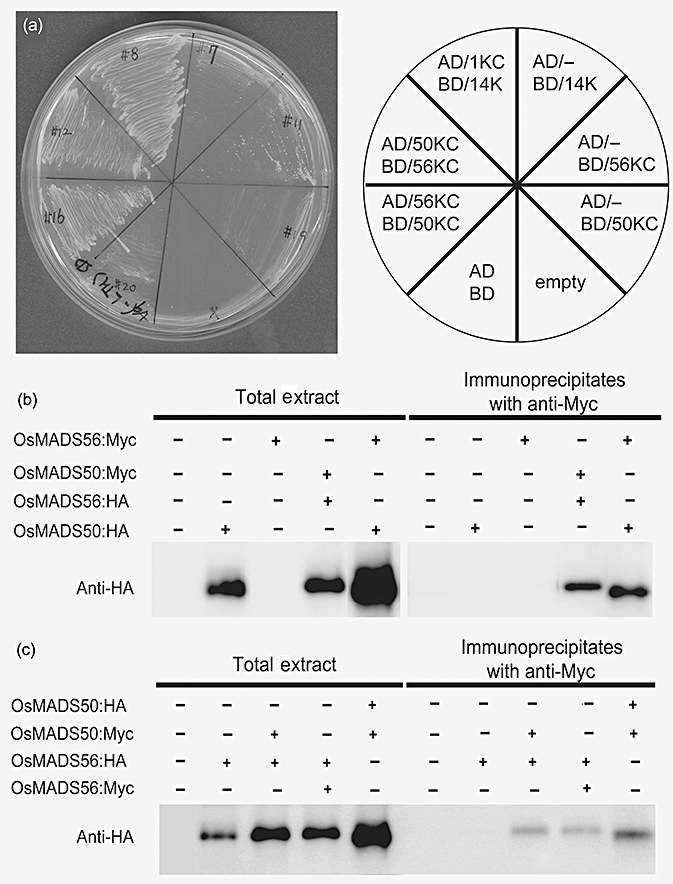
| 06:13, 24 May 2014 | PCE 2008 f8.gif (file) |  |
282 KB | Fangchao | Interaction analyses between OsMADS50 and OsMADS56. (a) Yeast two-hybrid assay. Two plasmids containing either AD or BD construct were introduced into yeast strain and transformants were grown on selective medium lacking Leu, Trp and His. OsMADS14-K bait | 1 |
| 05:44, 24 May 2014 | Schematic diagram of OsMADS50 genomic structure, positions of T-DNA insertional mutant alleles and flowering time of mutants.gif (file) |  |
43 KB | Fangchao | Schematic diagram of OsMADS50 genomic structure, positions of T-DNA insertional mutant alleles and flowering time of mutants. (a) OsMADS50 (Os03g0122600) consists of eight exons (boxes) and seven introns (lines between boxes). Gray boxes indicate 5′ and | 1 |
| 05:43, 24 May 2014 | Picture 11. Nucleotide diversity and divergence in each region of the RSUS3 gene.jpg (file) |  |
63 KB | Chenlizhao | 1 | |
| 05:33, 24 May 2014 | Phenotype comparison between OsMADS50 KO and WT plants.gif (file) |  |
78 KB | Fangchao | Photograph was taken when WT plant (W/W) flowered. The OsMADS50 KO (T/T) plant had not bolted. | 2 |
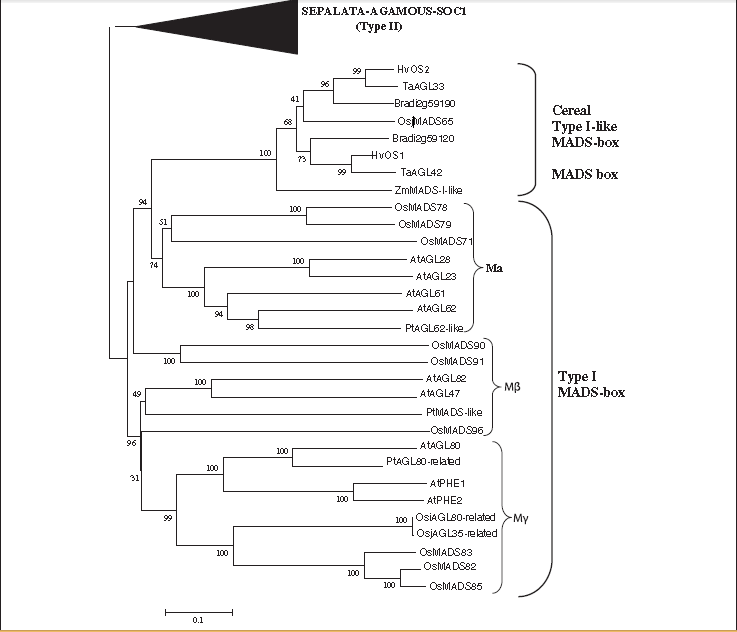
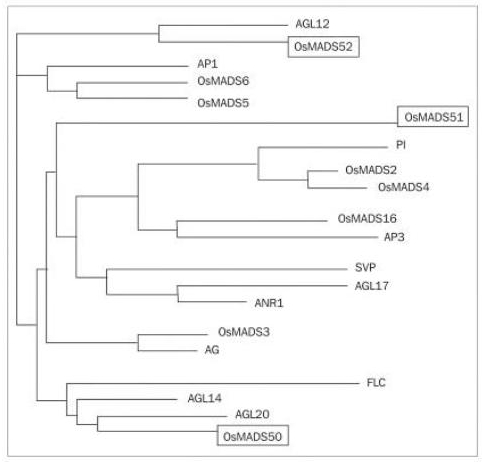
| 05:26, 24 May 2014 | Dendrigram.jpg (file) |  |
57 KB | Fangchao | Dendrigram of various MADS-box proteins of rice and Arabidopsis | 1 |
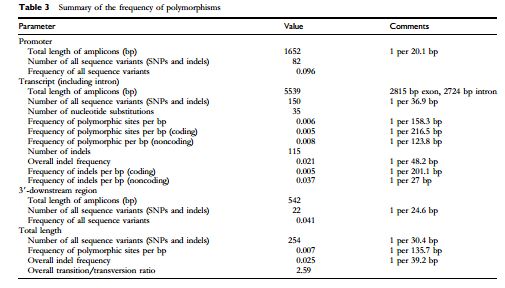
| 05:24, 24 May 2014 | Picture 10. Summary of the frequency of polymorphisms.jpg (file) |  |
39 KB | Chenlizhao | 1 | |
| 05:01, 24 May 2014 | Picture.9 Sus activity and transcript levels of four of the rice SUS genes in germinating shoots in response to submergence.jpg (file) |  |
39 KB | Chenlizhao | 1 | |
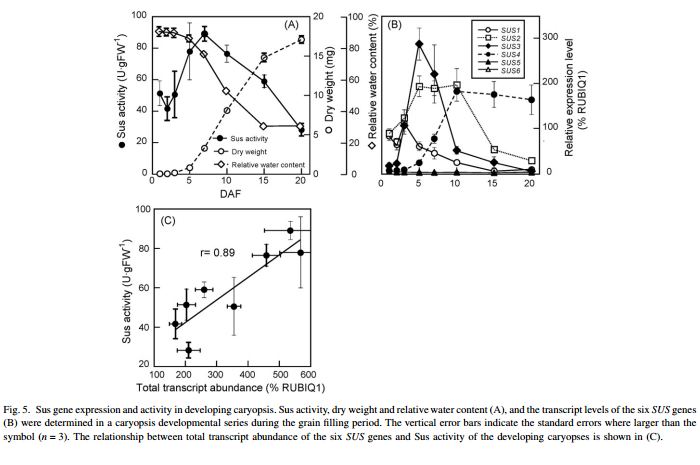
| 05:00, 24 May 2014 | Picture.8 Sus gene expression and activity in developing caryopsis.jpg (file) |  |
55 KB | Chenlizhao | 1 | |
| 04:59, 24 May 2014 | Picture.7 Profiles of transcript levels for SUS and Ces genes in elongating internodes.jpg (file) |  |
47 KB | Chenlizhao | 1 | |
| 04:57, 24 May 2014 | Picture.6A The transcript levels of the SUS genes in various rice tissues.jpg (file) |  |
14 KB | Chenlizhao | 1 | |
| 04:55, 24 May 2014 | Picture.6B The transcript levels of the SUS genes in various rice tissues.jpg (file) |  |
36 KB | Chenlizhao | 1 | |
| 04:50, 24 May 2014 | Picture.5 Temporal expression of RSuS in seeds at various maturation stages.jpg (file) |  |
58 KB | Chenlizhao | 1 | |
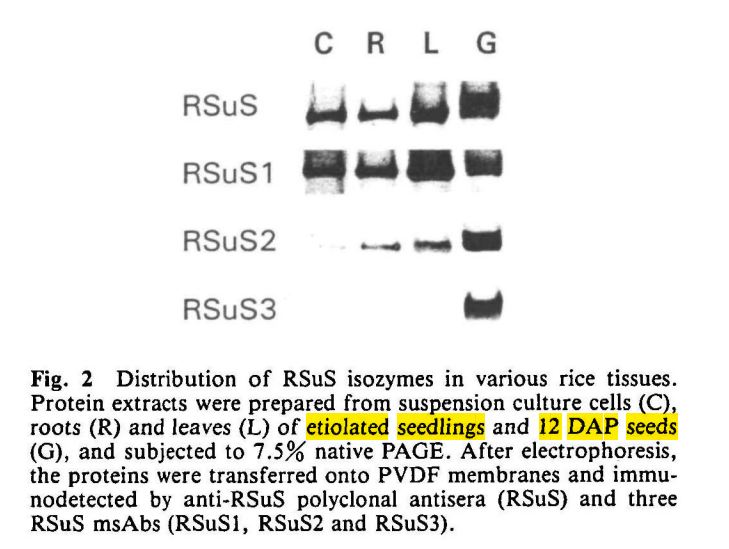
| 04:49, 24 May 2014 | Picture. 4 Distribution of RSuS isozymes in various rice tissues.jpg (file) |  |
69 KB | Chenlizhao | 1 | |
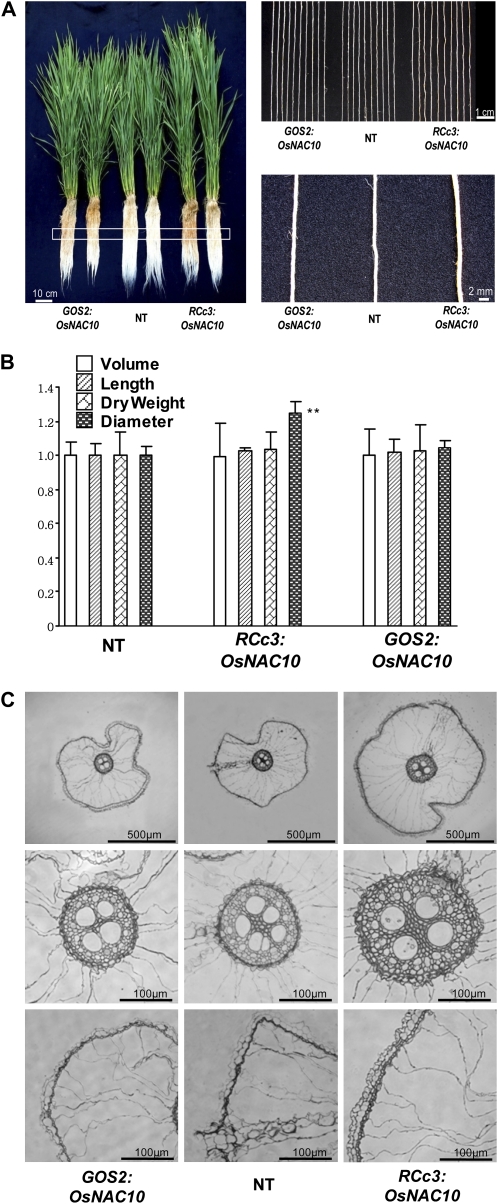
| 04:30, 24 May 2014 | Finger.jpg (file) |  |
345 KB | Yingyingbei | Difference in root growth of RCc3:OsNAC10 and GOS2:OsNAC10 plants. | 1 |
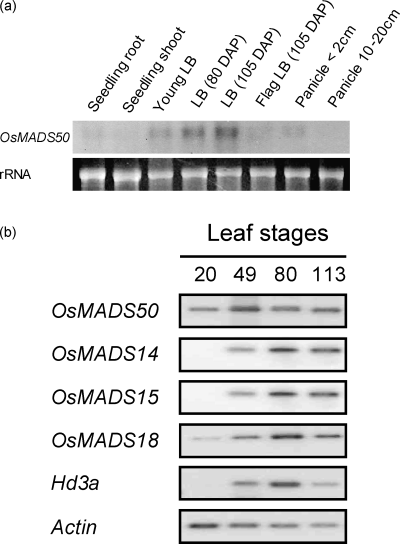
| 03:42, 24 May 2014 | Expression.gif (file) |  |
52 KB | Fangchao | 3 | |
| 03:41, 24 May 2014 | Comparison of the predicted rice Sus proteins as deduced from their cDNA sequences.jpg (file) |  |
21 KB | Chenlizhao | 1 | |
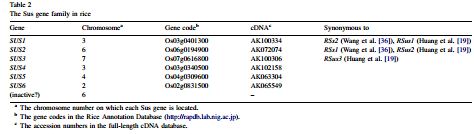
| 03:32, 24 May 2014 | The Sus gene family in rice.jpg (file) |  |
22 KB | Chenlizhao | 1 |