File list
This special page shows all uploaded files.
| Date | Name | Thumbnail | Size | User | Description | Versions |
|---|---|---|---|---|---|---|
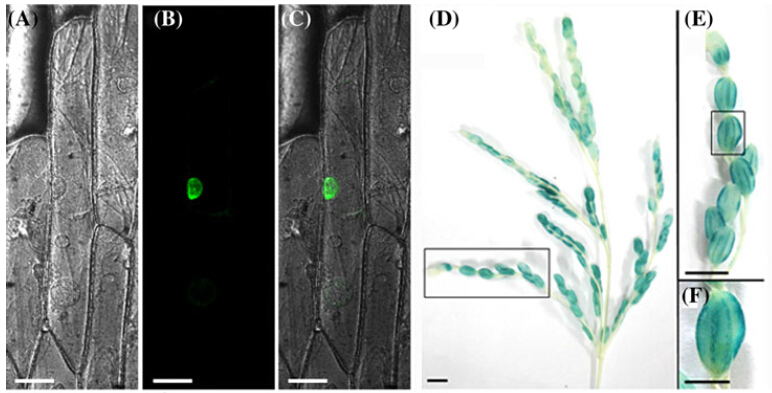
| 12:53, 26 May 2014 | GCFig.1.jpg (file) |  |
190 KB | Guocen | 1 | |
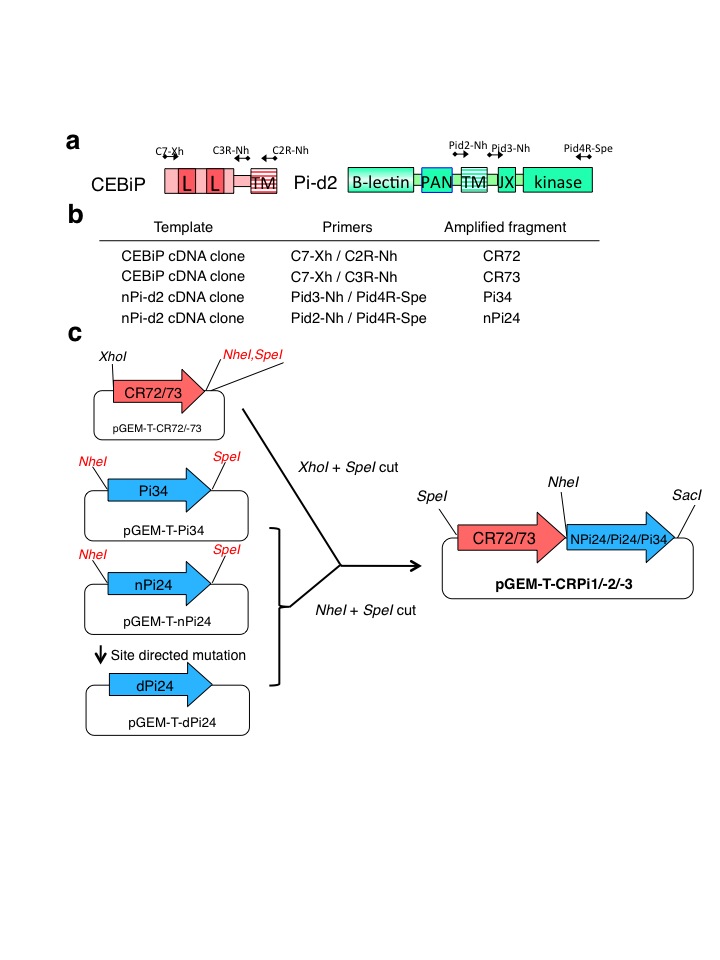
| 12:52, 26 May 2014 | 11103 2012 9998 MOESM1 ESM.jpg (file) |  |
89 KB | Zhouhuailin | 1 | |
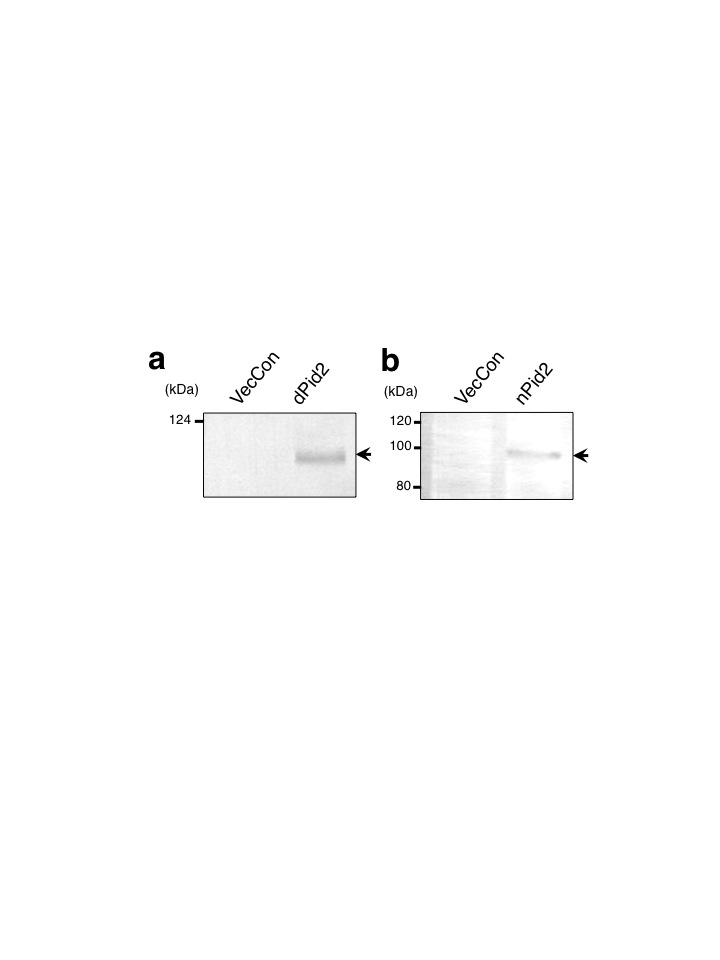
| 12:45, 26 May 2014 | 11103 2012 9998 MOESM2 ESM.jpg (file) |  |
27 KB | Zhouhuailin | 2 | |
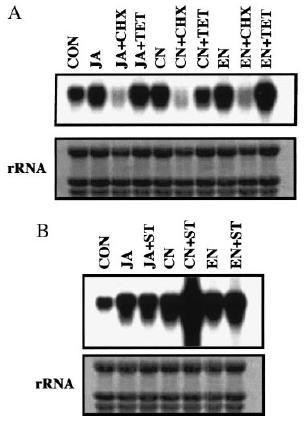
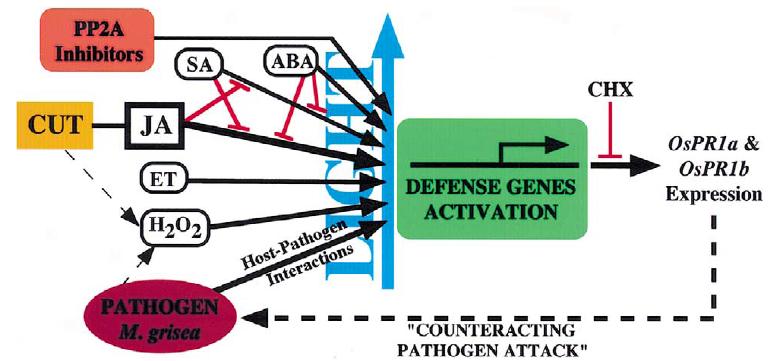
| 09:15, 26 May 2014 | Expression of OsPR1 influenced.JPG (file) |  |
20 KB | Canghai91 | 1 | |
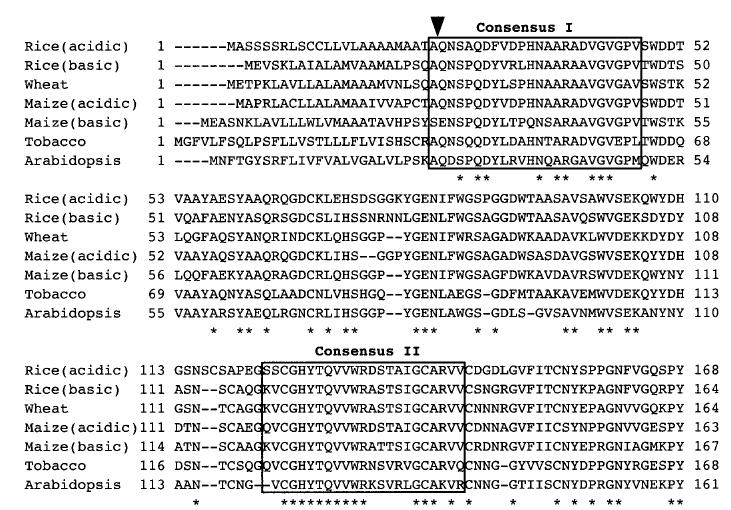
| 09:09, 26 May 2014 | Homologous sequences.JPG (file) |  |
125 KB | Canghai91 | 1 | |
| 09:03, 26 May 2014 | Expression of OsPR1 influenced by SA.JPG (file) |  |
42 KB | Canghai91 | 1 | |
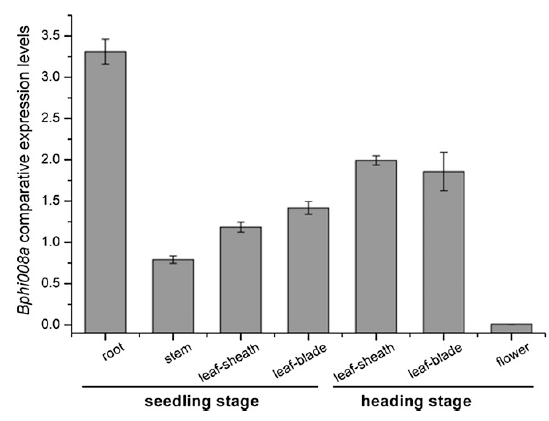
| 08:58, 26 May 2014 | Fig.6w.png (file) |  |
48 KB | WilliamE | Figure 6w. Bphi008a expression patterns in rice from the seedling and heading stages. | 1 |
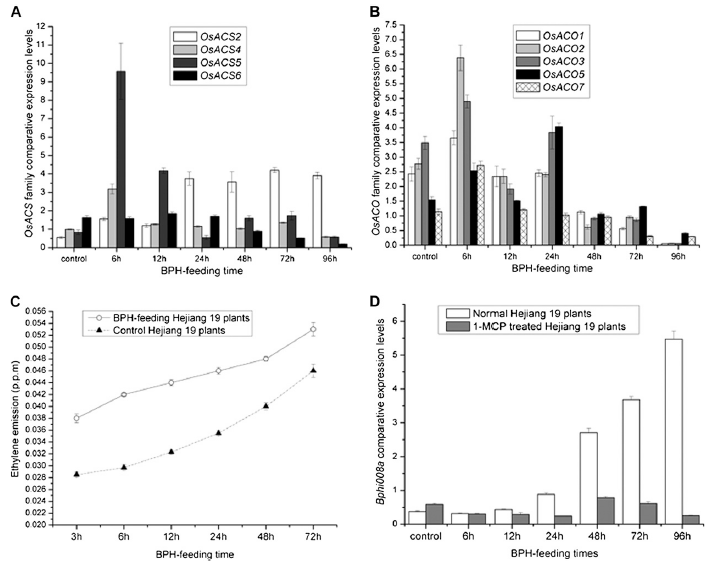
| 08:57, 26 May 2014 | Fig.5w.png (file) |  |
140 KB | WilliamE | Figure 5w. Bphi008a is a downstream gene of the Et signaling pathway. A and B, Comparative expression levels of members of the OsACS and OsACO family after BPH feeding for between 0 and 96 h on wild-type plants. C, Profiles of Et emissions from wildtype p | 1 |
| 08:56, 26 May 2014 | Figure 2. Phenotype of the lvp1 Mutant.jpg (file) |  |
36 KB | Jc0407 | 1 | |
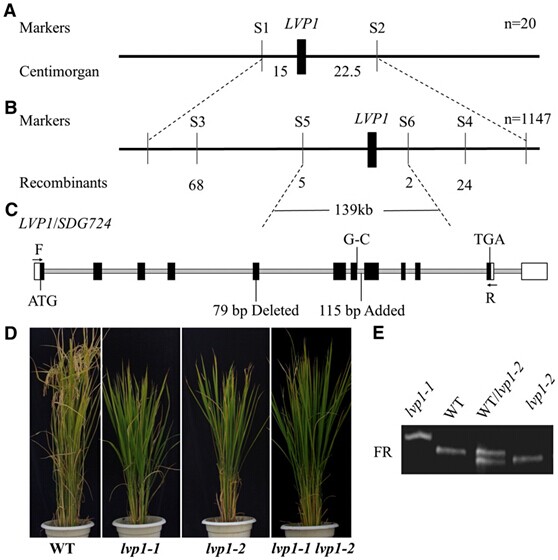
| 08:51, 26 May 2014 | Figure 1. Map-Based Cloning of LVP1.jpg (file) |  |
59 KB | Jc0407 | 1 | |
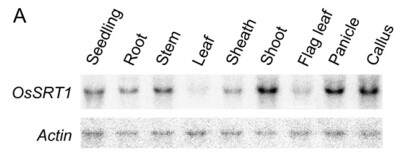
| 08:31, 26 May 2014 | Figure 4. Expression profiles of OsSRT1.jpg (file) |  |
15 KB | Bzwangjie | 1 | |
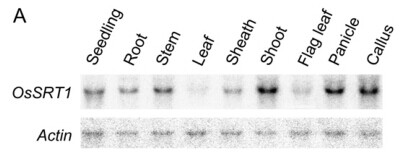
| 08:29, 26 May 2014 | Figure 4. Expression profiles of OsSRT1..jpg (file) |  |
15 KB | Bzwangjie | 1 | |
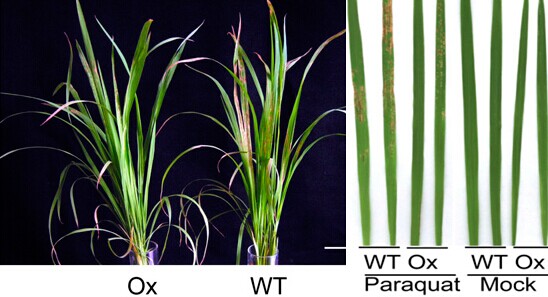
| 08:29, 26 May 2014 | Figure 3. Overexpression of OsSRT1 conferred tolerance to paraquat treatment.jpg (file) |  |
53 KB | Bzwangjie | 1 | |
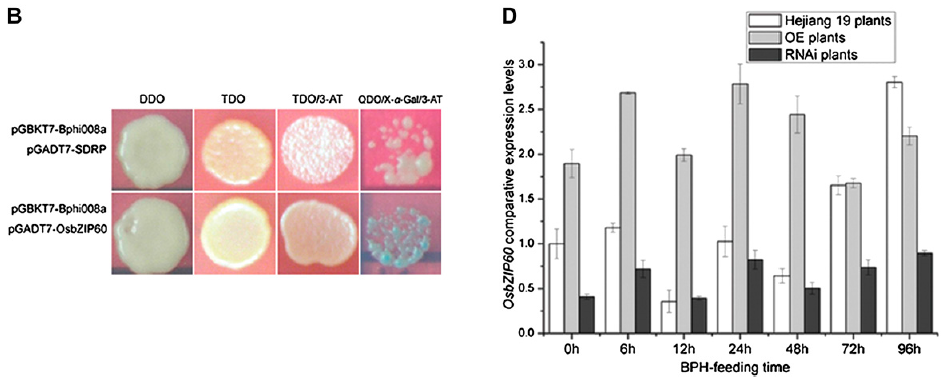
| 08:20, 26 May 2014 | Fig.4w.png (file) |  |
175 KB | WilliamE | Figure 4w. Bphi008a-interacting proteins identified by yeast two-hybrid screening and its interaction with OsbZIP60 or SDRP in vivo. B. Yeast two-hybrid assay of the interaction between Bphi008a and OsbZIP60 or SDRP. TDO/3-AT, Plates containing 5 mM 3-AT; | 1 |
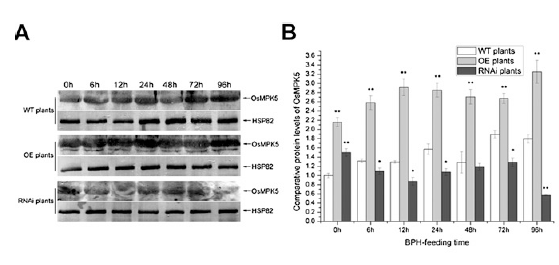
| 08:19, 26 May 2014 | Fig.3w.png (file) |  |
71 KB | WilliamE | Figure 3w. A. Immunoblot analysis of OsMPK5 in transgenic and wild-type (WT) plants after the BPH had been feeding for between 0 and 96 h. Protein (50 mg) was separated by SDS-PAGE, electroblotted, and probed with rabbit OsMPK5 polyclonal antibody (1:1.00 | 1 |
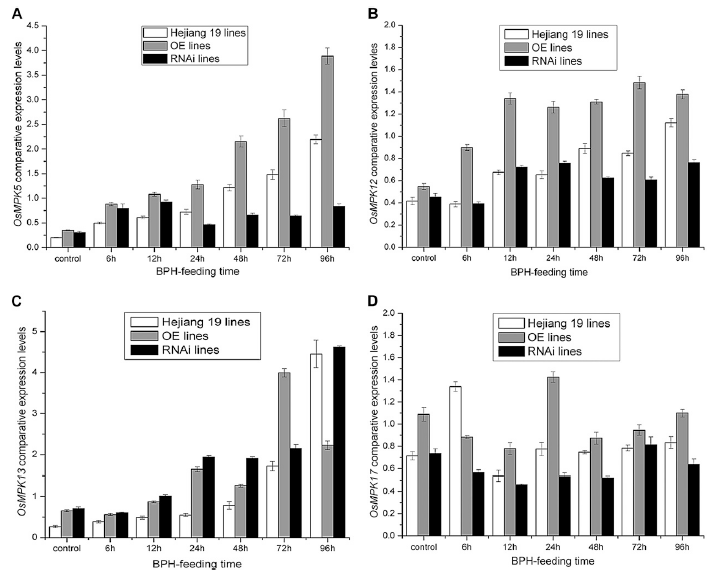
| 08:16, 26 May 2014 | Fig.2w.png (file) |  |
111 KB | WilliamE | Figure 2w. OsMPK5, OsMPK12, OsMPK13, and OsMPK17 expression patterns in transgenic and wild-type plants after the BPH had been feeding for between 0 and 96 h. Corresponding Bphi008a expression levels in transgenic and wild-type plants are shown in Supplem | 1 |
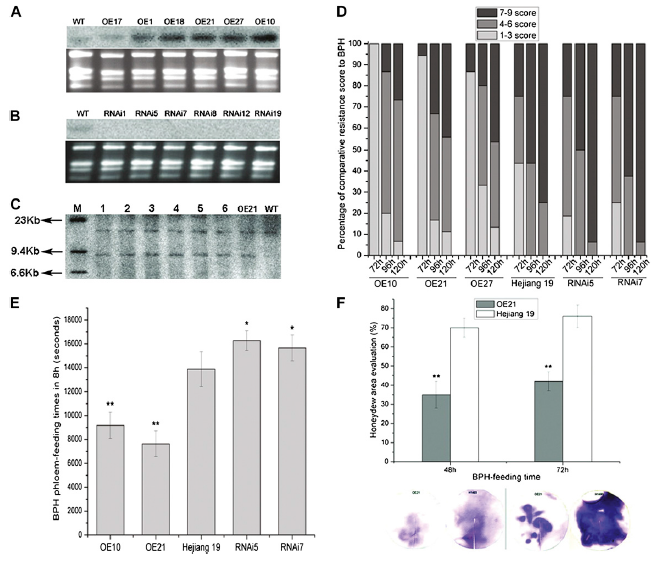
| 08:13, 26 May 2014 | Fig.1e.png (file) |  |
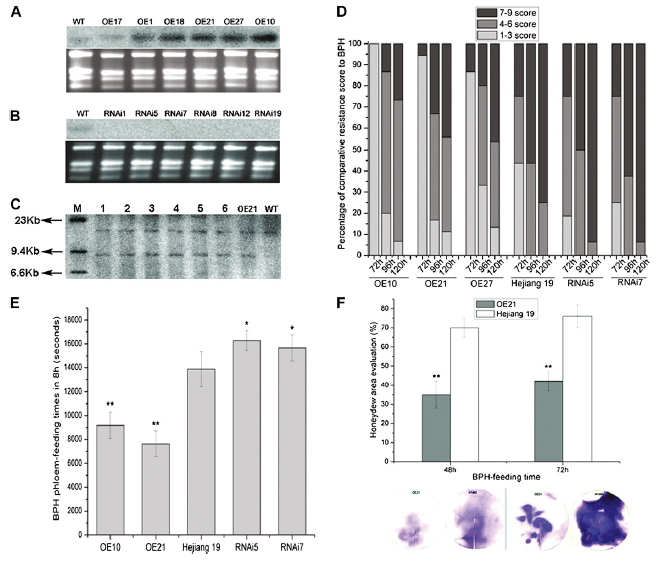
226 KB | WilliamE | Figure 1e. Northern- and Southern-blot analysis of Bphi008a in wild-type and transgenic plants, and evaluation of its contribution to resistance to the BPH. A, Bphi008a expression levels in normal wild-type (WT) and six T0 OE plants. OE17 was a three-copy | 1 |
| 08:12, 26 May 2014 | Figure 2.OsSRT1 RNAi induced H2O2 production and genomic DNA fragmentation.jpg (file) |  |
58 KB | Bzwangjie | 1 | |
| 08:08, 26 May 2014 | Fig.1w.png (file) |  |
226 KB | WilliamE | 2 | |
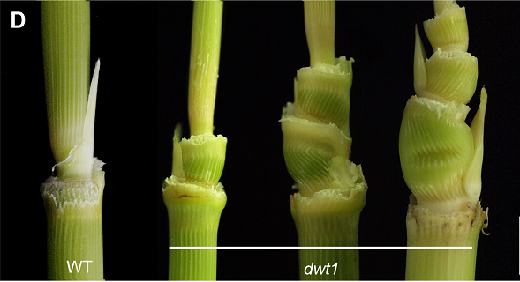
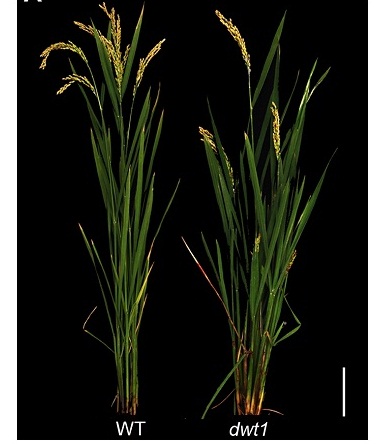
| 08:05, 26 May 2014 | Dwt1-4.jpg (file) |  |
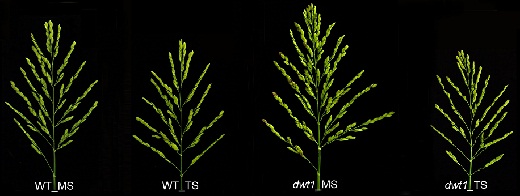
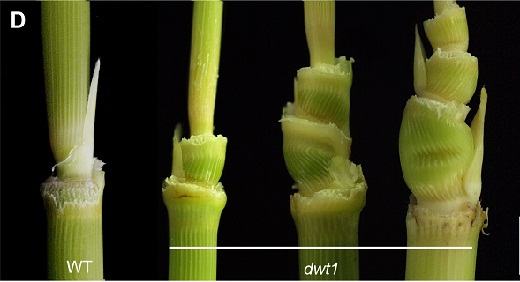
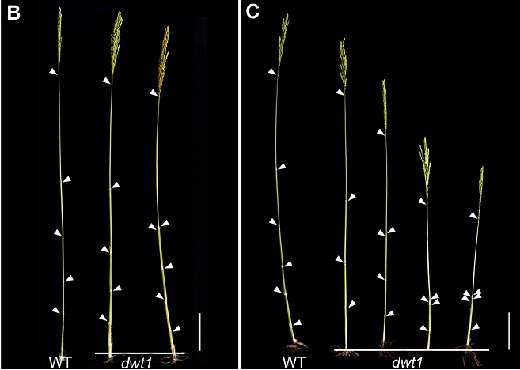
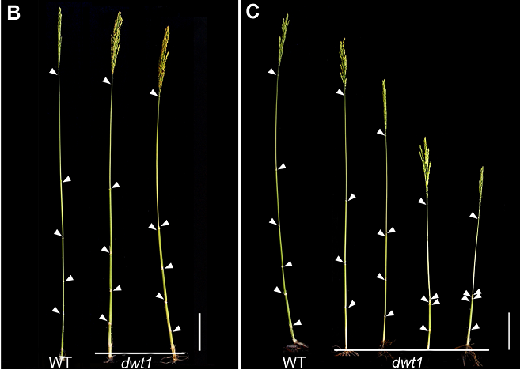
39 KB | Liying | 1 | |
| 08:05, 26 May 2014 | Dwt1-3.jpg (file) |  |
42 KB | Liying | 1 | |
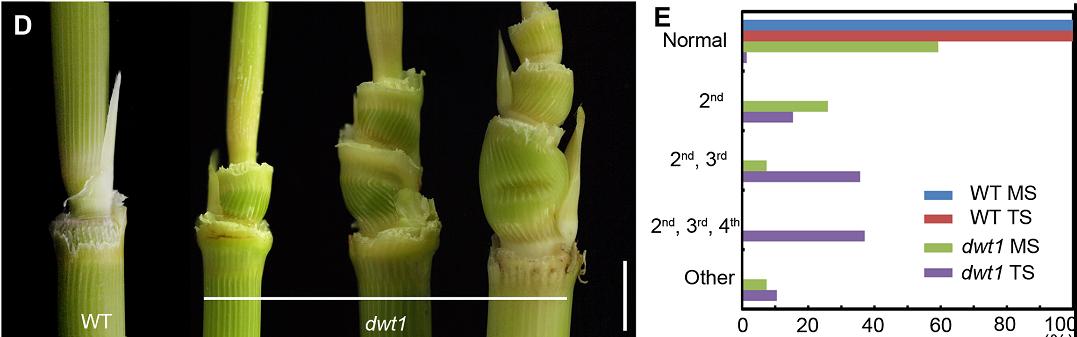
| 08:05, 26 May 2014 | Dwt1-2.jpg (file) |  |
34 KB | Liying | 1 | |
| 08:02, 26 May 2014 | Figure 2. OsSRT1 RNAi induced H2O2production and genomic DNA fragmentation.jpg (file) |  |
58 KB | Bzwangjie | 1 | |
| 07:47, 26 May 2014 | Fig3G.JPG (file) |  |
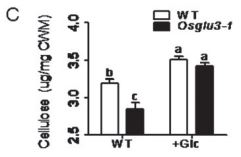
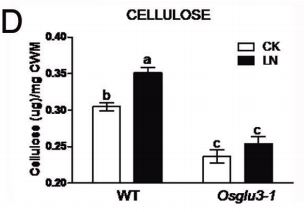
14 KB | Libaolian | Fig3G The crystalline cellulose content of Osglu3-1 was partly rescued in medium with 3% exogenous glucose. CK, medium without 3% exogenous glucose;+Glc, medium with 3% exogenous glucose; data are means of values from three independent experiments, each p | 1 |
| 07:46, 26 May 2014 | Dwt1-4.png (file) |  |
94 KB | Liying | 1 | |
| 07:45, 26 May 2014 | Fig3F.JPG (file) |  |
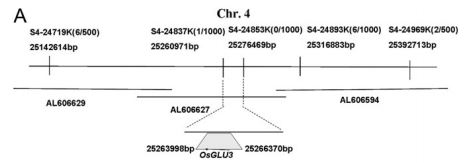
18 KB | Libaolian | Fig3F The Osglu3-1 locus was mapped to a 56-kb region on chromosome 4. The OsGLU3 gene is located on the BAC of AL606627. The number in brackets is the recombination rate. | 1 |
| 07:44, 26 May 2014 | Fig3E.JPG (file) |  |
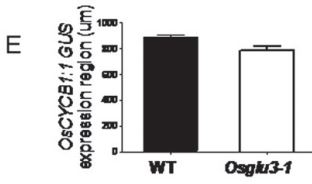
15 KB | Libaolian | The width of OsCYCB1;1:GUS expression region in Osglu3-1and WT.OsGLU3 for root elongation in rice at Gradu. | 1 |
| 07:44, 26 May 2014 | Dwt1-3.png (file) |  |
278 KB | Liying | 1 | |
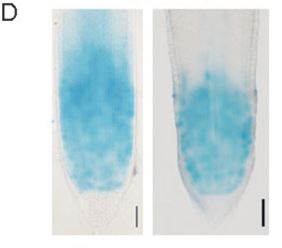
| 07:43, 26 May 2014 | Fig3D.JPG (file) |  |
14 KB | Libaolian | Fig3D OsCYCB1,1–GUS activity in primary root tip of 5-day-old wild-type (left) andOsglu3-1(right) by histochemicalGUS-staining. Bar = 200μm. | 1 |
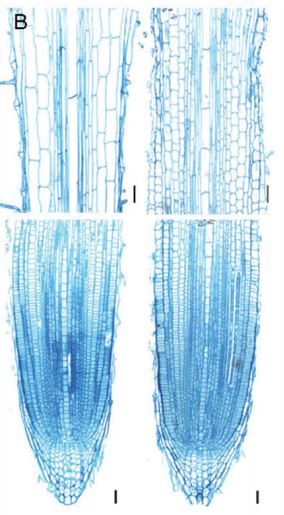
| 07:42, 26 May 2014 | Fig3B.JPG (file) |  |
40 KB | Libaolian | Fig3B Longitudinal sections of root tip and maturation zone of wild-type (left) andOsglu3-1(right). Bar = 50μm. | 1 |
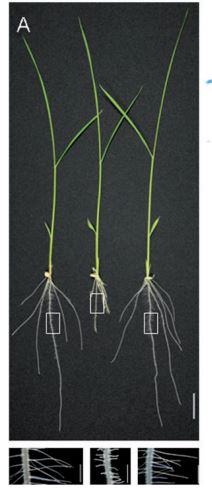
| 07:40, 26 May 2014 | Fig3A.JPG (file) |  |
24 KB | Libaolian | Fig3A Seedlings of wild-type (left),Osglu3-1(middle), andOsglu3-1transformed with wholeOsGLU3gene (right). Bar = 2 cm. Bottom figures are enlargements of the lateral roots in rectangles. Bar = 200lm. | 1 |
| 07:39, 26 May 2014 | Fig1D.JPG (file) |  |
17 KB | Libaolian | Fig1D The root crystalline cellulose (TFA-insoluble) content of Osglu3-1was not obviously changed under nitrogen starvation. Data are mean values from three independent experiments, each performed in triplicate. Error bars represent standard error (SE). | 2 |
| 07:38, 26 May 2014 | Dwt1-2.png (file) |  |
62 KB | Liying | 1 | |
| 07:38, 26 May 2014 | Fig1C.JPG (file) |  |
16 KB | Libaolian | Reverted to version as of 06:51, 26 May 2014 | 3 |
| 07:37, 26 May 2014 | Fig 1A.JPG (file) |  |
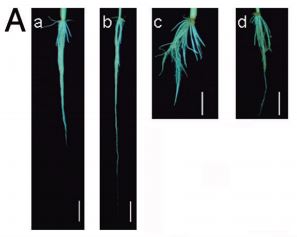
16 KB | Libaolian | Fig 1A Nitrogen starvation induces root elongation in an OsGLU3 dependant way in rice. (A) The phenotype of WT (SSBM) and Osglu3-1under nitrogen-starvation. a, WT under control condition; b, WT under nitrogen starvation; c, Osglu3-1under control conditio | 1 |
| 07:26, 26 May 2014 | Dwt1.jpg (file) |  |
42 KB | Liying | 1 | |
| 07:26, 26 May 2014 | Figure 1.OsSRT1 RNAi induced a lesion mimic phenotype.jpg (file) |  |
64 KB | Bzwangjie | Figure_1.OsSRT1_RNAi_induced_a_lesion_mimic_phenotype.jpg | 4 |
| 06:55, 26 May 2014 | Figure1E.JPG (file) |  |
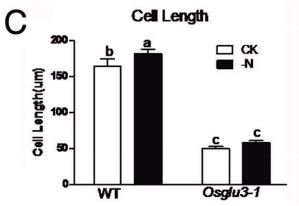
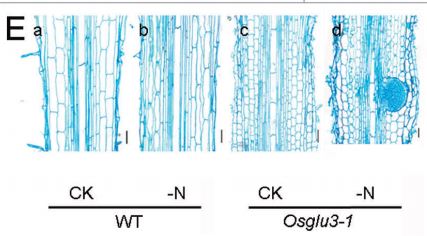
30 KB | Libaolian | (Figure1 E) Nitrogen starvation could not induce the cell elongation in Osglu3-1. Bar = 50μm. | 1 |
| 06:51, 26 May 2014 | Figure 1. OsSRT1 RNAi induced a lesion mimic phenotype.jpg (file) |  |
64 KB | Bzwangjie | A, An OsSRT1RNAi seedling at two-leafstage (right) comparedto awild-type plant at the same age (left), showing that the development of lesions affected the growth. Bar 5 3 cm. B, Enlargedview of the RNAi plants in A. Bar 5 0.6 cm. C, An OsSRT1 RNAi plant | 1 |
| 06:48, 26 May 2014 | Figure 1A.JPG (file) |  |
12 KB | Libaolian | Nitrogen starvation induces root elongation in an OsGLU3 dependant way in rice. (A) The phenotype of WT (SSBM) and Osglu3-1under nitrogen-starvation. a, WT under control condition; b, WT under nitrogen starvation; c, Osglu3-1 (mutant)under control con | 1 |
| 04:55, 26 May 2014 | 2A 2B.png (file) |  |
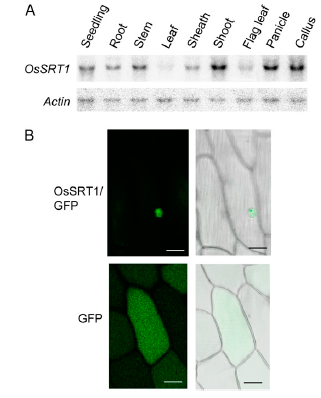
75 KB | Nicole | Figure 2. Expression profiles of OsSRT1. A, Northern hybridization was inserted in an overexpression vector under the detection of OsSRT1 mRNA in different rice tissues or developmental stages. Actin transcripts were detected as controls. B, Nuclear local | 1 |
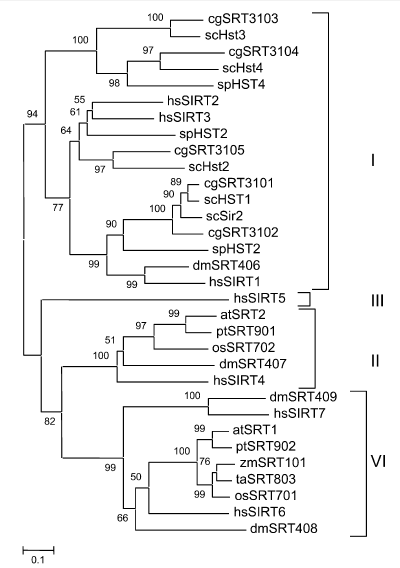
| 04:47, 26 May 2014 | 1A.png (file) |  |
45 KB | Nicole | Figure 1A. Neighbor-joining tree of SIR2-related proteins fromeukaryotes. Abbreviations are as follows (in parentheses): Arabidopsis (at), Caenorhabditis elegans (ce), Drosophila melanogaster (dm), Homo sapiens (hs), rice (os), Saccharomyces cerevisiae (s | 1 |
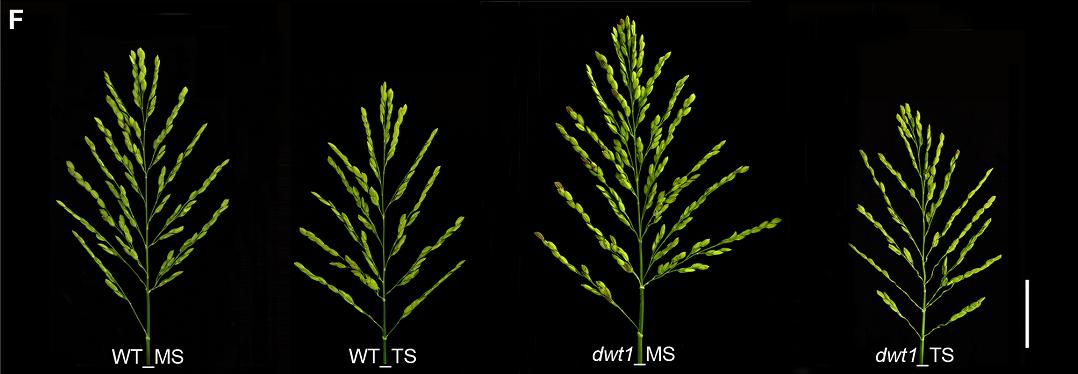
| 04:27, 26 May 2014 | 驻穗对比.JPG (file) |  |
49 KB | Canghai91 | 1 | |
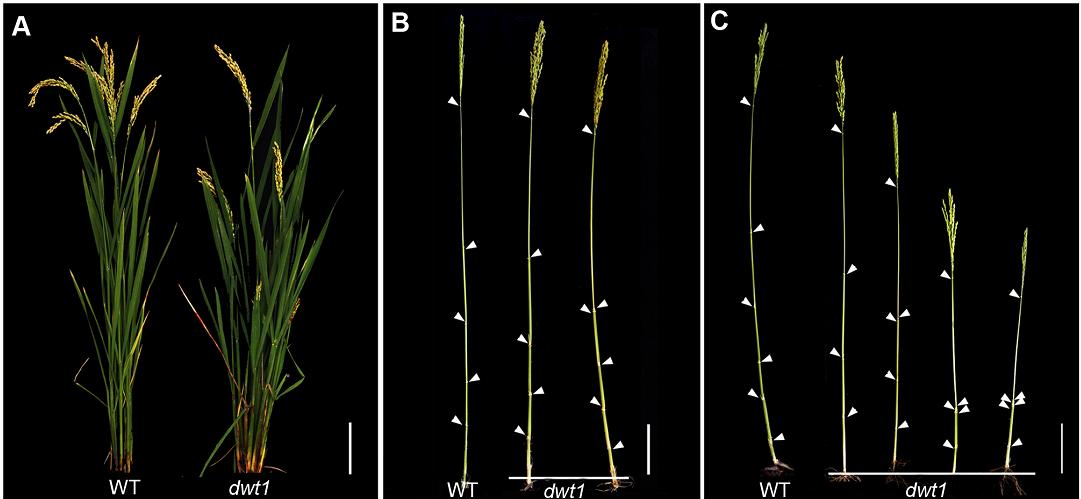
| 04:27, 26 May 2014 | 茎秆对比.JPG (file) |  |
41 KB | Canghai91 | 1 | |
| 04:27, 26 May 2014 | 矮化基因作用.JPG (file) |  |
53 KB | Canghai91 | 1 | |
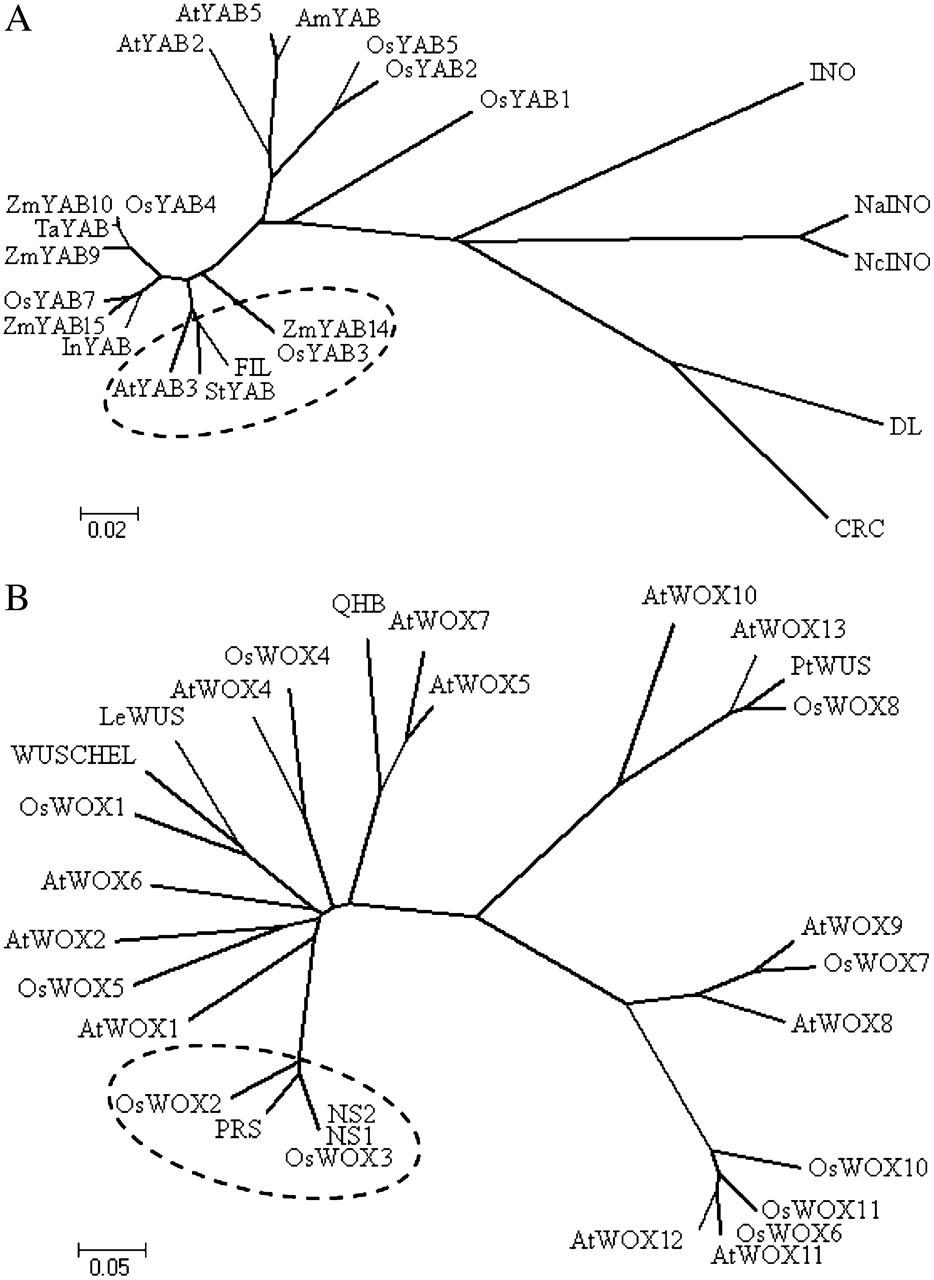
| 03:45, 26 May 2014 | Figure 1. Phylogeny analysis of YABBY and WOX families.jpg (file) |  |
116 KB | Ypyabby | Neighborjoining trees of YABBY (A) and WOX (B) proteins from rice (Os), Arabidopsis (At), Antirrhinum majus (Am), maize (Zm), Triticum aestivum (Ta), Solanum tuberosum (St), Ipomoea nil (In), Nymphaea alba (Na), Nymphaea colorata (Nc), and Solanum Nycoper | 1 |
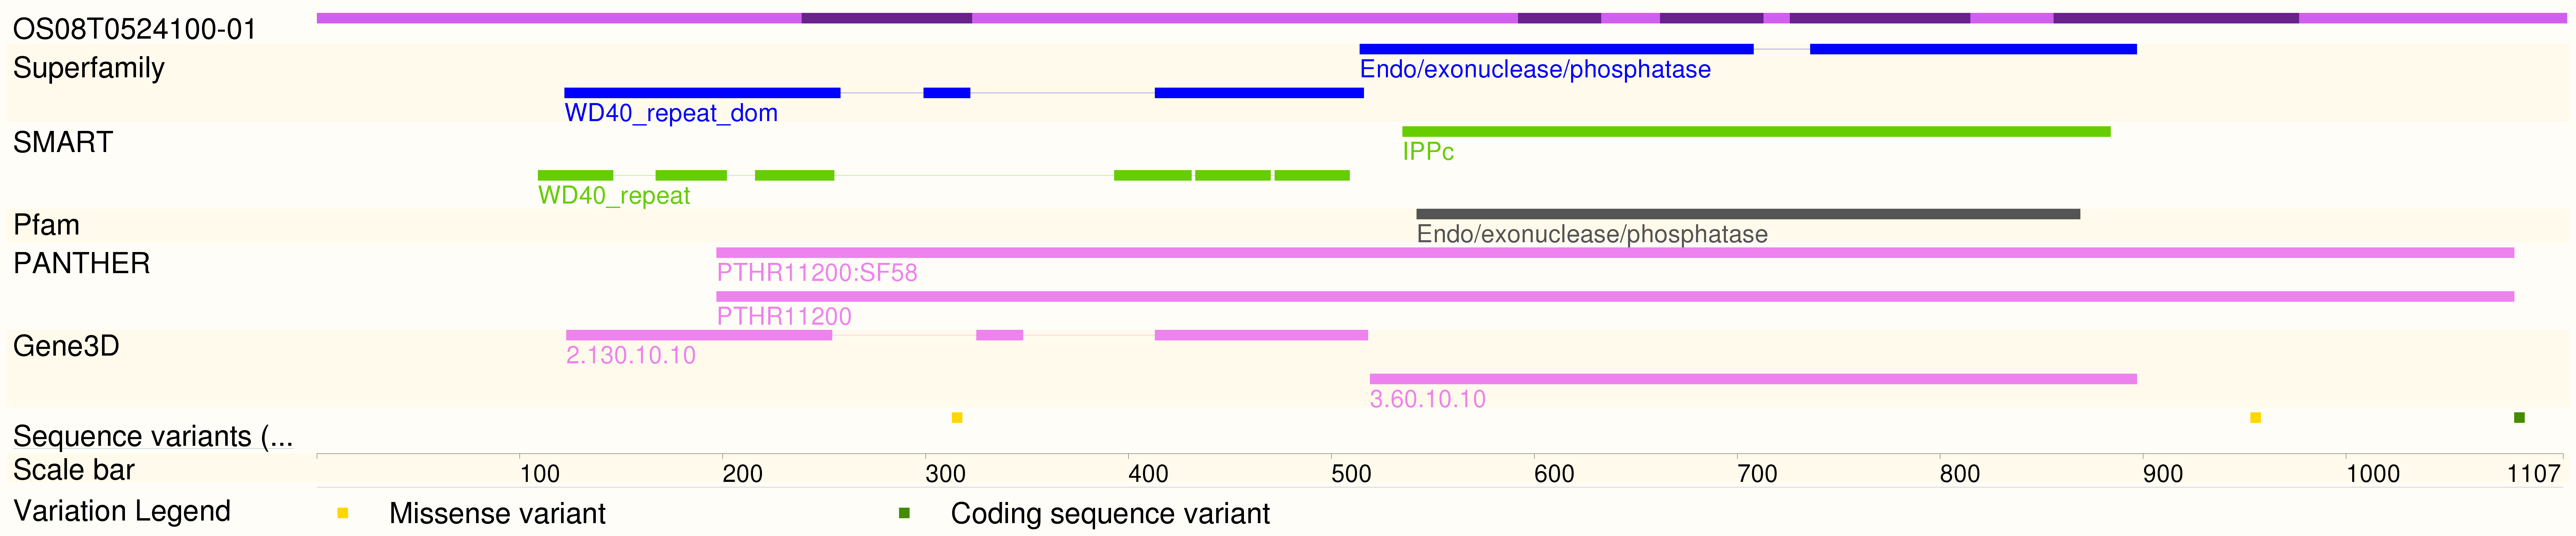
| 02:46, 26 May 2014 | ProteinSummary-75-OS08T0524100-01-10.png (file) | Error creating thumbnail: File with dimensions greater than 12.5 MP |
323 KB | Nicole | this picture is about the protein sequence of this gene. | 1 |
| 02:33, 26 May 2014 | Fig.1.docx (file) |  |
98 KB | Dangxx | 1 | |
| 02:26, 26 May 2014 | QQ截图20140526101312.png (file) |  |
54 KB | Xiaoboy8888 | 1 | |
| 17:18, 25 May 2014 | Fig6.jpg (file) |  |
24 KB | ChenYusheng | 1 |