File list
This special page shows all uploaded files.
| Date | Name | Thumbnail | Size | User | Description | Versions |
|---|---|---|---|---|---|---|
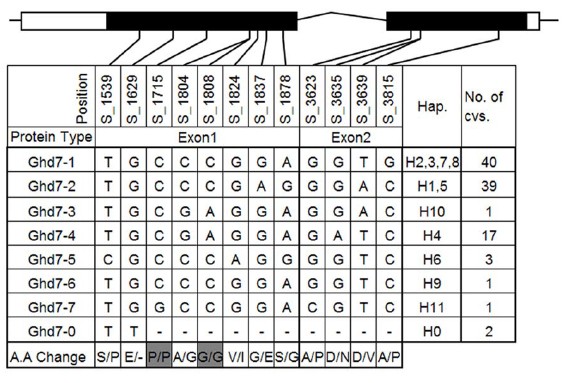
| 04:13, 31 May 2014 | Figure 3. Protein diversity of Ghd7.jpg (file) |  |
77 KB | Lily | The two exons (indicated in black rectangle) and the 59 and 39 UTRs (indicated in white rectangle) of Ghd7 are shown in graphics on the top. The first row indicates the position of the SNPs, the last row reveals the amino acid change. Gray indicates synon | 2 |
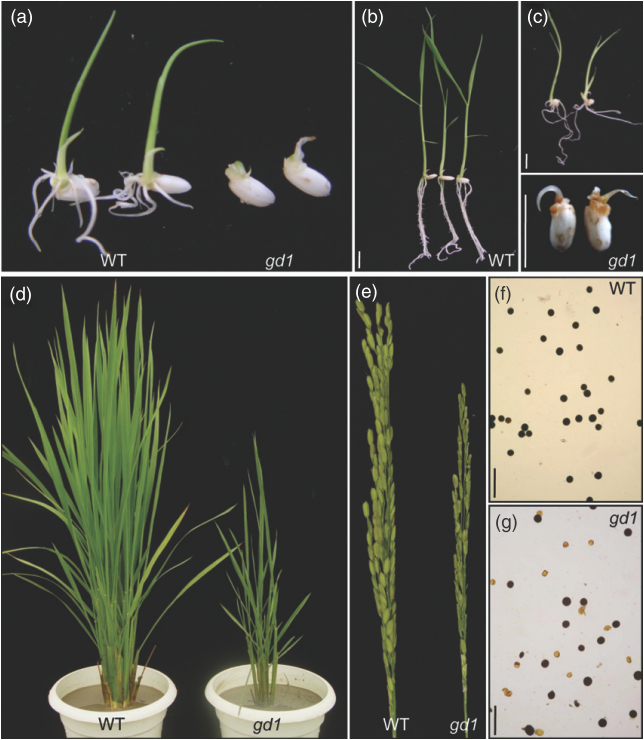
| 03:22, 31 May 2014 | Shijc-Fig5.jpg (file) |  |
357 KB | Shijc | Phenotype of the rice gd1 mutant. | 1 |
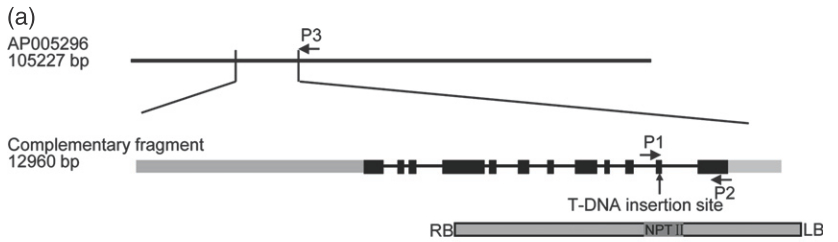
| 03:21, 31 May 2014 | Shijc-Fig4.jpg (file) |  |
55 KB | Shijc | Genomic DNA fragment used for complementation. | 1 |
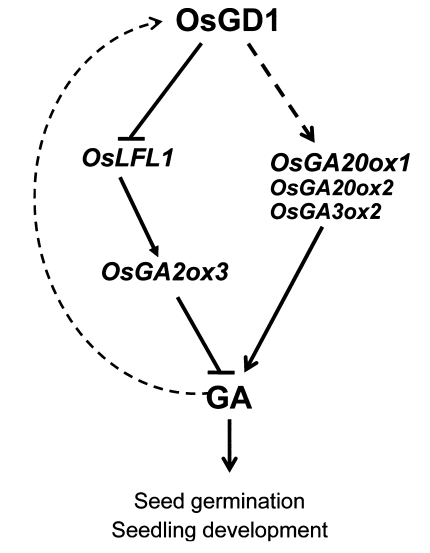
| 03:18, 31 May 2014 | Shijc-Fig3.jpg (file) |  |
61 KB | Shijc | Proposed model for GD1-regulated GA homeostasis. | 1 |
| 03:16, 31 May 2014 | Unfigure 6 .jpg (file) |  |
68 KB | Tangfeng13 | Reverted to version as of 03:13, 31 May 2014 | 4 |
| 03:12, 31 May 2014 | Figure 8 .jpg (file) |  |
79 KB | Tangfeng13 | 1 | |
| 03:11, 31 May 2014 | Figure 7 .jpg (file) |  |
53 KB | Tangfeng13 | 1 | |
| 03:11, 31 May 2014 | Figure 5 .jpg (file) |  |
81 KB | Tangfeng13 | 1 | |
| 03:11, 31 May 2014 | Figure 4 .jpg (file) |  |
70 KB | Tangfeng13 | 1 | |
| 03:10, 31 May 2014 | Figure 3 .jpg (file) |  |
73 KB | Tangfeng13 | 1 | |
| 03:09, 31 May 2014 | Figure 2 .jpg (file) |  |
43 KB | Tangfeng13 | 1 | |
| 02:53, 31 May 2014 | FigureS4.jpg (file) |  |
1.93 MB | Zhangziliang | The adding nucleotides at the downstream of Tos17-insertion position are indicated by red color | 1 |
| 02:52, 31 May 2014 | FigureS3.jpg (file) |  |
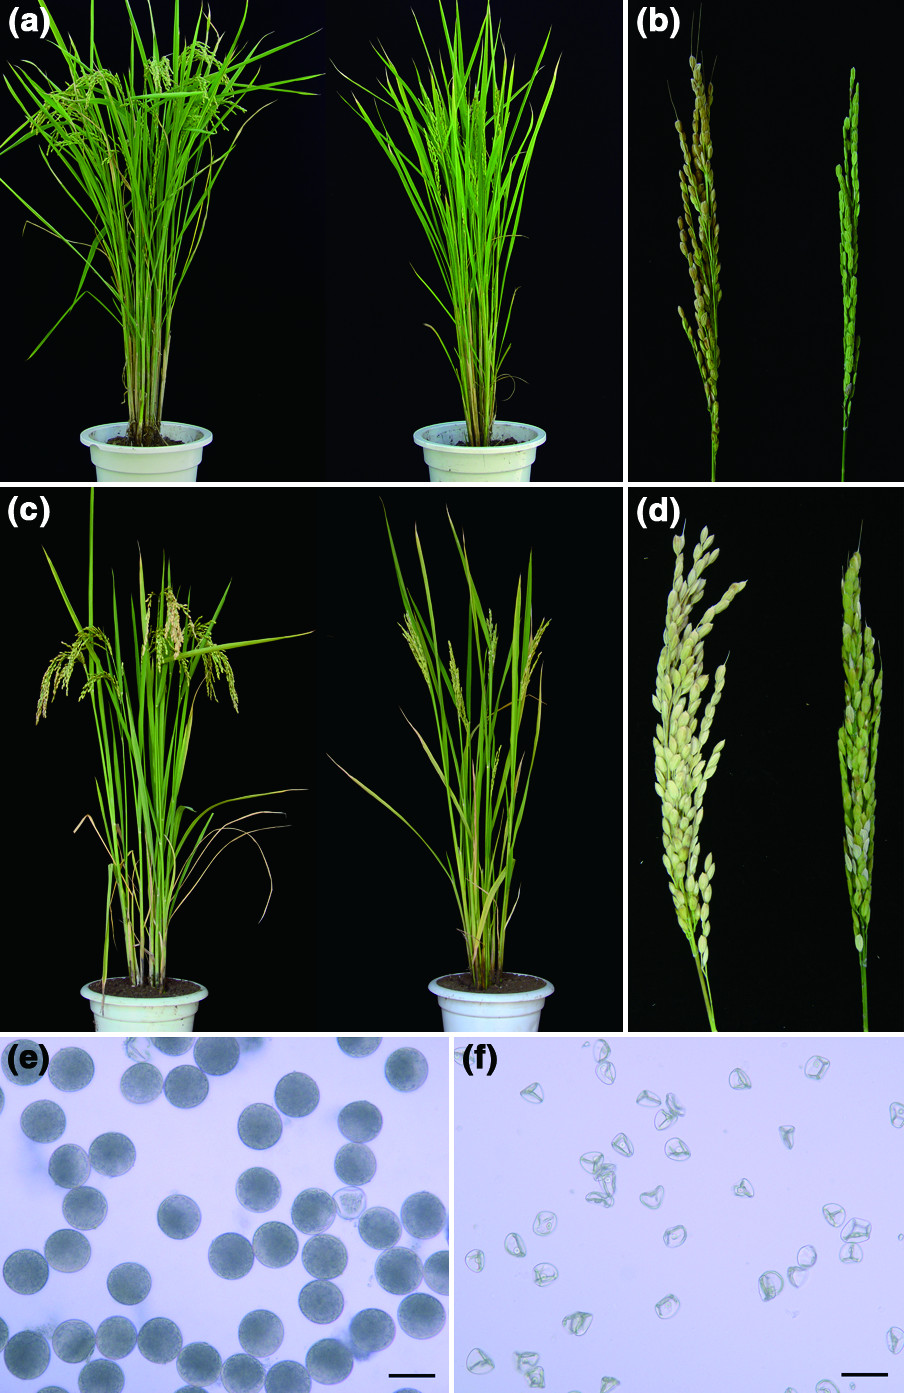
329 KB | Zhangziliang | (a) Comparison of the wild-type plant (left, Nipponbare) and the Ossgo1-1 mutant plant (right). (b) Comparison of the wild-type panicle (left, Nipponbare) and the Ossgo1-1 panicle (right). (c) Comparison of the wild-type plant (left, Yandao 8) and the Oss | 1 |
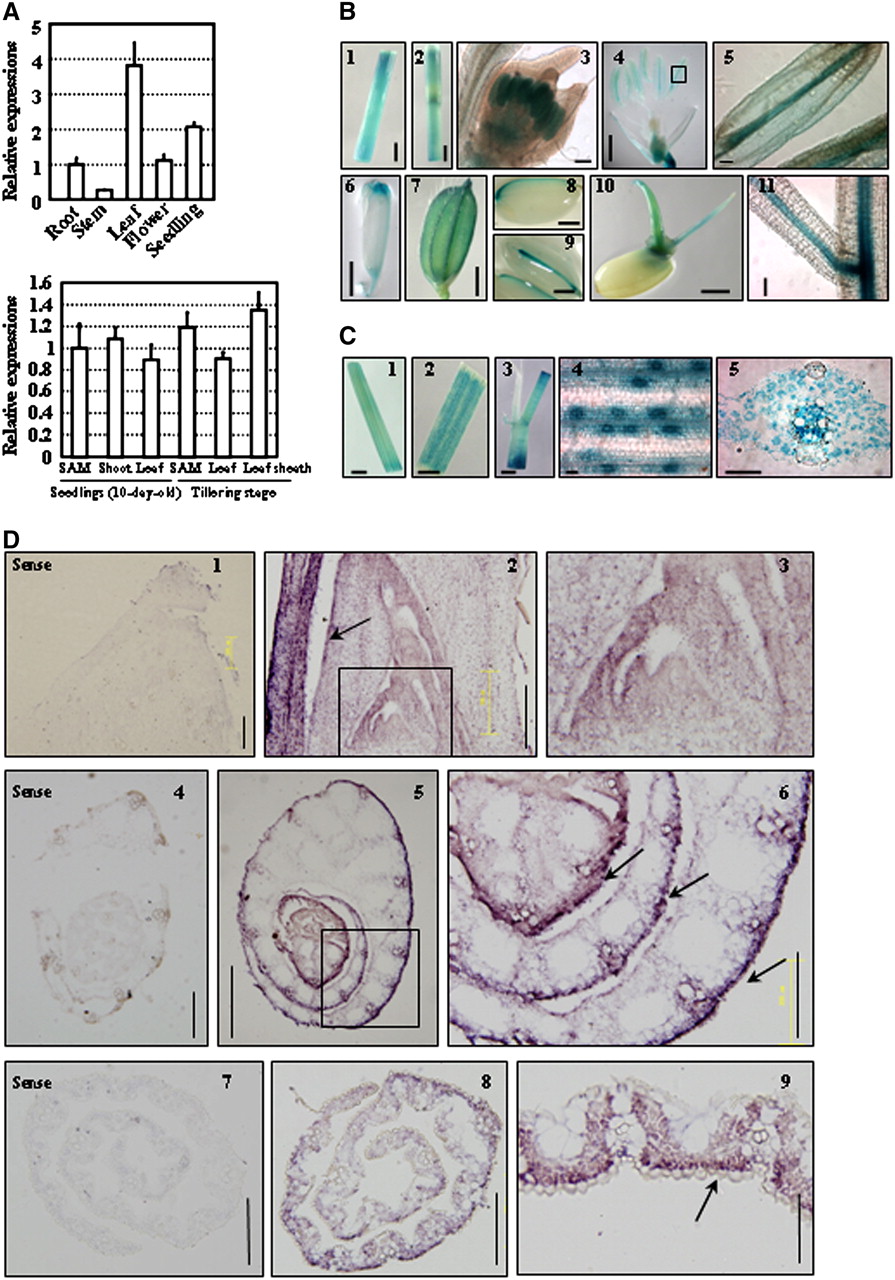
| 02:50, 31 May 2014 | FigureS2.jpg (file) |  |
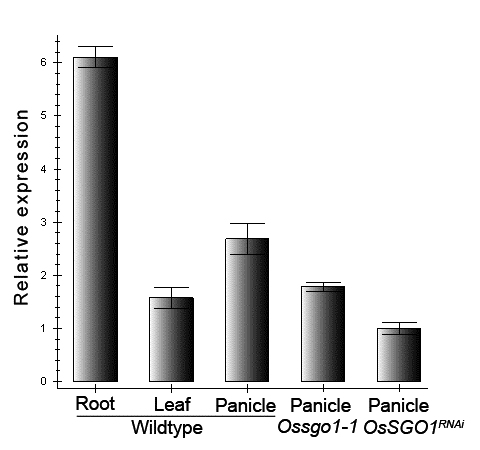
52 KB | Zhangziliang | Transcription levels of OsSGO1 in various tissues by Real-Time RT-PCR. Ubiquitin is used as endogenous control. Error bars represent SD (n=3). | 1 |
| 02:46, 31 May 2014 | Figure S1.jpg (file) |  |
108 KB | Zhangziliang | Exons are represented by black boxes and untranslated regions are shown in white. The triangles indicate mutation positions in the two alleles. | 1 |
| 02:35, 31 May 2014 | FigureS4.tiff (file) |  |
3.06 MB | Zhangziliang | (a) Comparison of the wild-type plant (left, Nipponbare) and the Ossgo1-1 mutant plant (right). (b) Comparison of the wild-type panicle (left, Nipponbare) and the Ossgo1-1 panicle (right). (c) Comparison of the wild-type plant (left, Yandao 8) and the Oss | 1 |
| 02:31, 31 May 2014 | Figure 1.tiff (file) | |
46 KB | Zhangziliang | Exons are represented by black boxes and untranslated regions are shown in white. The triangles indicate mutation positions in the two alleles. | 1 |
| 02:25, 31 May 2014 | FigureS3.tiff (file) | |
233 KB | Zhangziliang | Transcription levels of OsSGO1 in various tissues by Real-Time RT-PCR. Ubiquitin is used as endogenous control. Error bars represent SD (n=3) | 1 |
| 02:22, 31 May 2014 | Figure S3.tiff (file) | |
233 KB | Zhangziliang | Transcription levels of OsSGO1 in various tissues by Real-Time RT-PCR. Ubiquitin is used as endogenous control. Error bars represent SD (n=3) | 1 |
| 02:13, 31 May 2014 | Figure S1.tiff (file) | |
46 KB | Zhangziliang | Exons are represented by black boxes and untranslated regions are shown in white. The triangles indicate mutation positions in the two alleles | 2 |
| 02:05, 31 May 2014 | FigureS1.tiff (file) | |
46 KB | Zhangziliang | Exons are represented by black boxes and untranslated regions are shown in white. The triangles indicate mutation positions in the two alleles | 1 |
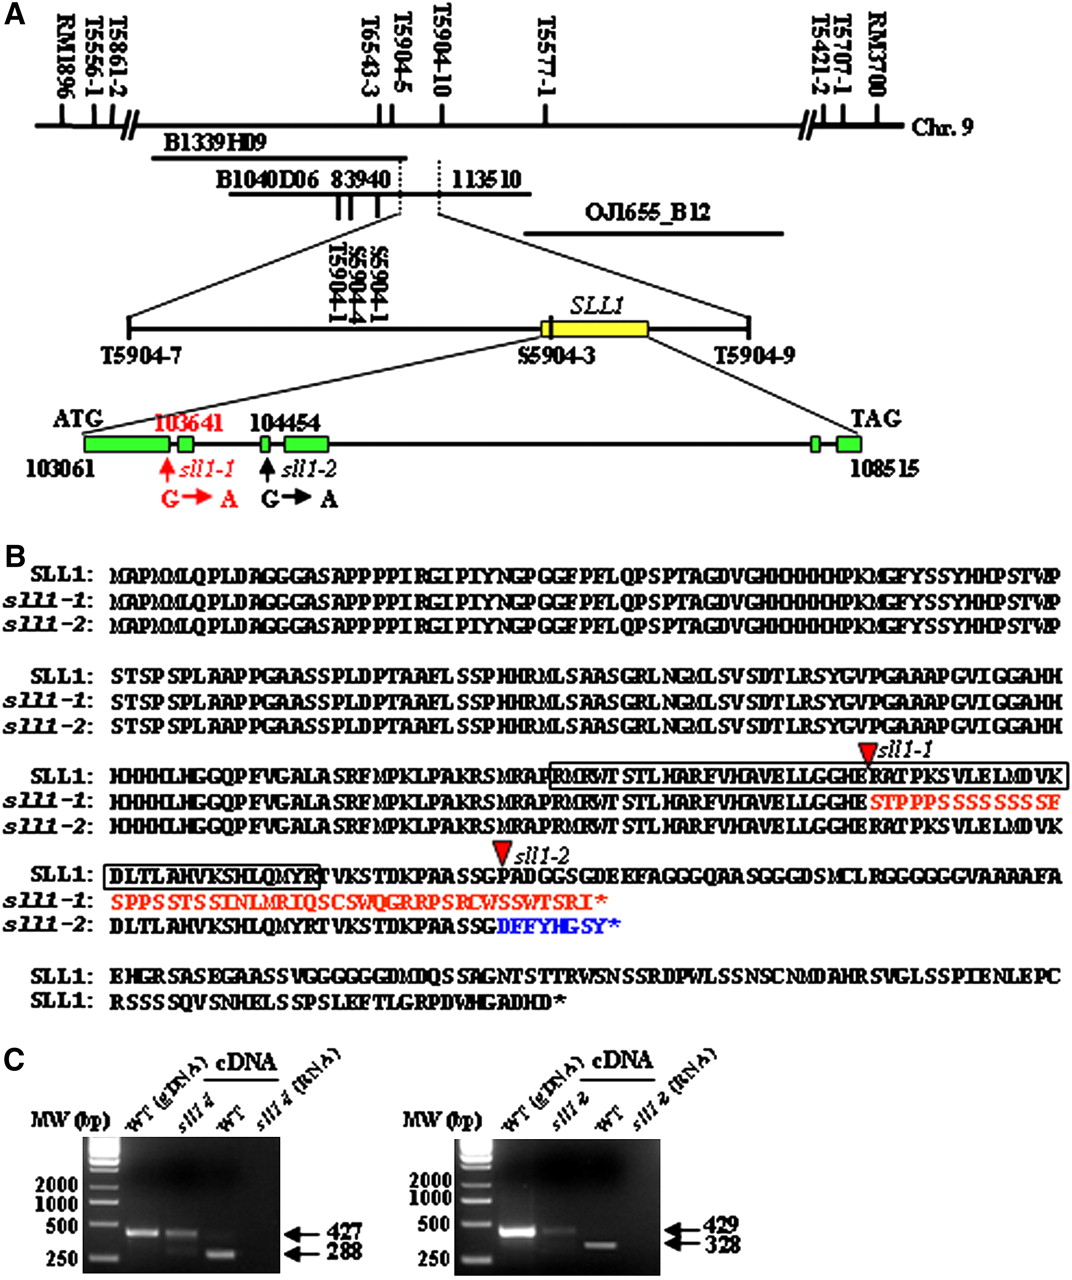
| 02:01, 31 May 2014 | Figure S1. Schematic representation of OsSGO1 gene.tiff (file) | |
46 KB | Zhangziliang | Exons are represented by black boxes and untranslated regions are shown in white. The triangles indicate mutation positions in the two alleles | 1 |
| 16:28, 30 May 2014 | 12345.jpg (file) |  |
257 KB | Siatchenqing | 1 | |
| 16:22, 30 May 2014 | 654321.jpg (file) |  |
362 KB | Siatchenqing | 1 | |
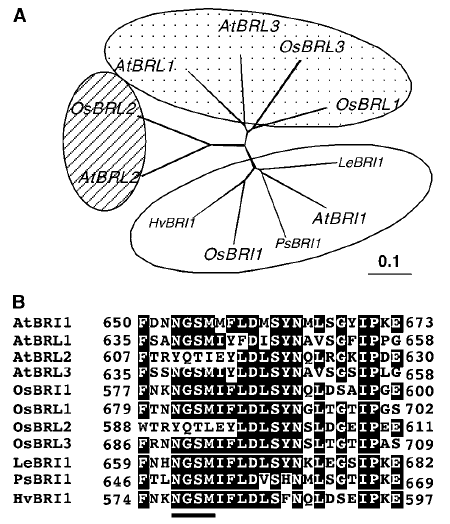
| 15:03, 30 May 2014 | The rice genes homologous to OsBRI1.png (file) |  |
41 KB | Wangxf09sk | 2 | |
| 13:29, 30 May 2014 | Figure 1 .jpg (file) |  |
79 KB | Tangfeng13 | 1 | |
| 11:49, 30 May 2014 | ZhangF10.jpg (file) |  |
176 KB | Chenyaping | 1 | |
| 11:48, 30 May 2014 | ZhangF8.jpg (file) |  |
200 KB | Chenyaping | 1 | |
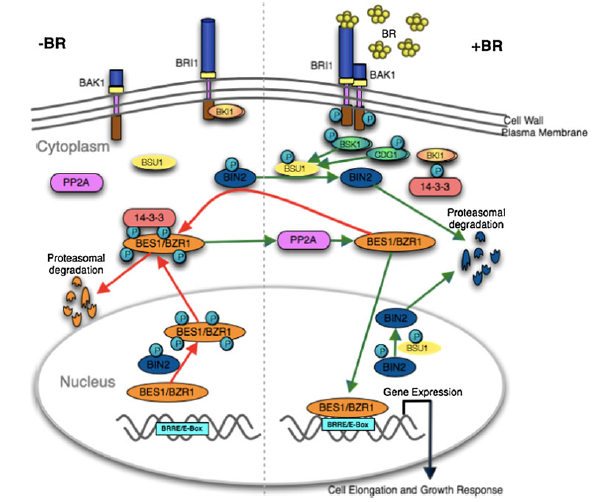
| 11:35, 30 May 2014 | Brassinosteroid signaling pathway.png (file) |  |
241 KB | Wangxf09sk | Brassinosteroid_signaling_pathway | 1 |
| 11:33, 30 May 2014 | ZhangF3.jpg (file) |  |
284 KB | Chenyaping | 1 | |
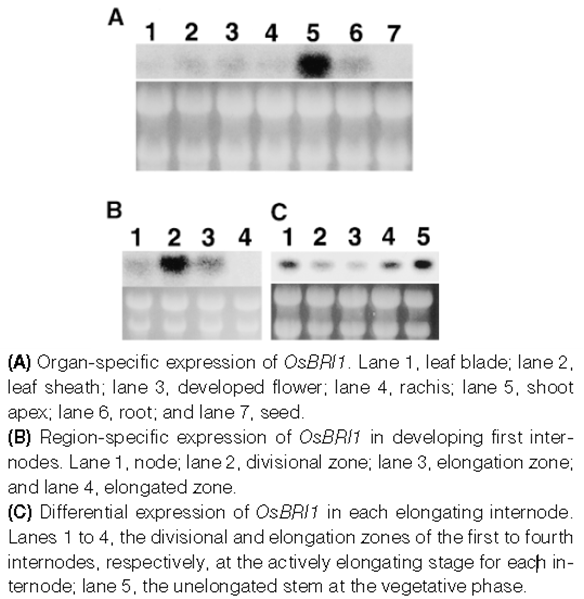
| 10:48, 30 May 2014 | Expression Pattern of OsBRI1 in Various Organs.png (file) |  |
164 KB | Wangxf09sk | Expression_Pattern_of_OsBRI1_in_Various_Organs | 1 |
| 10:17, 30 May 2014 | ZhangF5.jpg (file) |  |
259 KB | Chenyaping | 1 | |
| 09:57, 30 May 2014 | ZhangF2.jpg (file) |  |
213 KB | 124.207.122.38 | 1 | |
| 09:57, 30 May 2014 | ZhangF1.jpg (file) |  |
301 KB | 124.207.122.38 | 1 | |
| 08:18, 30 May 2014 | The process.jpg (file) |  |
79 KB | Alison | 1 | |
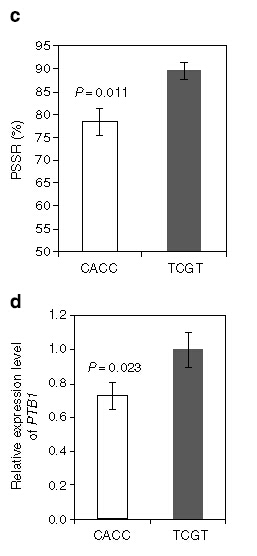
| 08:18, 30 May 2014 | The relationship between PSSR and PBT1 in abnormal temperature.jpg (file) |  |
187 KB | Alison | 1 | |
| 08:16, 30 May 2014 | T-test.jpg (file) |  |
42 KB | Alison | 1 | |
| 07:10, 30 May 2014 | Real-time reverse-transcription (RT) PCR analysis for the expression of OsMYB2 in rice.jpg (file) | _PCR_analysis_for_the_expression_of_OsMYB2_in_rice.jpg) |
68 KB | Liuq036 | (A and B) Time course of OsMYB2 expression during salt (A) and cold and PEG (B) treatments. (C) Expression of OsMYB2 under various hormone treatments. (D) Expression of OsMYB2 in different tissues. Total RNAs were prepared from 14-d-old seedlings of wild- | 1 |
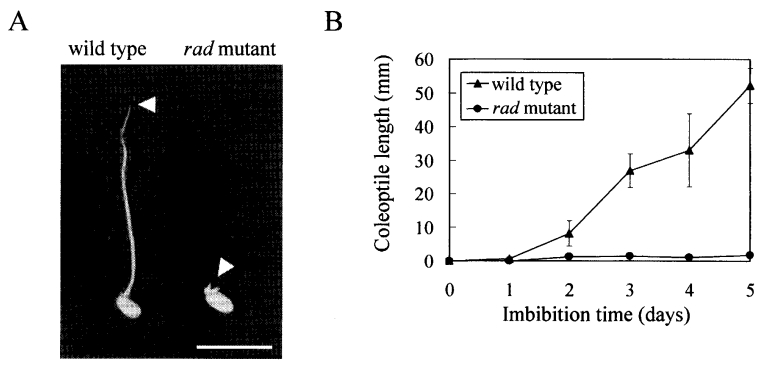
| 05:38, 30 May 2014 | Shijc-Fig2.jpg (file) |  |
88 KB | Shijc | Comparison of coleoptiles of wild type rice and the rad mutant. | 1 |
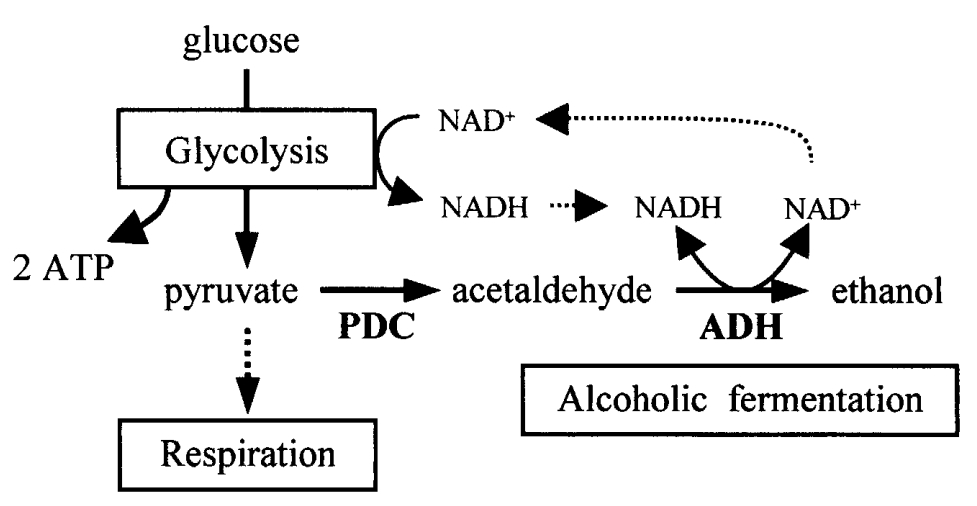
| 05:37, 30 May 2014 | Shijc-Fig1.jpg (file) |  |
121 KB | Shijc | Diagram of alcoholic fermentation pathway in plants. | 1 |
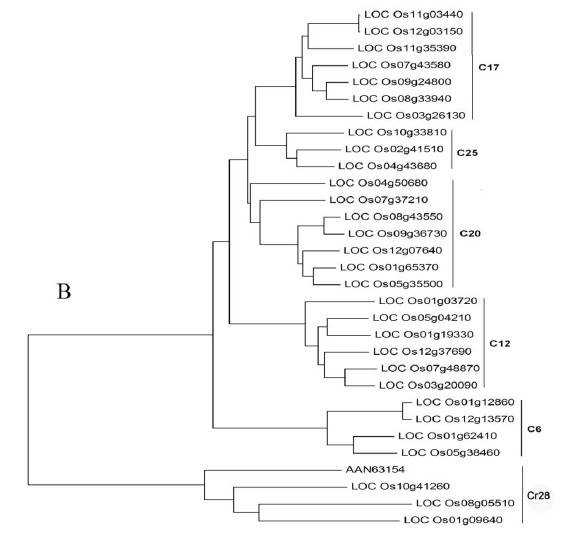
| 05:33, 30 May 2014 | Phylogenetic tree of MYB proteins.jpg (file) |  |
49 KB | Liuq036 | The tree was constructed with the DNAMAN tree program with full-length amino acid sequences downloaded from TIGR (http://www.tigr.org) and NCBI (www.ncbi.nlm.nih.gov). The locus of OsMYB2 is LOC_Os3g20090. | 1 |
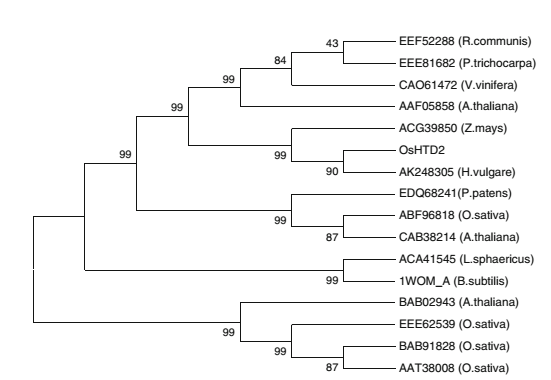
| 05:20, 30 May 2014 | Phylogenetic tree of HTD2 and its homologous proteins.png (file) |  |
35 KB | Gaojin | 1 | |
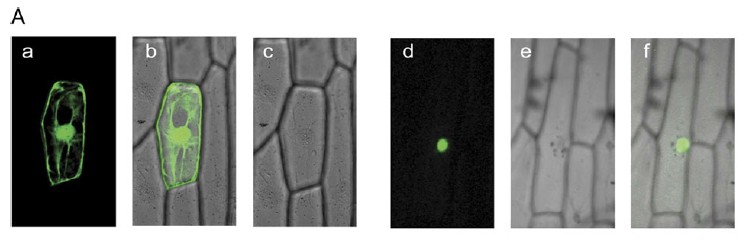
| 05:20, 30 May 2014 | Subcellular localization of OsMYB2.jpg (file) |  |
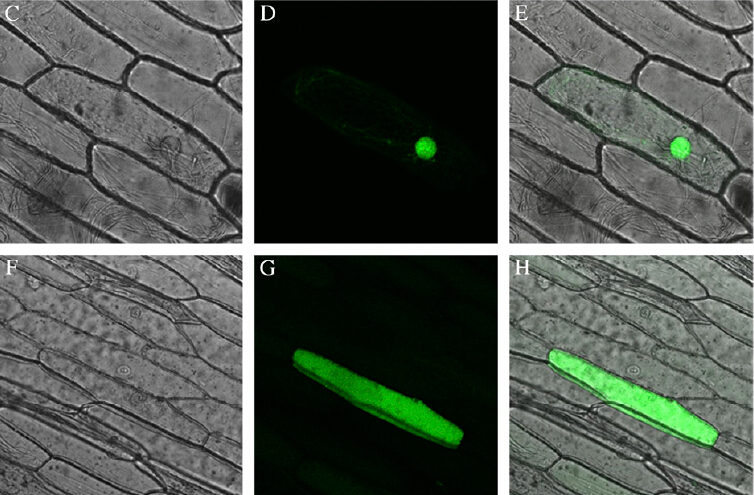
33 KB | Liuq036 | Confocal images of onion epidermis cells under the GFP channel showing the constitutive localization of GFP (a) and nuclear localization of OsMYB2-GFP (d). The confocal images (b and e) are of the same cells in (a) and (d) with transmitted light. The merg | 1 |
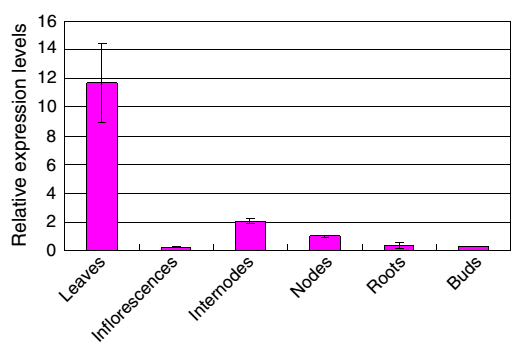
| 05:13, 30 May 2014 | Real-time PCR analysis of HTD2transcript levels in different issures.png (file) |  |
18 KB | Gaojin | 1 | |
| 04:50, 30 May 2014 | Effect of salt stress on contents of oxidants (A and B) and antioxidant enzymes (C–D) in wild-type and transgenic rice plants.jpg (file) | _and_antioxidant_enzymes_(C%E2%80%93D)_in_wild-type_and_transgenic_rice_plants.jpg) |
36 KB | Liuq036 | (A and B) Plants were exposed to 200 mM NaCl for 2 days before determination of H2O2 (A) and malondialdehyde (MDA) (B). (C–E) were exposed to 200 mM NaCl for 24 hours and before determination of peroxidase (POD; C), superoxide dismutase (SOD; D), and ca | 1 |
| 04:05, 30 May 2014 | YoshidaF5.jpg (file) |  |
188 KB | Chenyaping | 1 | |
| 04:05, 30 May 2014 | YoshidaF4.jpg (file) |  |
202 KB | Chenyaping | 1 | |
| 04:05, 30 May 2014 | YoshidaF3.jpg (file) |  |
290 KB | Chenyaping | 1 | |
| 04:04, 30 May 2014 | YoshidaF2.jpg (file) |  |
162 KB | Chenyaping | 1 | |
| 04:03, 30 May 2014 | Figure 7.png (file) |  |
36 KB | WangT | 1 |