File:Fig.2w.png
Revision as of 08:16, 26 May 2014 by WilliamE (talk | contribs) (Figure 2w. OsMPK5, OsMPK12, OsMPK13, and OsMPK17 expression patterns in transgenic and wild-type plants after the BPH had been feeding for between 0 and 96 h. Corresponding Bphi008a expression levels in transgenic and wild-type plants are shown in Supplem)
No higher resolution available.
Fig.2w.png (714 × 577 pixels, file size: 111 KB, MIME type: image/png)
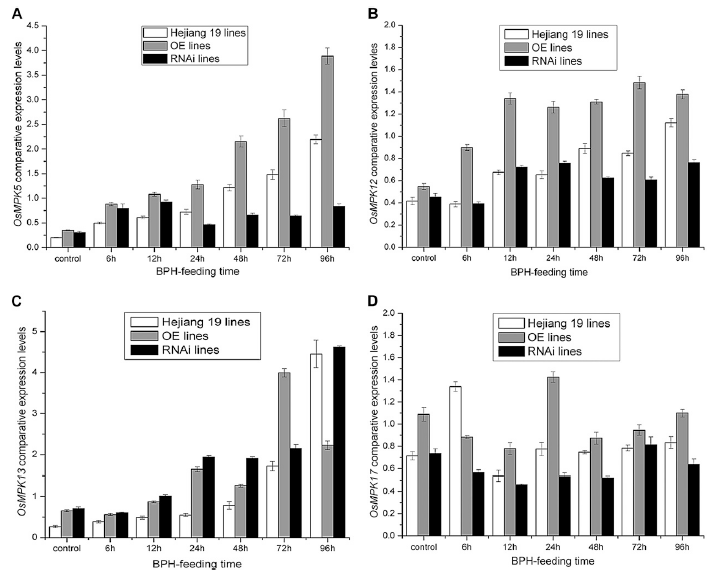
Figure 2w. OsMPK5, OsMPK12, OsMPK13, and OsMPK17 expression patterns in transgenic and wild-type plants after the BPH had been feeding for between 0 and 96 h. Corresponding Bphi008a expression levels in transgenic and wild-type plants are shown in Supplemental Figure S4.
File history
Click on a date/time to view the file as it appeared at that time.
| Date/Time | Thumbnail | Dimensions | User | Comment | |
|---|---|---|---|---|---|
| current | 08:16, 26 May 2014 | | 714 × 577 (111 KB) | WilliamE (talk | contribs) | Figure 2w. OsMPK5, OsMPK12, OsMPK13, and OsMPK17 expression patterns in transgenic and wild-type plants after the BPH had been feeding for between 0 and 96 h. Corresponding Bphi008a expression levels in transgenic and wild-type plants are shown in Supplem |
- You cannot overwrite this file.
File usage
There are no pages that link to this file.


