File:Rice1.png
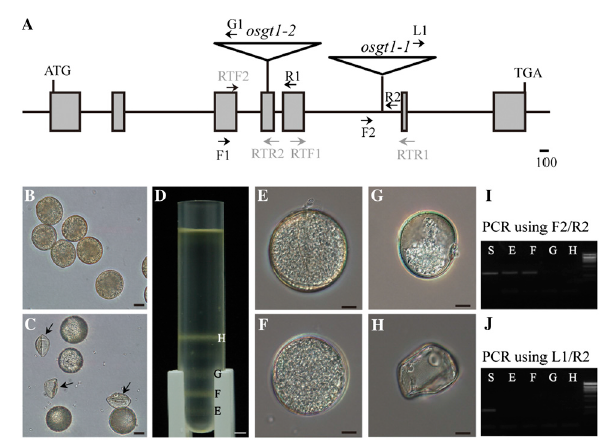
Figure 1. Schematic diagrams of OsGT1 and aberrant pollen phenotype in osgt1 mutant. A, T-DNA insertion positions. Start and stop codons are represented as ATG and TGA, respectively; positions of insertion are shown with triangles. Shaded boxes indicate exons; lines connecting exons are introns. Primers for genotyping and expression analysis are marked with arrows. Scale bar = 100 nucleotides. B and C, Pollen grains from wild-type (B) and OsGT1/osgt1-1 (C) anthers. Bars = 20 mm. D, Defective pollen was separated from normal grains through Suc density gradient centrifugation. Bar = 500 mm. E to H, Representative pollen from each band. Bars = 10 mm. I, PCR products by two OsGT1 primers. J, PCR products by OsGT1 primer and T-DNA primer. [See online article for color version of this figure.]
File history
Click on a date/time to view the file as it appeared at that time.
| Date/Time | Thumbnail | Dimensions | User | Comment | |
|---|---|---|---|---|---|
| current | 04:43, 4 June 2014 | | 608 × 445 (208 KB) | Tracy (talk | contribs) | Figure 1. Schematic diagrams of OsGT1 and aberrant pollen phenotype in osgt1 mutant. A, T-DNA insertion positions. Start and stop codons are represented as ATG and TGA, respectively; positions of insertion are shown with triangles. Shaded boxes indicate e |
- You cannot overwrite this file.
File usage
The following page links to this file: