File:Ma205.jpg
Revision as of 14:05, 8 June 2014 by Mafeifei (talk | contribs) (Figure 5.—The ratios of three genotypes of SSR markers and frequency distributions of grain width in 300 BC4F2 individuals across four environments (E9–E12). A1–D1 represent the ratios of three genotypes of 12 SSR markers in E9–E12, respectively; )
Size of this preview: 485 × 600 pixels. Other resolutions: 194 × 240 pixels | 515 × 637 pixels.
Original file (515 × 637 pixels, file size: 218 KB, MIME type: image/jpeg)
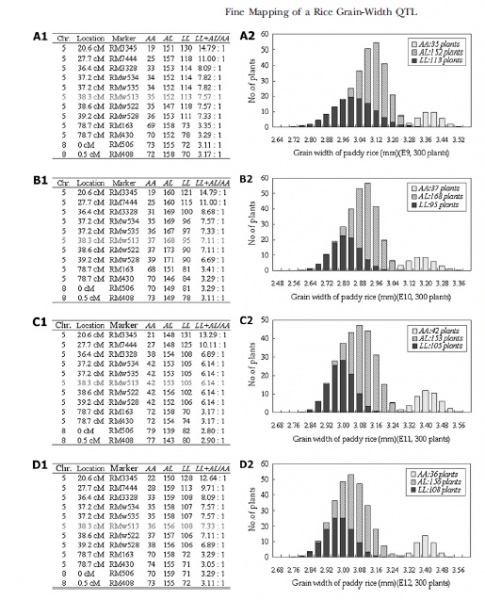
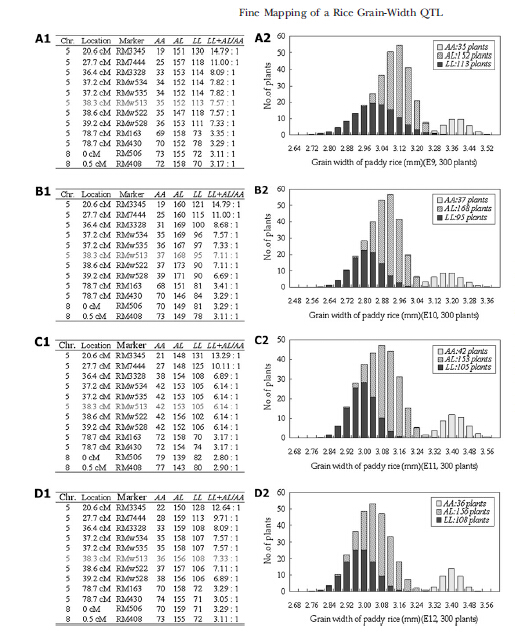
Figure 5.—The ratios of three genotypes of SSR markers and frequency distributions of grain width in 300 BC4F2 individuals across four environments (E9–E12). A1–D1 represent the ratios of three genotypes of 12 SSR markers in E9–E12, respectively; A2–D2 show the frequency distributions of grain width at the RMw513 locus in E9–E12, respectively.
File history
Click on a date/time to view the file as it appeared at that time.
| Date/Time | Thumbnail | Dimensions | User | Comment | |
|---|---|---|---|---|---|
| current | 14:05, 8 June 2014 | | 515 × 637 (218 KB) | Mafeifei (talk | contribs) | Figure 5.—The ratios of three genotypes of SSR markers and frequency distributions of grain width in 300 BC4F2 individuals across four environments (E9–E12). A1–D1 represent the ratios of three genotypes of 12 SSR markers in E9–E12, respectively; |
- You cannot overwrite this file.
File usage
The following page links to this file: