
 ChickenGTEx Atlas
Large-scale genome-wide association studies (GWAS) have demonstrated that the majority of the variants related to complex traits and adaptive evolution are located in non-coding genomic regions, which are believed to regulate gene activity/structure and contribute to phenotypic variation. To sustain food and agriculture production while minimizing negative environmental effects, it is indispensable to investigate systematically the functional consequences of genetic variants on the transcriptome of whole-body systems in farm animals under various biological contexts (such as tissues, cell types, developmental periods, gender, environmental exposures, and genetic backgrounds). The international Farm Animal Genomic Tissue Expression (FarmGTEx) project was lunched to build a comprehensive open-access atlas of regulatory variants in domestic animal species. The project can facilitate our understanding of the genetic regulatory circuitry underlying economically valuable traits and animal welfare, and pave the way for the next generation of livestock breeding industry, i.e., precision breeding.
The chicken serves not only as the most abundant source of protein-rich food for human nutrition and health but also as a fundamental model organism. Due to its distinguishing characteristics in evolution, physiology, and genetics, it provides novel insights into various aspects of fundamental biology, including embryonic development, virology, immunology, avian-specific features like flight, vertebrate genome evolution, natural and human-imposed selection, and human biomedicine. Chickens have undergone significant genetic and phenotypic divergences as a result of long-term intensified selection. Despite being the first sequenced farm animal and avian species, there is a significant lack of systematic characterization of the regulatory mechanisms behind non-coding variants that affect transcriptomes and variable phenotypes.
The Chicken Genotype-Tissue Expression (ChickenGTEx) project, as an essential part of the international Farm Animal GTEx project, aims to build the ChickenGTEx Atlas, which serves as a comprehensive catalogue of regulatory effects of genomic variants on chicken transcriptomic and phenotypic diversities across different biological contexts, spanning diversified genetic backgrounds, sexes, tissues, cell types, and chromatin statuses. The ChickenGTEx Atlas will serve as a valuable reference for fundamental biology (e.g., genetic regulations related to embryonic development, immune response, and tissue/cell type specificity), bird or vertebrate evolution, comparative transcriptomes, applied genetics (e.g., chicken precision breeding, and food security), and human biomedicine.
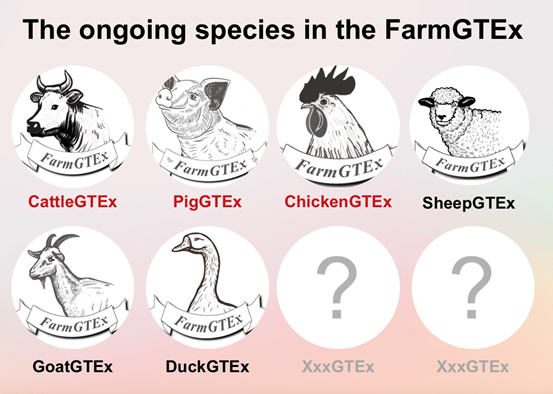
In the current version (pilot) of ChickenGTEx Atlas, the following information is provided:
In summary, the ChickenGTEx Atlas represents the most extensive compilation of
genetic regulatory effects on chicken transcriptomes across different tissues and cell types to date.
The portal can be illustrated by the following diagram:

The analysis outline is depicted in the following figure.

https://github.com/FarmGTEx/ChickenGTEx-Pipeline-v0
In the current (pilot) phase of ChickenGTEx Atlas, through integrating all the public available RNA-Seq and WGS datasets in chickens, we have figured out several gaps below. If you are interested in filling these gaps or other gaps that may not be listed here, please free feel to join us. The global coordinated efforts are required to fully develop this valuable resource.
 You can fill in the entry of interest in the input box to search and view the corresponding data and
information that you need.
For example,you can click on "gene" and search for gene names like ENSGALG00000000003 or PANX2 to
inquire about its location, length, gene expression analysis across different tissues, and their QTLs
information. By clicking on "Tissue" and "variant", you can also search for relevant data and
information.
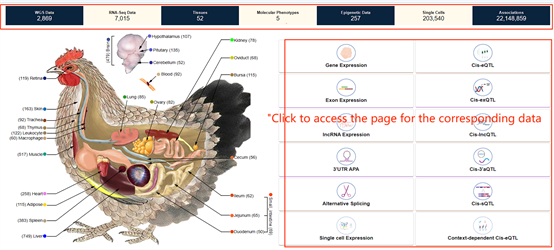 You can also directly click the specific areas in the four sections below, "WGS Data", "Gene
expression", "Publications", and "News and Events", to jump to the overview page of the corresponding
section.

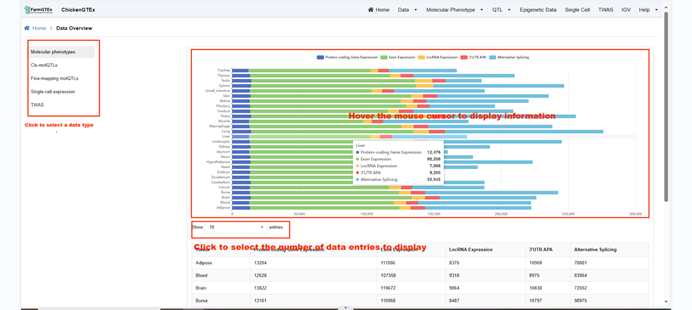
In the "Data Overview" section, you can view a comprehensive summary of all available data. By selecting
options on the left, such as "Molecular Phenotype", you'll be redirected to its respective overview.
Hovering over each bar on the right-side bar chart, for example, the "Molecular Phenotype" for the
Spleen tissue, will display detailed information specific to the Molecular Phenotype of the Spleen.
Below, you have options to choose how many entries to display per page: 10, 25, 50, or 100.
This showcases the projects from which the website's data is sourced.

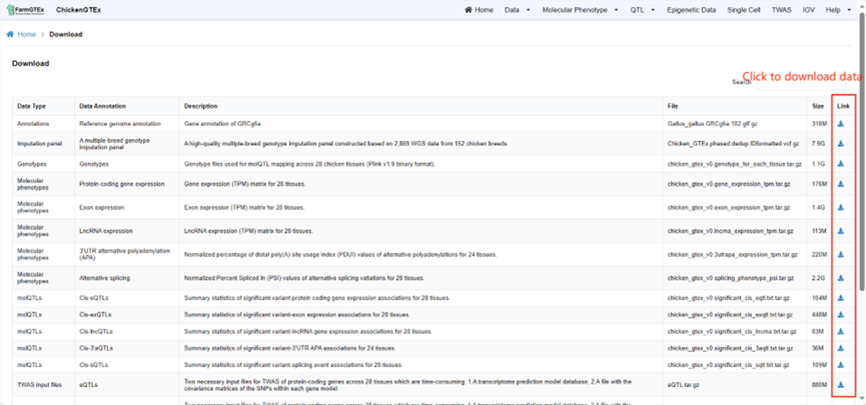
Here, you can select and download the datasets of your interest.
Hover over the "Molecular Phenotype" option at the top of the Home page to access various categories. By
clicking on the respective categories - Protein Coding Gene (PCG) Expression, Exon Expression, lncRNA
Expression, 3'UTR Alternative Polyadenylation, or Alternative Splicing, you can view the relevant
information.
For instance, within the "Protein Coding Gene (PCG) Expression" section. you have the flexibility to
choose how many entries you'd like to view per page: 10, 25, 50, or 100.
 Additionally, if you're looking for specific information, use the search bar by entering either an
Ensembl ID or RefSeq ID. For more detailed insights on individual genes, simply click on the links under
the "Tissue Expression" and "Gene Specificity" columns. This will provide you with the relevant Bulk
Tissue Gene Expression and Specificity parameter data.
Navigate to the specific QTL types by clicking on "QTL" from the home page, where you can select from Cis-molQTL, Fine-mapping molQTL, or Context-dependent molQTL.
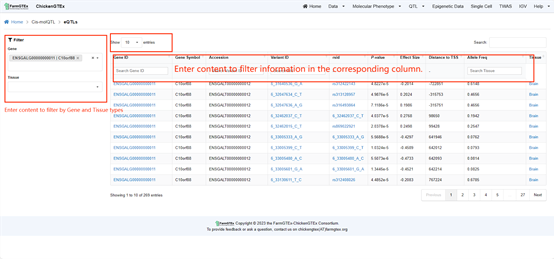
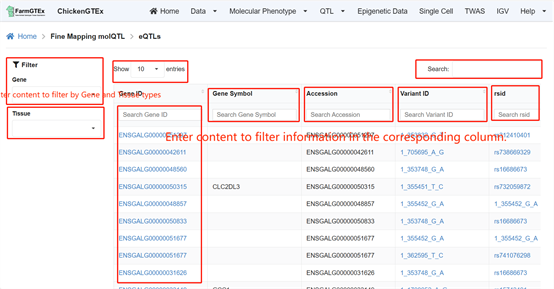
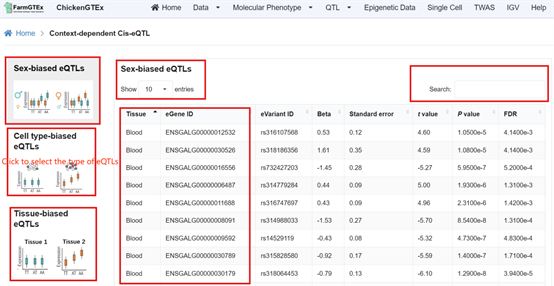
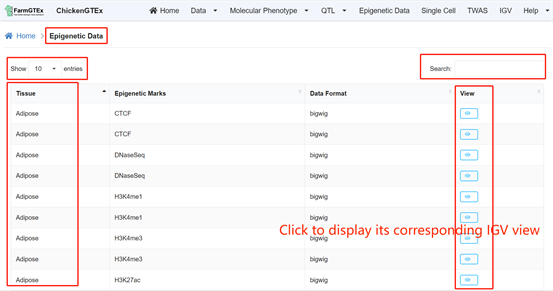
By clicking on "Epigenetic Data" on the home page, you'll be taken to a new page. Refine the displayed data using the search bar located at the top right of the table. By clicking on the blue "view" link within the table, you'll be presented with the IGV view for that specific data entry.
Click on the "Single Cell" tab at the top of the Home page to navigate to the Single Cell Page. This page showcases an annotated map of Cell Clusters. Directly below the tissue name, you'll find options to zoom into the map, reset the view, or download the visual.
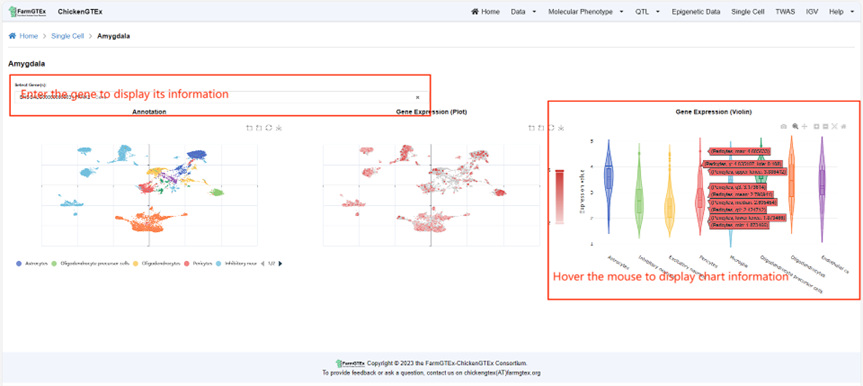
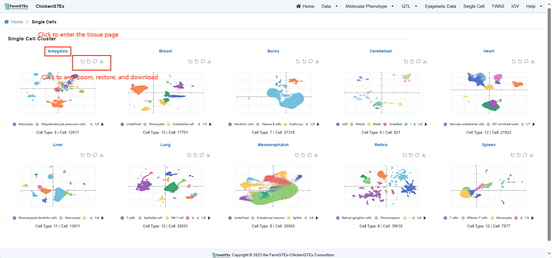 To dive deeper, simply click on the blue tissue name. This will lead you to a specific page where you can search for your gene of interest using the provided search bar. Results will display both dot plots and violin plots for the gene expression in the selected tissue. Hovering over the charts will reveal detailed gene expression data.
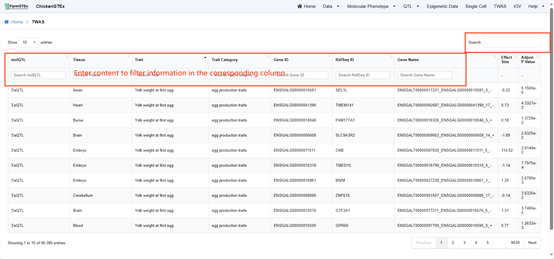
Navigate to the "Twas" page by clicking on the "Twas" tab located at the top of the Home page. To search for any of the following information types across all data, utilize the search bar located at the top-right of the table: molQTL, Tissue, Trait Category, Gene ID, RefSeq ID, and Gene Name. Additionally, you can filter specific column data by entering search terms in the search bars provided in the second row of each column in the data table.
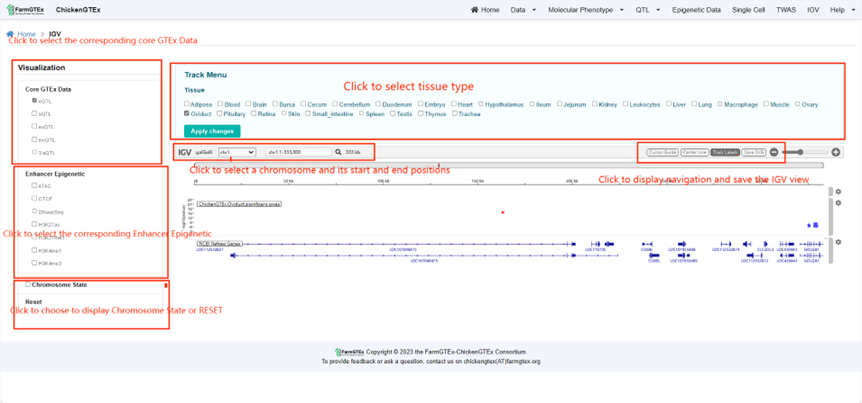
On the IGV Page, click "Visualization" to personalize the display of project details in the table. On the left side of the page, you have options to choose from Core GTEx Data, Enhancer Epigenetic, or Chromosome State. After making your selections, further refine by picking a tissue type and then click on the "Apply change" button to display the IGV view tailored to your chosen details. You also have the capability to select specific chromosomes and their positional information to exhibit the corresponding view. Above the view, you can opt to display the center line, cursor guide, and track label. Furthermore, there's an option available for downloading the current view.
The ChickenGTEx Atlas and all contents contained in the portal are made available under the following license: Prior to downloading and using data from the ChickenGTEx-Portal servers, users are required to accept the following Terms and Conditions of Use:
The ChickenGTEx Atlas: a pan-tissue catalogue of regulatory variants shaping transcriptomic and phenotypic diversity.
 Copyright © the FarmGTEx-ChickenGTEx Consortium.