HemAtlas
Mapping developmental
hematopoiesis across stages, species and models
HemAtlas Overview
HemAtlas is a platform meticulously designed for the systematic mapping of
hematopoiesis both in vivo and in vitro. HemAtlas offers comprehensive analyses of multi-omics datasets from
humans, mice, zebrafish, and HSPC in vitro culture systems. Through literature curation and data
normalization, HemAtlas integrates various functional modules, enabling interactive exploration and
visualization of omics data based on user-specific interests. Additionally, by employing a systematic and
uniform integration method, we constructed organ-wide hematopoietic references for each species, complete
with manually curated cell annotations. This enables a comprehensive decoding of developmental hematopoiesis
at the organ level. Of particular significance are three featured functions—single-cell cross-stage,
cross-species, and cross-model analysis—that HemAtlas employs to elucidate the ontogeny of hematopoiesis
across zebrafish, mice, and humans, and to provide insights for the generation of HSPCs in
vitro.

Homepage
The homepage is organized by nine modules in HemAtlas including "Omics", "Knowledge", "Hematopoietic References", "Metadata", "Featured Functions", "HSPC Development", "Statistics", "Help", and "Download" for users to obtain analysis results.


Omics
The primary goal of HemAtlas is to offer researchers an online platform for data exploration tailored to
their interests while preserving original analysis results of each dataset to the maximum extent. To achieve
this, following the normalization of multi-omics datasets, HemAtlas develops a multi-omics visualization
module that incorporates four interactive analysis tools for exploring these datasets. The multi-omics
datasets include bulk transcriptomic, single-cell transcriptomic (such as 10x Genomics, Smart-seq2, and In
Drops), epigenetics (including (sc)ATAC-seq and ChIP-seq), and spatial transcriptomic (like GEO-seq,
LCM-seq, and 10x Visium). Users can easily select interesting datasets from the navigation bar across four
different omics categories and can zoom in for detailed information on any selected category using the
zoom-in button.

Knowledge
As a comprehensive encyclopedia of hematopoiesis, HemAtlas features a "Species/Systems"
section that
showcases the knowledge of hematopoietic cross-stage development across various species, including humans,
mice, zebrafish, and in vitro culture systems. In this module, users can access not only corresponding
datasets but also knowledge information about hematopoiesis in each developmental stages and
species.
Human
Key hematopoietic organs/ tissues include the aorta-gonad-mesonephros (AGM), fetal liver (FL), and bone
marrow (BM).
Mouse
Important hematopoietic organs/tissues consist of the AGM, placenta (PL), FL, and BM.
Zebrafish
Key hematopoietic organs/tissues include AGM, caudal hematopoietic tissue (CHT), and kidney marrow (KM).
In Vitro
This involves direct differentiation and conversion processes. Specifically, direct differentiation and
direct conversion are two commonly used methods for HSPC in vitro induction.

Hematopoietic References
To comprehensively decode developmental hematopoiesis at organ levels and facilitate better reuse of the collected scRNA-seq datasets, we constructed organ-wide hematopoietic references in each species at single-cell resolution using a step-by-step and standardized analysis workflow for each species. All cell types in these organ-wide hematopoietic references—both stage-specific atlases and cross-stage references—are manually re-annotated and standardized.

Researchers can explore cell composition and gene expression in specific developmental stages and species using these constructed stage-specific atlases, such as zebrafish AGM, mouse FL, and human BM based on their interested biological questions. Moreover, the systematically integrated cross-stage references, constructed using consistent standards and workflows, offer a uniform and comprehensive view of species-conserved developmental hematopoiesis across stages. These references facilitate direct cross-stage analyses, enabling researchers to explore gene expression and cell composition across different stages for each species in HemAtlas.

Metadata
Up to now, HemAtlas has integrated 94 multi-omics datasets from 43 publications (https://ngdc.cncb.ac.cn/hematlas/publications), covering 374 major cell types, 12 organs/tissues, 1,976,361 samples/cells, and 94,771 genes (including protein-coding genes, rRNA, ncRNA, etc.) in humans and in vitro systems (37,550 genes), mice (36,577 genes), and zebrafish (20,642 genes)).


Featured Functions
HemAtlas features user-friendly tools designed for demand-driven exploration of hematopoiesis both in vivo
and in vitro. Leveraging each individual collected scRNA-seq dataset (where we prioritized retaining the
original data analysis results such as cell type annotation) and each constructed organ-wide hematopoietic
references of three species (where cell type annotations were systematically re-annotated manually), we have
implemented various interactive analysis modules for cross-stage, cross-species, and cross-model analyses
function.

Cross-stage analysis aims to study the developmental hematopoiesis in each
species. In "cross-stage analysis" module, HemAtlas provides non-integrative strategy and integrative strategy for cross-stages comparisons.

Users can make a custom selection in only one species but 1-4 stages for multi-stages comparison. Cross-stage analysis includes following analysis modules: For "cell overview and gene expression", users can explore intersected gene expression (For example: csf1ra) or interested cell types (For example: macrophage) in the selected datasets across developmental stages. Specifically, for the visualization of gene expression, cells with zero gene expression values are removed from the violin plots to maintain data load efficiency and webpage fluency. Additionally, for some scRNA-seq data containing a large number of cells, we limit the feature plot to display approximately 3,000 genes. However, we provide a Dot plot section that displays both the average cell expression (avg.exp) and the percentage of cell expression (pct.exp) for all the genes in each dataset. If you're only interested in specific cell types, you can choose to hide other cell types in the cell overview.


Cross-species analysis aims to reveal the evolutionary conservation and difference
of hematopoiesis. Usage between cross-stage analysis and cross-species analysis is similar for cell
overview, gene expression, differential expression genes, GO enrichment, and cell interaction, and cell
components. It is important to note that we did not perform systematic cross-species integration due to the
potential loss of valuable biological information. For example, certain zebrafish genes, such as fli1a and
fli1b, which are one-to-many homologous genes, may be obscured after homologous gene conversion, where they
are merged into a single category, FLI1. Instead, researchers can use individual scRNA-seq datasets
alongside stage-specific atlases we constructed to perform cross-dataset comparisons without the need for
cross-species integration.

Cross-model analysis provides potential insights for
engineering the hematopoietic systems in vitro, allowing researchers to interactively compare their uploaded
in vitro HSPCs between our in vivo HSPC references. Cross-model analysis involves two steps: the first step
is to utilize the singleCellNet algorithm (Tan and Cahan 2019) to assess the degree of HSPC similarity
between in vitro and in vivo based on the pre-built HSPC cross-stage atlas and trained HSPC classifiers for
each species. The second step of cross-model analysis aims to identify differential key factors of HSPCs
across models, including differentially expressed genes (DEGs), enriched GO terms for DEGs, differentially
expressed TFs, and differentially expressed cell "differentiation" (CD) surface antigens
for cell
sorting..

HSPC Development
In "HSPC development" module, we have integrated several analysis tools, including CellOracle (Kamimoto et al., 2023), Cellchat (Jin et al., 2021a), and scMetabolism (Wu et al., 2022), to comprehensively investigate the cross-stage development of HSPCs across different species. In the integrated analysis results for HSPC cross-stage development among three species (humans, mice, and zebrafish), HemAtlas offers an interactive exploration HSPC development module in four main sections:
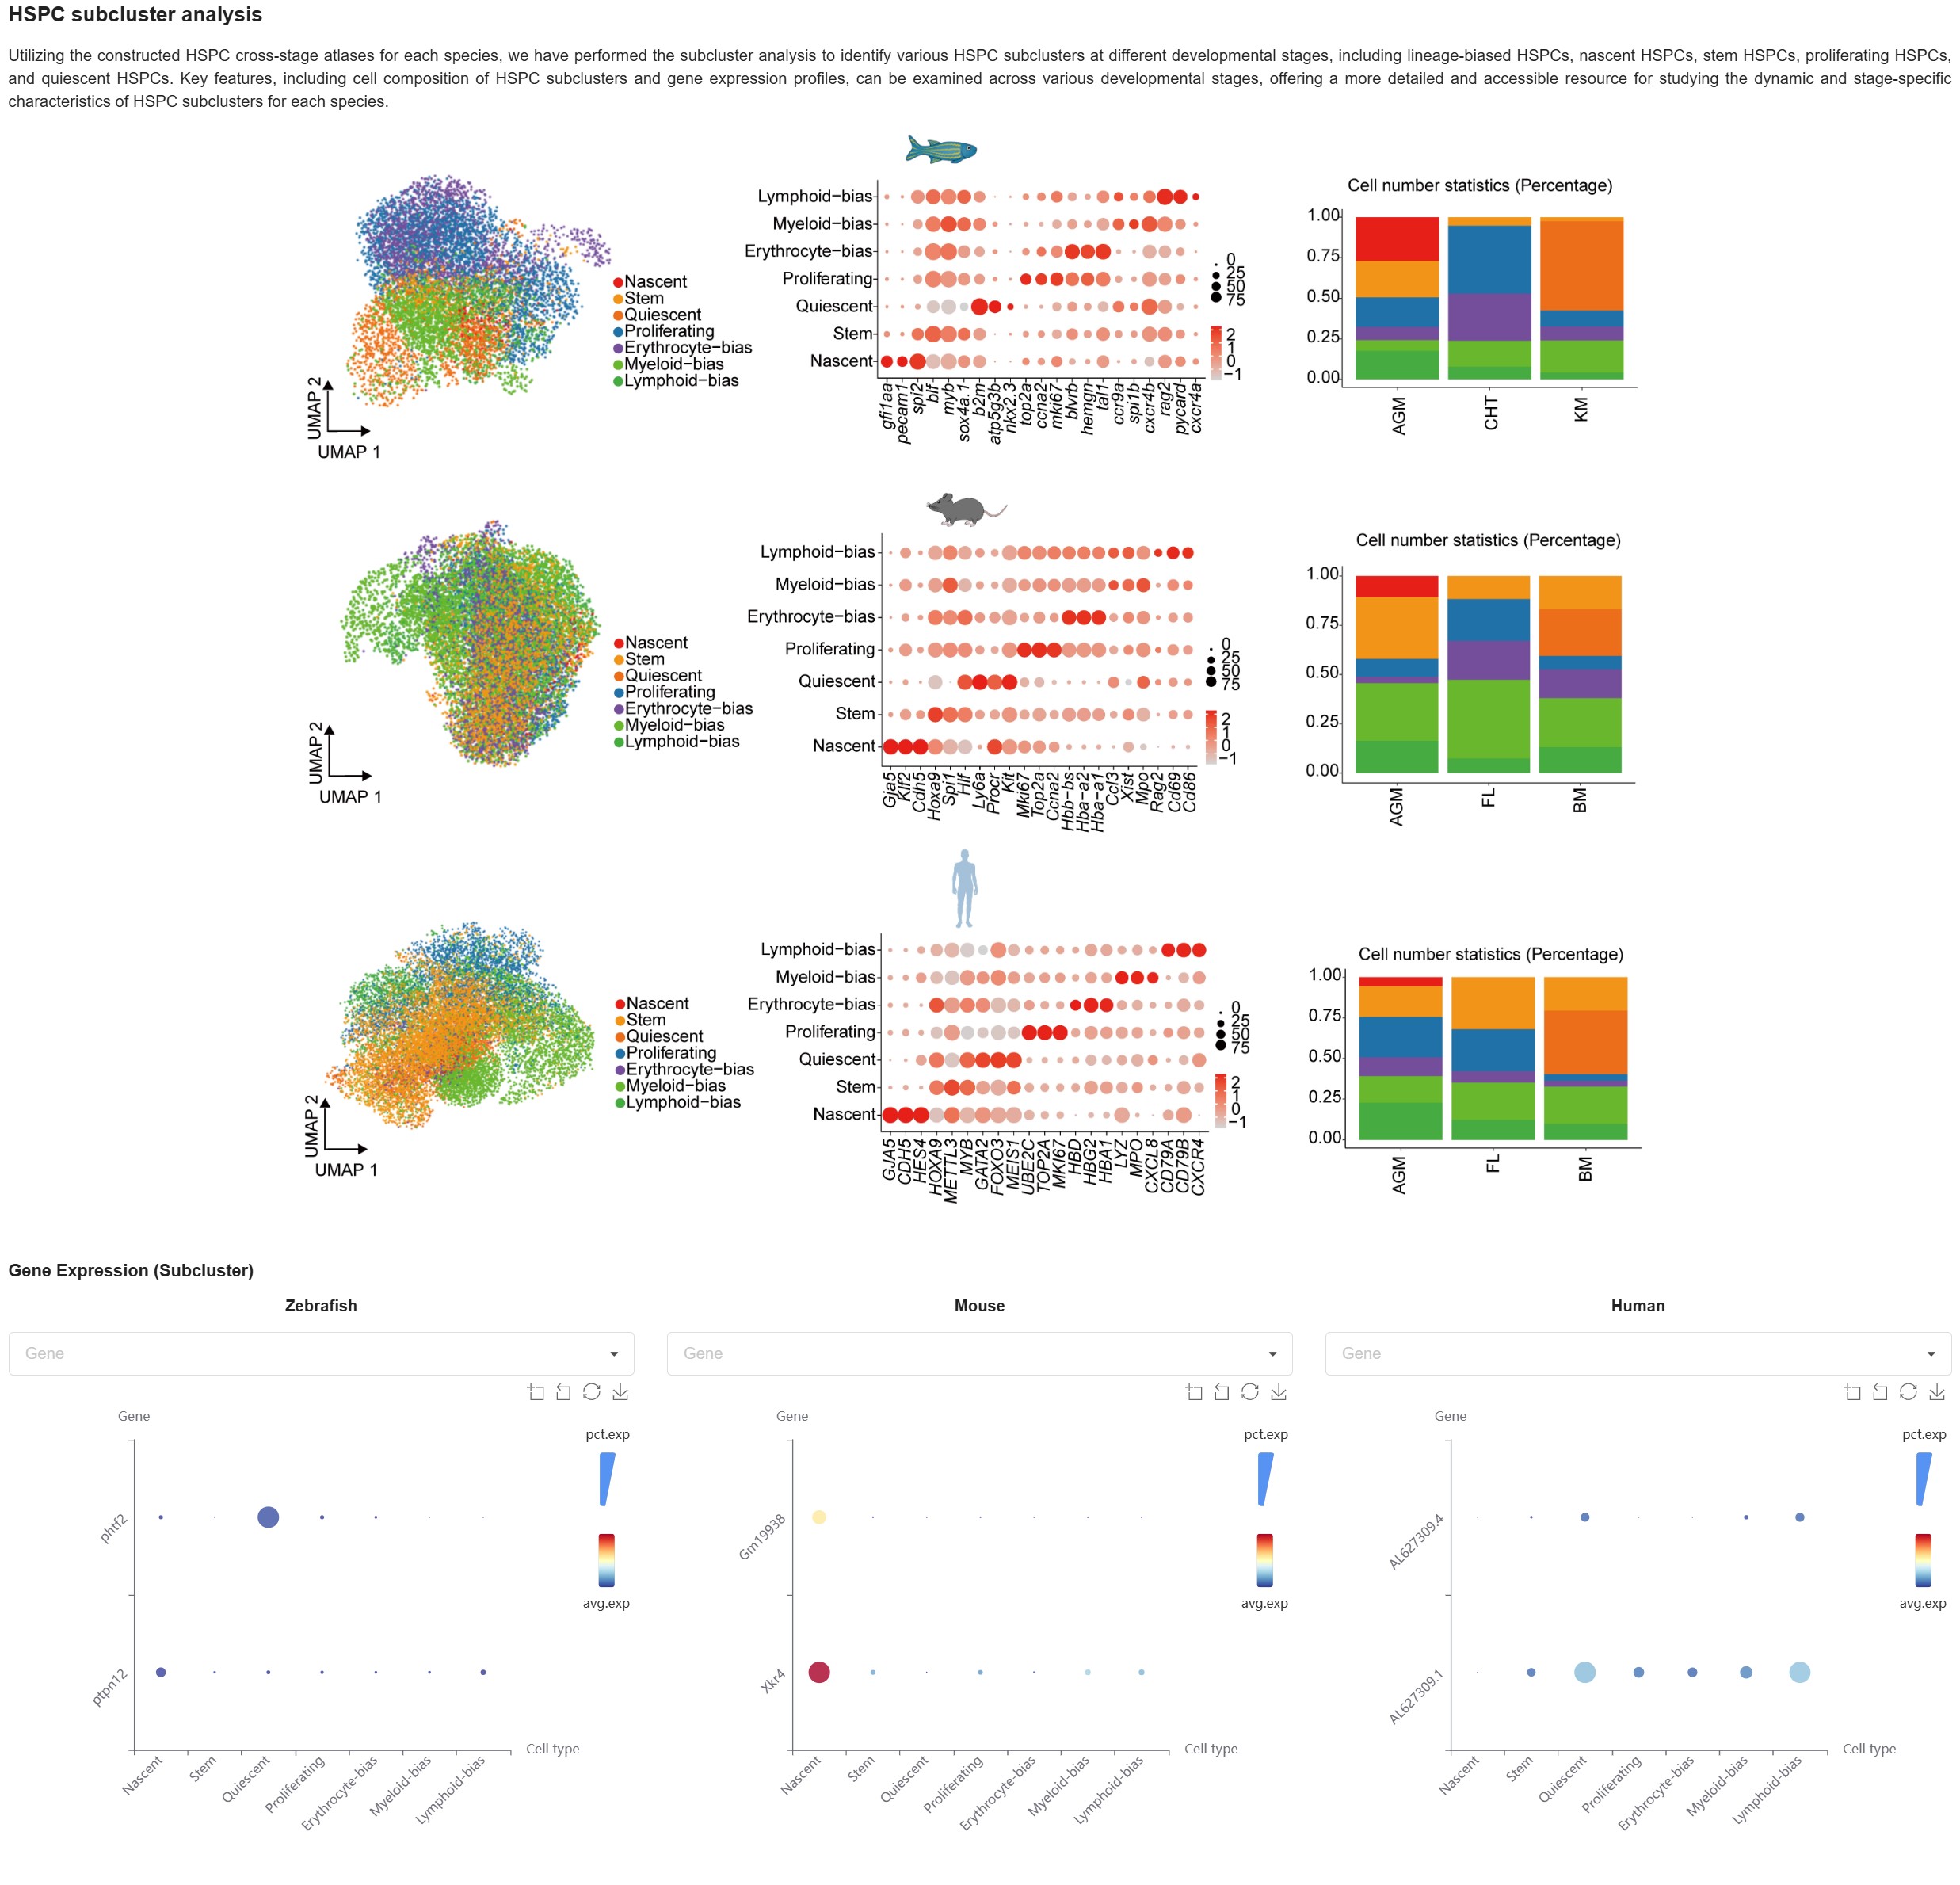
HSPC subcluster analysis aims to identify various HSPC subclusters at different developmental stages, including lineage-biased HSPCs, nascent HSPCs, stem HSPCs, proliferating HSPCs, and quiescent HSPCs for each species. Key features, including cell composition of HSPC subclusters and gene expression profiles, can be examined across various developmental stages, offering a more detailed and accessible resource for studying the dynamic and stage-specific characteristics of HSPC subclusters for each species.
HSPC inter-stage heterogeneity aims to systematically understand the dynamics of
cell states during HSPC cross-stage development. Our detailed analysis unveiled extensive HSPC inter-stage
heterogeneity at different biological layers, characterized by dynamic gene expression, distinct metabolic
profiles, variations in cell cycle progression, and fluctuations in immune status throughout HSPC
cross-stage development.

Intrinsic regulatory program aims to elucidate the underlying mechanism of HSPC
inter-stage heterogeneity by constructing intrinsic stage-specific gene regulatory networks. Users can
explore the intrinsic regulatory program section to identify key TFs with high degree centrality,
stage-common or stage-specific key TFs during HSPC cross-stage development for each species.

Extrinsic regulation program aims to elucidate the underlying mechanism of HSPC
inter-stage heterogeneity by constructing extrinsic cell-cell communication networks. Users can explore the
extrinsic regulation program section to identify stage-specific key HSPC niche regulators and the underlying
ligand-receptor pairs interacting with HSPCs across stages and species.

Statistics
In the "Statistics" module of HemAtlas, users can access a controlled word cloud covering omics, species, organs, and cell types based on samples in datasets.


Help
To better illustrate the application of HemAtlas, we have included a detailed description of the online
usage of
HemAtlas and four case studies in the FAQ section on the HemAtlas website to provide users with practical
operation
instructions and step-by-step guidance. Moreover, in the "Contact Us" section, we have
provided our email
address so
that users can directly contact us if they have any questions.

Caes Study
As mentioned above, we have included four case studies in the FAQ section, which provides expanded and detailed descriptions of how to effectively use the various online visualization and exploration modules developed in HemAtlas. The included four case studies are:
Case Study 1. Interactive exploration and visualization of organ-wide hematopoietic references
To comprehensively decode developmental hematopoiesis at the organ level and facilitate better reuse of the collected scRNA-seq datasets, we constructed organ-wide hematopoietic references (including stage-specific atlases and cross-stage references) for each species at single-cell resolution using a standardized, step-by-step analysis workflow. In this case study, we primarily applied the stage-specific atlases from the organ-wide hematopoietic references to investigate cell composition and gene expression across specific developmental stages and species with systematic and manual cell annotation. Additionally, the systematically integrated cross-stage references offer a uniform and comprehensive perspective on species-conserved developmental hematopoiesis across various stages. The application of cross-stage references will be elaborated upon in the following Case Study 2.
Parameters:
In the dataset selection section of the Hematopoietic References module webpage (https://ngdc.cncb.ac.cn/hematlas/references), the available datasets, including both stage-specific atlases and cross-stage references for each species, are displayed. Users can select datasets of interest for specific developmental stages and species, which feature systematic and manual cell annotation, to perform further interactive exploration and visualization. In this case study, we selected “Mice” and “Mouse AGM atlas”. After clicking on the picture of the Mouse AGM atlas, the webpage will then display the online analysis results for the selected dataset.

The case of parameters
Result
The case of result 1: The summary of selected dataset
In the Visualization section of the Hematopoietic References module after data section, users can delve into the specific cell types present in their selected datasets and analyze gene expression patterns for genes of interests. Specifically, for the visualization of gene expression, cells with zero gene expression values are removed from the violin plots to maintain data load efficiency and webpage fluency. Additionally, for some scRNA-seq data containing a large number of cells, we limit the feature plot to display approximately 3,000 genes. However, we provide a Dot plot section that displays both the average cell expression (avg.exp) and the percentage of cell expression (pct.exp) for all the genes in each dataset. If you're only interested in specific cell types, you can choose to hide other cell types in the cell overview.
In this case study, we identified several potential niche cells specific to the mouse AGM stage, including neural crest cells, myoblasts, and germ cells. Subsequently, we examined the expression of Myb, a key transcription factor in the regulation of hematopoiesis across species (Soza-Ried et al., 2010; Wang et al., 2018), within the selected mouse AGM atlas. Our findings revealed that Myb was enriched in mouse AGM hematopoietic stem and progenitor cells (HSPCs), which aligns with its critical role in HSPC generation in vivo (Lieu and Reddy, 2009; Pattabiraman and Gonda, 2013).

The case of result 2: The specific expression of Myb in HSPCs was analyzed using the selected mouse
AGM atlas, employing the Visualization section of Hematopoietic References module.
Next, users can utilize the pre-calculated Differentially Expressed Genes section to identify cell
type-specific differentially expressed genes in the selected datasets. This analysis can help users discover
new markers for specific cell types based on metrics such as logFC (log2(fold change)). By identifying genes
with significant expression changes, users can pinpoint potential markers for further investigation.
Moreover, the identified cell type-specific markers can then be visualized and validated using the feature
plot, violin plot, and dot plot sections available in HemAtlas.

The case of result 3: The artery endothelial cell differentially expressed genes were analyzed using the selected mouse AGM atlas. This analysis was performed by utilizing the Differentially Expressed Genes section within the Hematopoietic References module. The identified artery endothelial cell-specific markers, such as Gja4 and Gja5, can then be visualized and validated using the dot plot section available in HemAtlas.
Next, users can utilize the pre-calculated online GO Enrichment section to identify cell type-specific differentially expressed genes enriched GO terms in the selected datasets. This analysis may highlight GO terms related to specific cell functions and features of the cell types of interest. It should be noted that displaying all thousands of GO terms in the dropdown box is impractical. Instead, the drop-down box includes a search function, allowing researchers to search by GO ID and GO description.
For instance, in this case study, we found that HSPCs exhibit representative hematopoietic regulatory functions in the mouse AGM stage.

The case of result 4: The enriched GO terms of HSPCs differentially expressed genes were analyzed using the selected mouse AGM atlas. This analysis was performed by utilizing the GO Enrichment section within the Hematopoietic References module.
Next, the online Cell Interaction section can be utilized to identify cell-cell communication networks between cell types of interest. This includes analyzing the interaction strength and corresponding ligand-receptor pairs between the cell types. In this case study, by setting the HSPCs as the targeting cells, we found that HSPCs can be regulated by multi cell types through cell-cell interactions.

The case of result 5: The cell-cell communication networks in mouse AGM stage between HSPCs and niche cells based on the selected mouse AGM atlas utilizing the online Cell Interaction section within the Hematopoietic References module.
Case Study 2. Cross-stages analysis of csf1ra and csf1rb in zebrafish using two strategies
In this case study, we applied two strategies for cross-stage analysis: the non-integrative strategy and the integrative strategy.
2.1 Non-integrative strategy
Parameters:
In the section of Non-integrative strategy in the Cross-stage analysis data selection webpage
(https://ngdc.cncb.ac.cn/hematlas/featured/organs):
Select species: Select Zebrafish (Only supports selecting a single species)
Select stages: Select AGM (aorta-gonad-mesonephros), CHT (caudal hematopoietic tissue), and
KM (kidney marrow) (Supports selecting multiple stages)
Once the species and stages are selected, the available datasets will be displayed.
Datasets: Select datasets of interest (here is HemSC00000043, HemSC00000048, and
HemSC00000059).
After selecting the datasets, click “Comparison”. The webpage will then display the
non-integrative strategy analysis results for the selected datasets, allowing users to compare them across
the chosen stages without integrating the data, thereby preserving the original context and analysis results
of each dataset. However, if users select the constructed stage-specific atlases datasets, the cell
annotations are based on our manual reanalysis, as we have reanalyzed these datasets from raw FASTQ files to
construct these atlases.

The case of parameters
Result

The case of result 1: The summary of selected datasets
Then, in the Cell Overview & Gene Expression section, users can explore the included cell types in the selected datasets, viewing the original analysis results from each study. Additionally, users can examine the expression of genes of interest across the selected datasets, gaining insights into their roles and patterns across different developmental stages. Specifically, for the visualization of gene expression, cells with zero gene expression values are removed from the violin plots to maintain data load efficiency and webpage fluency.
Additionally, for some scRNA-seq data containing a large number of cells, we limit the feature plot to display approximately 3,000 genes. However, we provide a Dot plot section that displays both the average cell expression (avg.exp) and the percentage of cell expression (pct.exp) for all the genes in each dataset. If you're only interested in specific cell types, you can choose to hide other cell types in the cell overview. In this case study, we found that macrophages were a stage-common cell type across zebrafish AGM, CHT, and KM. Moreover, we identified distinct expression patterns for csf1rb and csf1ra. Specifically, csf1ra showed a specific and uniform expression in zebrafish macrophages, whereas csf1rb displayed a more variable pattern, with prominent expression in macrophages, HSPCs, and neutrophils, but less in niche cells.

The case of result 2: The specific expression of csf1ra in zebrafish macrophages across three developmental stages based on the selected datasets using Cell Overview & Gene Expression section in the cross-stage analysis module

The case of result 3: The variable expression pattern of csf1rb in zebrafish across three developmental stages based on the selected datasets using Cell Overview & Gene Expression section in the cross-stage analysis module.
Moreover, to facilitate cross-stage comparison of gene expression dynamics, we deployed a section that simultaneously displays the pre-calculated average cell expression and the percentage of cell expression for interested genes across different datasets/stages. Users can select specific genes and cell types to visualize the dynamic changes in gene expression across different developmental stages. In this case study, we found that csf1ra exhibited consistent and specific expression in macrophages throughout the zebrafish AGM, CHT, and KM stages. In contrast, csf1rb displayed a dynamic expression profile across these stages especially in HSPCs and neutrophils.

The case of result 4: The dynamic expression profile of csf1rb in HSPCs and neutrophils across three developmental stages based on the selected datasets
Moreover, other online analysis sections such as Differentially Expressed Genes, GO Enrichment, Cell Interaction, and Cell Components offer additional analytical capabilities. For instance, users can utilize the Cell Components module to perform cell number statistics across stages, gaining insights into how cell populations vary throughout hematopoietic development.

The case of result 5: The cell number statistics in the selected datasets with original cell annotation. The color represented corresponding cell types according to the legend.
Meanwhile, the above-mentioned selected datasets can be replaced by our constructed stage-specific atlases (here is HemSC01000084, HemSC01000085, and HemSC01000086), which feature a more uniform data analysis workflow and more consistent and manually curated cell annotations. This can be done by selecting the corresponding dataset in the cross-stage analysis data selection webpage.

The case of result 6: The selection of constructed stage-specific atlases in zebrafish to perform cross-stage analysis using the non-integrative strategy in the cross-stage analysis module

The case of result 7: The dot plots showing the expression of csf1ra and csf1rb across selected stage-specific atlases during zebrafish cross-stage development in the cross-stage analysis module
2.2 Integrative strategy
Parameters:
In the section of Non-integrative strategy in the Cross-stage analysis data selection webpage (https://ngdc.cncb.ac.cn/hematlas/featured/organs):
Select species: Zebrafish (Only supports selecting a single species)After selecting the species, click “View”. Then the webpage will jump to the zebrafish cross-stage reference in the organ-wide Hematopoietic References module.
Select gene: csf1ra and csf1rb
Results:

The case of result 8: The visualization of the distinct expression patterns for csf1rb and csf1ra in the zebrafish cross-stage reference using the integrative strategy.
Case Study 3. Identifying species-conserved hematopoietic regulatory functions of fibroblasts using cross-species analysis
In this case study, we applied the non-integrative strategy to perform the cross-species analysis for the fibroblast in zebrafish CHT and mammalian FL.
Parameters:
Cross-stage analysis data selection webpage (https://ngdc.cncb.ac.cn/hematlas/featured/species):
Select stages: CHT (caudal hematopoietic tissue)/ Fetal liver (Only supports selecting a
single stages)
Select species: Human, Mouse, and Zebrafish (Supports selecting multiple species)
Once the stages and species are selected, the available datasets will be displayed.
Datasets: Select datasets of interest (In this case study, we select HemSC00000048,
HemSC00000041, and HemSC00000017). After selecting the datasets, click “Comparison”. The
webpage will then display the non-integrative strategy analysis results for the selected datasets, allowing
users to compare them across the chosen species without integrating the data, thereby preserving the
original context and analysis results of each dataset. Users also have the option to choose constructed
stage-specific atlases with more consistent and manually curated cell annotations as mentioned in the
Case Study 2.

The case of parameters
Result

The case of result 1: The summary of selected datasets

The case of result 2: The visualization of fibroblast and expression of corresponding marker gene col1a1a/Col1a1/COL1A1 in selected datasets from zebrafish CHT, mouse FL, and human FL separately using the Cell Overview & Gene Expression section in the cross-species analysis module.
Then, users can utilize the pre-calculated online Differentially Expressed Genes section to identify conserved cell type-specific differentially expressed genes across the three species based on their scientific questions. Here, we focused on fibroblasts and set a threshold of logFC (log2 (fold change)) at 0.5. This allowed us to identify two top-ranked and conserved fibroblast-specific differentially expressed genes across the three species: sparc/Sparc/SPARC and igfbp5b/Igfbp5/IGFBP5. Specifically, we first searched for fibroblasts in the Cell Type column, and then set the minimum logFC threshold to 0.5. This allowed us to obtain all fibroblast-specific differentially expressed genes with significant expression changes across the three species in the selected datasets. From these results, we can manually identify species-conserved fibroblast-specific differentially expressed genes. Finally, we identified two top-ranked conserved fibroblast-specific genes across the three species: sparc/Sparc/SPARC and igfbp5b/Igfbp5/IGFBP5.

The case of result 3: The identification of two top-ranked, conserved fibroblast-specific differentially expressed genes across the three species using the pre-calculated online Differentially Expressed Genes section in the cross-species analysis module.
Next, users can utilize the pre-calculated online GO Enrichment section to identify cell type-specific
differentially expressed genes enriched GO terms across the three species based on the selected datasets.
This analysis may highlight GO terms related to specific cell functions and features of the cell types of
interest across different species. It should be noted that displaying all thousands of GO terms in the
dropdown box is impractical. Instead, the drop-down box includes a search function, allowing researchers to
search by GO ID and GO description.
In this case study, we found that fibroblasts exhibit a conserved hematopoietic regulatory function in
addition to their traditional roles during evolution.

The case of result 4: The identification of conserved hematopoietic regulatory function of fibroblast across three species using the pre-calculated online GO Enrichment section in the cross-species module.
Next, the online Cell Interaction section can be utilized to identify cell-cell communication networks between cell types of interest. This includes analyzing the interaction strength and corresponding ligand-receptor pairs between the interested cell types. In this case study, we found that HSPCs can be regulated by fibroblasts through cell-cell interactions. This regulation is exemplified by ligand-receptor pairs such as Mdk-(Itga6+Itgb1) and Mdk-(Itga4+Itgb1) in mouse FL.

The case of result 5: The cell-cell communication networks in zebrafish CHT, mouse FL, and human FL based on the selected datasets utilizing the online Cell Interaction section in the cross-species analysis module.

The case of result 6: The identification of representative ligand-receptor pairs with the top10 largest communication probabilities between fibroblast as ligand-expressing cells and HSPCs as receptor-expressing cells using the Cell Interaction section in the cross-species analysis module.
Similarly, users can utilize the Cell Components section to perform cell number statistics across species, gaining insights into how cell populations vary throughout different species.

The case of result 7: The cell number statistics in the selected datasets with original cell annotation using the Cell Components section in the cross-species analysis module. The color represented corresponding cell types according to the legend.
Meanwhile, the above-mentioned selected datasets can be replaced by our constructed stage-specific atlases (For instance, in this case study, we can select dataset HemSC01000085, HemSC01000089, and HemSC01000093), which feature a more uniform data analysis workflow and more consistent and manually curated cell annotations. This can be done by selecting the corresponding dataset in the cross-stage analysis data selection webpage.

The case of result 8: The selection of constructed stage-specific atlases across three species to perform cross-species analysis.

The case of result 9: The specific expression of sparc/Sparc/SPARC in fibroblast from zebrafish CHT, mouse FL, and human FL based on the stage-specific atlases in the cross-species analysis module.
Case Study 4. Cross-model analysis offers potential insights for engineering the hematopoietic system in vitro
In this case study, we primarily used the demo in vitro HSPC scRNA-seq data to conduct the cross-model
analysis.
Parameters:
Cross-model analysis webpage (https://ngdc.cncb.ac.cn/hematlas/featured/invitro/):
Select species: Human (Only supports selecting a single species)
Then we selected Submit with example to upload our in vitro HSPC scRNA-seq data, or users can upload their
own HSPC scRNA-seq data with specific requirements: File size < 20Mb, File extension: txt/rds, File format:
columns separated by tabs, Gene name: gene symbol only. Additionally, the pipeline for cross-model analysis
was also outlined on the cross-model analysis data selection webpage.

The case of parameters
Case Study 4. Cross-model analysis offers potential insights for engineering the hematopoietic system in vitro
In this case study, we primarily used the demo in vitro HSPC scRNA-seq data to conduct the cross-model analysis.
Parameters:
Cross-model analysis webpage (https://ngdc.cncb.ac.cn/hematlas/featured/invitro/):
Select species: Human (Only supports selecting a single species)
Then we selected Submit with example to upload our in vitro HSPC scRNA-seq data, or users
can upload their own HSPC scRNA-seq data with specific requirements: File size < 20Mb, File extension:
txt/rds, File format: columns separated by tabs, Gene name: gene symbol only. Additionally, the pipeline for
cross-model analysis was also outlined on the cross-model analysis data selection webpage.
After data uploading complete, we can view the cross-model analysis results, including:
-
Summary
 The case of result 1: A brief summary of the cross-model analysis
-
Similarity
 The case of result 2: The heatmaps and violin plot showing the transcriptomic similarity between in vitro and in vivo HSPCs predicted by the SingleCellNet algorithm (Tan and Cahan 2019).
-
DEGs
 The case of result 3: The table showing the differentially expressed genes between in vitro and in vivo HSPCs.
-
GO enrichment
 The case of result 4: A graphical interface and table displaying the enriched GO terms for differentially expressed genes in both in vitro and in vivo HSPCs. Users can select specific GO terms of interest to view them in the graphical interface.
-
TFs
 The case of result 5: A graphical interface displaying selected differentially expressed TFs between in vitro and in vivo HSPCs. Users can select specific TFs of interest to view them in the graphical interface.
-
CDs
 The case of result 6: A graphical interface displaying selected differentially expressed cell differentiation (CD) surface antigens between in vitro and in vivo HSPCs. Users can select specific CDs of interest to view them in the graphical interface.
-
Download
 The case of result 7: All online analysis results can be downloaded in a compressed file.
Download
All the processed data, which includes bulk RNA-seq, scRNA-seq, spatial transcriptomic, and epigenomics data along with their corresponding metadata, can be publicly downloaded in an interactive manner. Additionally, the stage-specific atlases, cross-stage references, and HSPC cross-stage blueprints across three species are also available for public access. More importantly, we provide the corresponding MD5 number for each available dataset, allowing users to verify data integrity after downloading. Moreover, we also implemented support for command-line tools, such as Linux-wget, enabling users to efficiently download large datasets directly from the HemAtlas website.
