SugarcaneOmics
The SugarCane multi-Omics Database
 SugarcaneOmics
The SugarCane multi-Omics Database
1. About the SugarcaneOmics
SugarcaneOmics is a comprehensive database providing extensive knowledge and analytical tools for sugarcane multi-omics research. We have collected and re-annotated the genomes of 14 sugarcane accessions, encompassing wild, tropical, cultivated varieties and relative species, at both gene and pan-gene levels. Utilizing resequencing data from over 300 sugarcane germplasms (Li et al., 2024; Zhang et al., 2022), we generated approximately 145 million SNPs and 30 million INDELs using the Np-X reference genome. Additionally, we compiled gene expression data across six developmental stages and 14 tissue types from 1,256 samples, aligned to the Np-X reference genome. Within the Sugarcane Omics database, these multi-omics datasets are organized into several fundamental modules: Genome, Transcriptome, Variome, FeaturesGenes, and Breeding Information. To facilitate research, we offer a suite of analytical tools, including BLAST Search (BLAST), SeqFetch, GO Enrichment, Primer Server, PIN (Protein Interaction Network) Miner, and CRIOff (CRISPR Off-Target) Identifier.
2. How to search genes of interest?
2.1. Workflow
Here we describe a workflow, demonstrating how SugarcaneOmics integrates multi-omics modules to support identification of candidate gene for sugarcane precision breeding.
2.2. Case 1: IPA1
There is a case study for exploring IPA1.
Step 1. Search for Target Gene
Navigate to the Search Panel and input
the gene symbol of interest, e.g., IPA1, into the search box (Figure a). The system will
return all
matching genes across integrated datasets. The search result table displays all matched gene
entries. Click on the gene ID Npp.02C024290.1 to access its detailed information page (Figure b).
Step 2. View Gene Basic Information & Functional Annotations
On the gene detail page, the following information is provided (Figure c):
• Basic Information: Genomic position, gene length, transcript details.
• Functional Annotations: InterPro, Pfam domains, Gene Ontology terms.
• Domain Visualization: Position and score of the SBP (SQUAMOSA promoter binding
protein) transcription factor domain in the protein sequence of IPA1.
This section helps users understand the gene's biological function and structural features.

Step 3. Investigate Homologous Gene Distribution
The Homology module presents the distribution of Npp.02C024290.1 homologs across species in the
Saccharum genus and other related Poaceae species. Users can view the homologous genes in
each species (Figure d).
Step 4. Examine Genetic Variation and Selective Signals
The Variome module provides the following key pieces of evidence (Figure e):
• Selective Sweep Signals: Genome-wide sweep regions, with Npp.02C024290.1 marked by a red
triangle and vertical line.
• Variant Annotation: Table of associated variants, including genomic location, reference
allele, MAF, and predicted consequence.
• Population Statistics: At the variant detailed page, users can view genotype distribution
of each variant site in wild vs. cultivated sugarcane populations.
This module helps assess whether the gene lies within a selection region and which variants may
affect its function.

Step 5. Explore Gene Expression Patterns
The Gene Expression module provides comprehensive expression insights from three
perspectives, helping users evaluate gene activity across different biological contexts (Figure
f):
• Gene Expression Profile for Homologous Genes (Np-X genome)
This heatmap shows the expression patterns of Npp.02C024290.1 and its homologous genes in the Np-X
genome across all transcriptome samples in the database. It allows users to assess whether homologs
of this gene are consistently expressed or tissue-/condition-specific.
• Expression Pattern in Different Layouts
Users can examine gene expression patterns by organizing samples based on different biological
attributes (e.g., tissue). This layout-based view enables detection of differential trends in gene
expression across conditions.
• Expression Pattern in a Specific Transcriptome Dataset (e.g., GEN0013)
In the GEN0013 project, expression levels of Npp.02C024290.1 were analyzed across four developmental
stages. The results show that in all stages, three cultivated sugarcane varieties consistently
exhibit higher expression compared to wild sugarcane, suggesting possible domestication-related
regulatory divergence.
Step 6. Perform Differential Expression Analysis in “DegPattern”
By accessing the DegPattern module (Figure g), users can:
• View volcano plots of DEGs in GEN0013.
• Download lists of upregulated/downregulated genes.
• Search for Npp.02C024290.1 within DEG lists and view summary statistics such as log2 fold change
and p-value.
• Visualize expression changes via a sample-level heatmap.
2.3. Case 2: SUT4 -- A Conserved Gene Involved in Sucrose Transport
This case study demonstrates how SugarcaneOmics can assist researchers in identifying and characterizing important genes involved in sugar metabolism, using the SUT4 gene as an example.
Step 1: Searching for the Gene of Interest
To begin exploring SUT4, users can simply enter the gene name "SUT4" in the database's
search panel
(Figure a). The resulting table includes gene ID information, annotation and associated orthogroups.
From the search results, users can locate the Saccharum spontaneum gene Npp.08D017190.1,
annotated
as SUT4.
Step 2. Exploring Homologs of the Gene.
Clicking on the orthogroup ID, such as OG0014187 (Figure b), allows users to explore the
evolutionary context of SUT4. Within the orthogroup page (Figure c), users can visualize
the
distribution of homologous genes across multiple species. By scrolling down, users can access the
multiple sequence alignment section. For SUT4, the alignment reveals high sequence
conservation
among sorghum, R570, and Np-X (Figure d). Previous study have found that orthologs of SUT4
show high
sequence similarity between sugarcane hybrid cultivar R570 and sweet sorghum, suggesting a conserved
role in sucrose loading and transport that may influence sugar accumulation (Healey et al., 2024).

Step 3. Selection Signals and Expression Patterns of the Gene.
Returning to the search result table, users can click directly on the gene ID Npp.08D017190.1
(Figure d) to access the gene detail page. This page aggregates multiple layers of
information
relevant to evolutionary selection and gene expression.
• Selection signals: A genome-wide selection scan (Figure e) reveals that Npp.08D017190.1 was
located near a selection sweep region, indicating possible historical selection for this locus.
• Expression pattern in different layout: Users can visualize expression pattern of
SUT4 across
various sugarcane tissues and developmental stages (Figure f). For SUT4, the data shows
elevated
expression in internodes and during the grand growth and maturation stages, highlighting its likely
involvement in sugar transport during stalk elongation and storage.
Step 4. Expression in Specific Datasets and Differential Expression Analysis
To dive deeper into specific conditions, users can view SUT4 expression profiles within
individual transcriptomic datasets. For example, in dataset GEN0013, which compares genotypes with
distinct sugar contents, the expression of SUT4 differs significantly between high-sugar cultivars
(SP80-3280, R570) and the low-sugar genotype IN84-58 (Figure g). These differences underscore SUT4's
potential contribution to sugar accumulation.
Moreover, the DegPattern module provides results of differential expression analyses for each
project (Figure h). Within GEN0013, users can examine volcano plots to identify significantly up-
and down-regulated genes, download the DEG list, and search for SUT4 (Npp.08D017190.1) to
view
detailed statistics such as log2 fold change and p-value. An interactive heatmap further displays
gene expression across sample groups.
2.4. Case 3: FLS2 – Potential Functional Gene Associated with Disease Resistance in Sugarcane
FLS2 (Flagellin-Sensing 2) is a well-characterized immune receptor in Arabidopsis thaliana, encoding a leucine-rich repeat receptor-like kinase that recognizes bacterial flagellin and activates defense responses (Gómez-Gómez & Boller, 2000). Functional orthologs have been reported in multiple crop species. In rice (Oryza sativa), OsFLS2 (Os04g0618700) can recognize flagellin from certain bacterial species and triggering immune responses (Wang et al., 2015). In maize (Zea mays), ZmFLS2 (Zm00001eb070510) has been implicated in defense responses and is located near resistance QTLs for northern and southern leaf blight (Hartwig et al., 2023). The sorghum (Sorghum bicolor) ortholog Sobic.006G217900 is upregulated in a resistant genotype inoculation with grain mold fungi, whereas no similar induction was observed in the susceptible genotype (Nida et al., 2021). The conserved function of this gene across multiple crop species suggests that it may also play a role in disease resistance in sugarcane.
The following case study demonstrates how SugarcaneOmics can assist users in exploring the potential function of sugarcane FLS2.
To begin the investigation, users can search for “FLS2” in the database search bar (Figure a). This retrieves a list of annotated sugarcane genes across multiple genomes potentially related to FLS2-like receptor kinases. At the top of the search results table is CC06g273050, a gene from the hybrid cultivar CC-01-1940. Users can click the gene ID (Figure b) to explore detailed information about this gene and its homologs across species.
After clicking on CC06g273050, users are directed to the gene detail page, where they can view expression patterns of its homologs in Saccharum spontaneum Np-X across all transcriptome samples. In the heatmap, two homologs—Npp.06B018670.1 and Npp.06A019290.1—stand out with higher expression levels than other homologous genes, suggesting potential biological relevance (Figure c).

Users can further explore the Differential Expression Gene module on the same gene detail page to
examine whether this gene exhibits a distinct expression pattern in disease-related transcriptome
projects (e.g., GEN0053) (Figure d).
Results from GEN0053, which includes samples from both resistant cultivar ROC22 and susceptible
cultivar MT11-610, reveal that the two genes Npp.06B018670.1 and Npp.06A019290.1 are consistently
upregulated across multiple time points following pathogen inoculation (Figure d). Moreover, at
several time points, expression in the resistant cultivar ROC22 is higher than in the susceptible
MT11-610, supporting the two genes as candidate genes potentially involved in sugarcane immune
responses.
3. Resource & Usage
3.1. Genome
Genome collection and gene functional annotation
We collected the genome assembly of Saccharum and related species from public resource.
Gene annotations of 14 assembly (2 S. spontaneum, 1 S. officinarum, 4 S. hybrid cultivar, 3 Erianthus, 3 Miscanthus and 1 Sorghum bicolor accessions) were colected from public resources. We re-performed and integrated the PFAM, Gene Ontology (GO) and Kyoto Encyclopedia of Genes and Genomes (KEGG) annotations using eggNOG-mapper v2 (Cantalapiedra et al., 2021) with the parameters “--evalue 0.0001 --score 60 --go_evidence experimental”.
Comparative genomics and pan-genome analysis
The longest protein sequences of each gene were extracted from the gene annotation files for each species. OrthoFinder (v2.5.5) (Emms and Kelly, 2019) was used to identify the gene cluster of orthogroups with default parameters. From the clustering results, we obtain the gene presence and absence profile among sub-species. PanGP (Zhao et al., 2014) is then used to predict the openness of all and core genes to determine if the genes of these sub-species adequately represent the gene diversity of the species.
2.3. Transcriptome
Analysis of gene expression profiles
Using the S. spontaneum Np-X genome
as the reference, GENtoolkit (Gene Expression
Nebulas Toolkit) were employed to perform quantification of gene express profile.
![]()
2.4. Variome
Variation calling and annotation
The raw reads were trimmed with FASTP (Chen et al., 2018) to remove the Illumina adapter and low-quality bases following default parameters. The clean reads were mapped to the S. spontaneum Np-X reference genome and for SNP calling by NVIDIA Clara Parabricks V4.2.0 using the “deepvariant_germline” pipeline (https://www.nvidia.com/en-us/clara/genomics/) with GPU Acceleration. Beagle (v4.0) (Browning et al., 2018) was used to impute the missing genotypes for each chromosome with default parameters. Variant annotation was performed using the Variant Effect Predictor (VEP) tool from Ensembl (release 84). The reference genome and annotation file were first converted into a VEP-compatible format using the gtf2vep.pl script. Variants were then annotated with the variant_effect_predictor.pl script in offline mode, using the pre-processed reference genome and annotation files to predict functional consequences.
Identification of selective sweeps
The selective sweeps under artificial selection during domestication and improvement were detected by three different strategies, nucleotide diversity, FST and XPCLR (Chen et al., 2010). Nucleotide diversity and FST values were calculated using VCFtools (v0.1.13) (Danecek et al., 2011). The XP-CLR analysis was run using XPCLR program (https://github.com/hardingnj/xpclr). The calculation of the three indices was performed with sliding window and step size set for each species and the number of SNP within the sliding window was controlled between 30-50. For each method, windows with top 10% score were joined as putative selective regions by BEDTools (v2.28) (Quinlan and Hall, 2010). Finally, genes occur with the selective regions detected by at least 2 methods were considered to be candidate selected genes.
2.5. FeatureGenes
The FeatureGenes module compiles sugarcane transcription factor families annotated through in-house pipelines, along with candidate functional genes involved in key agronomic trait regulatory networks, identified via literature curation and comparative genomics approaches (Supplementary Materials, Supplementary Figure 4), offering critical clues for functional genomics research.
2.6. Varieties
The Varieties module integrates breeding information and basic statistics for 1,096 sugarcane germplasms from the Germplasm Resources Information Network (GRIN) to support germplasm screening.
2.7. Downloads
SugarcaneOmics provides data downloading for free, from the Downloads page, compressed files are prepared on the FTP server.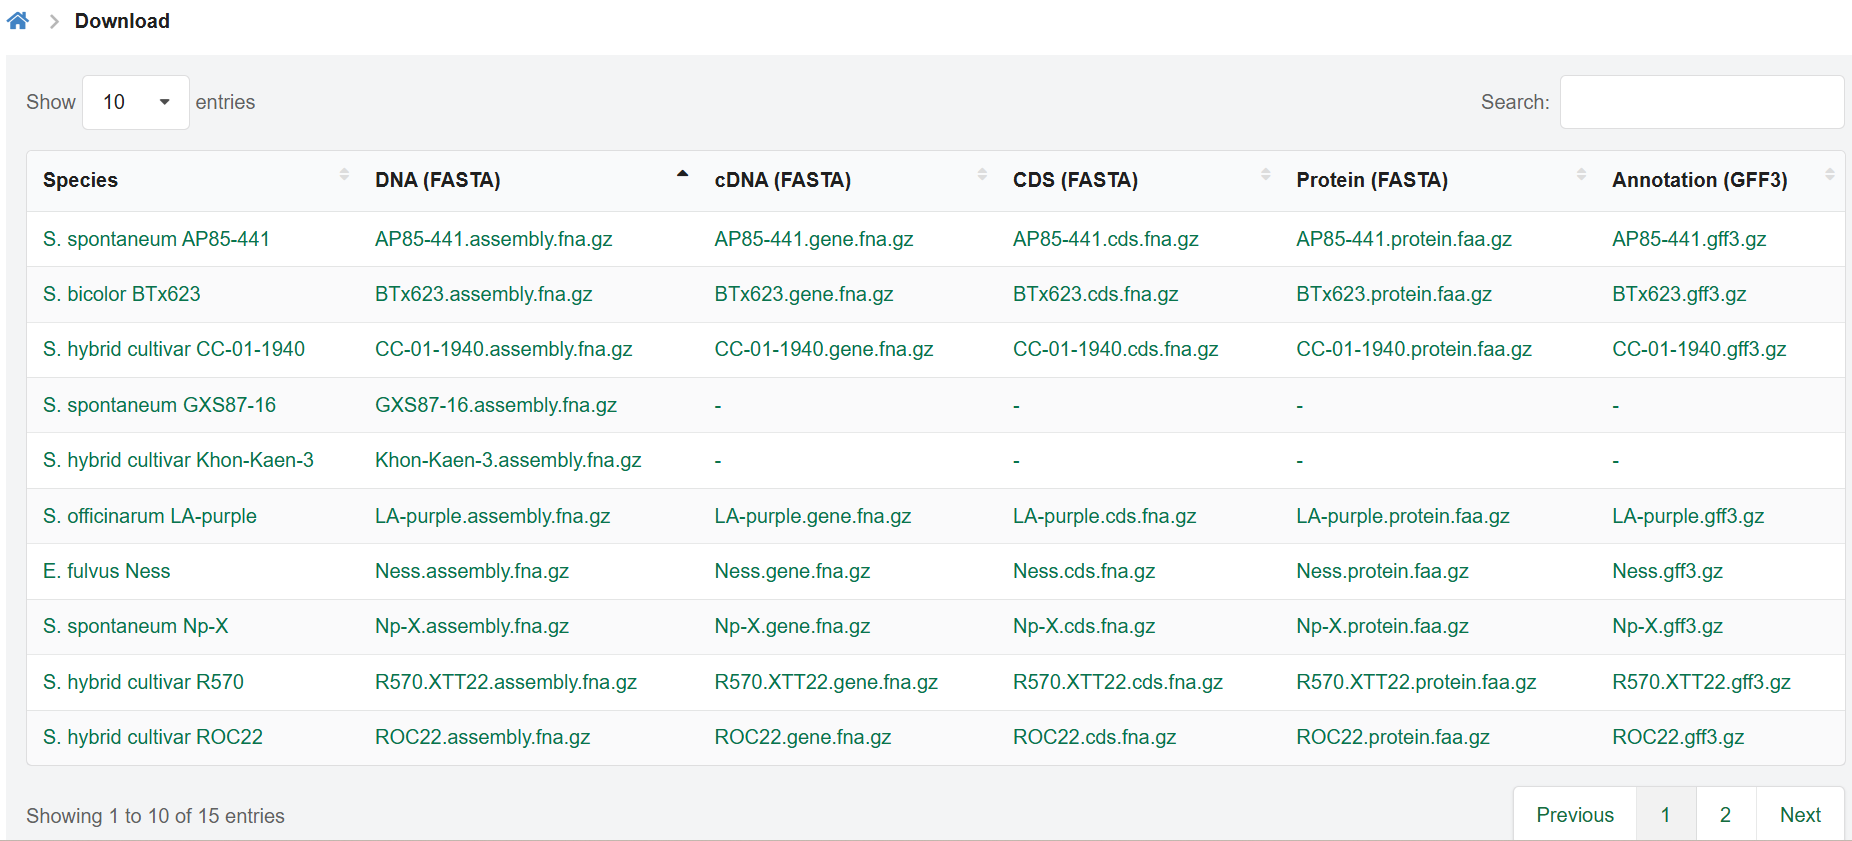
3. Tools & Usage
3.1 BLAST
The genome, CDS, and protein sequences of 10 accessions are provided for BLAST. You can input at most 20 sequences as query. Self-uploading sequences are also accepted as BLAST subject. Advanced parameters are available for you to adjust.
The result of BLAST (genomic region or gene) is linked to the corresponding elements in the database. Result of all BLAST formats are provided for visualization or download.

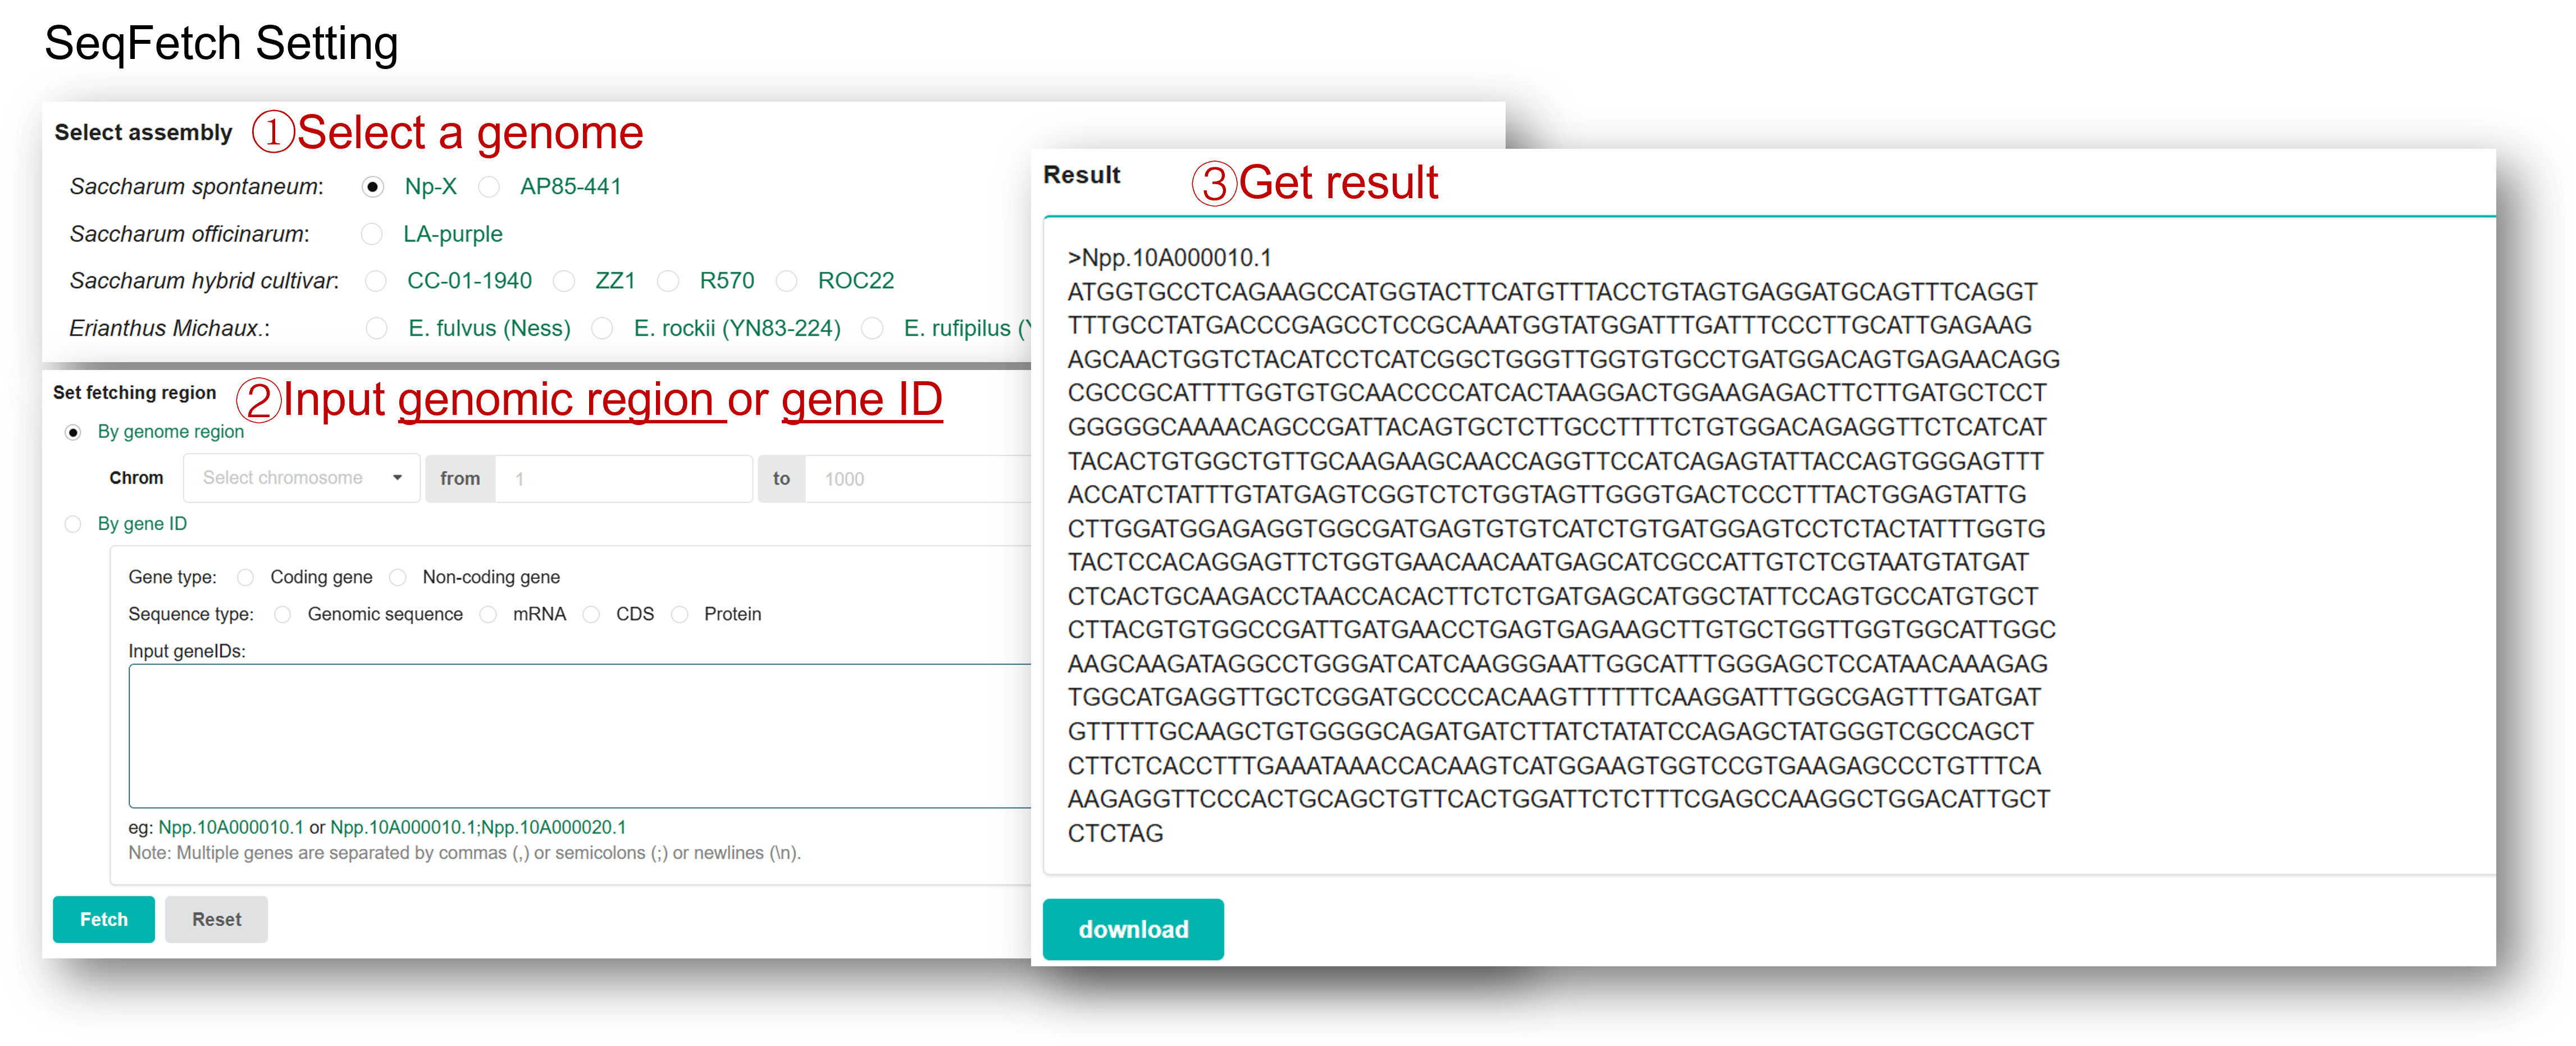
3.2 SeqFetch
SeqFetch is a tool for fast getting of sequence of genomic region, gene, mRNA, CDS, and/or protein from 10 soybean genomes. You can select a reference genome and then extract/download any kind of sequence mentioned above for a single query or query list.
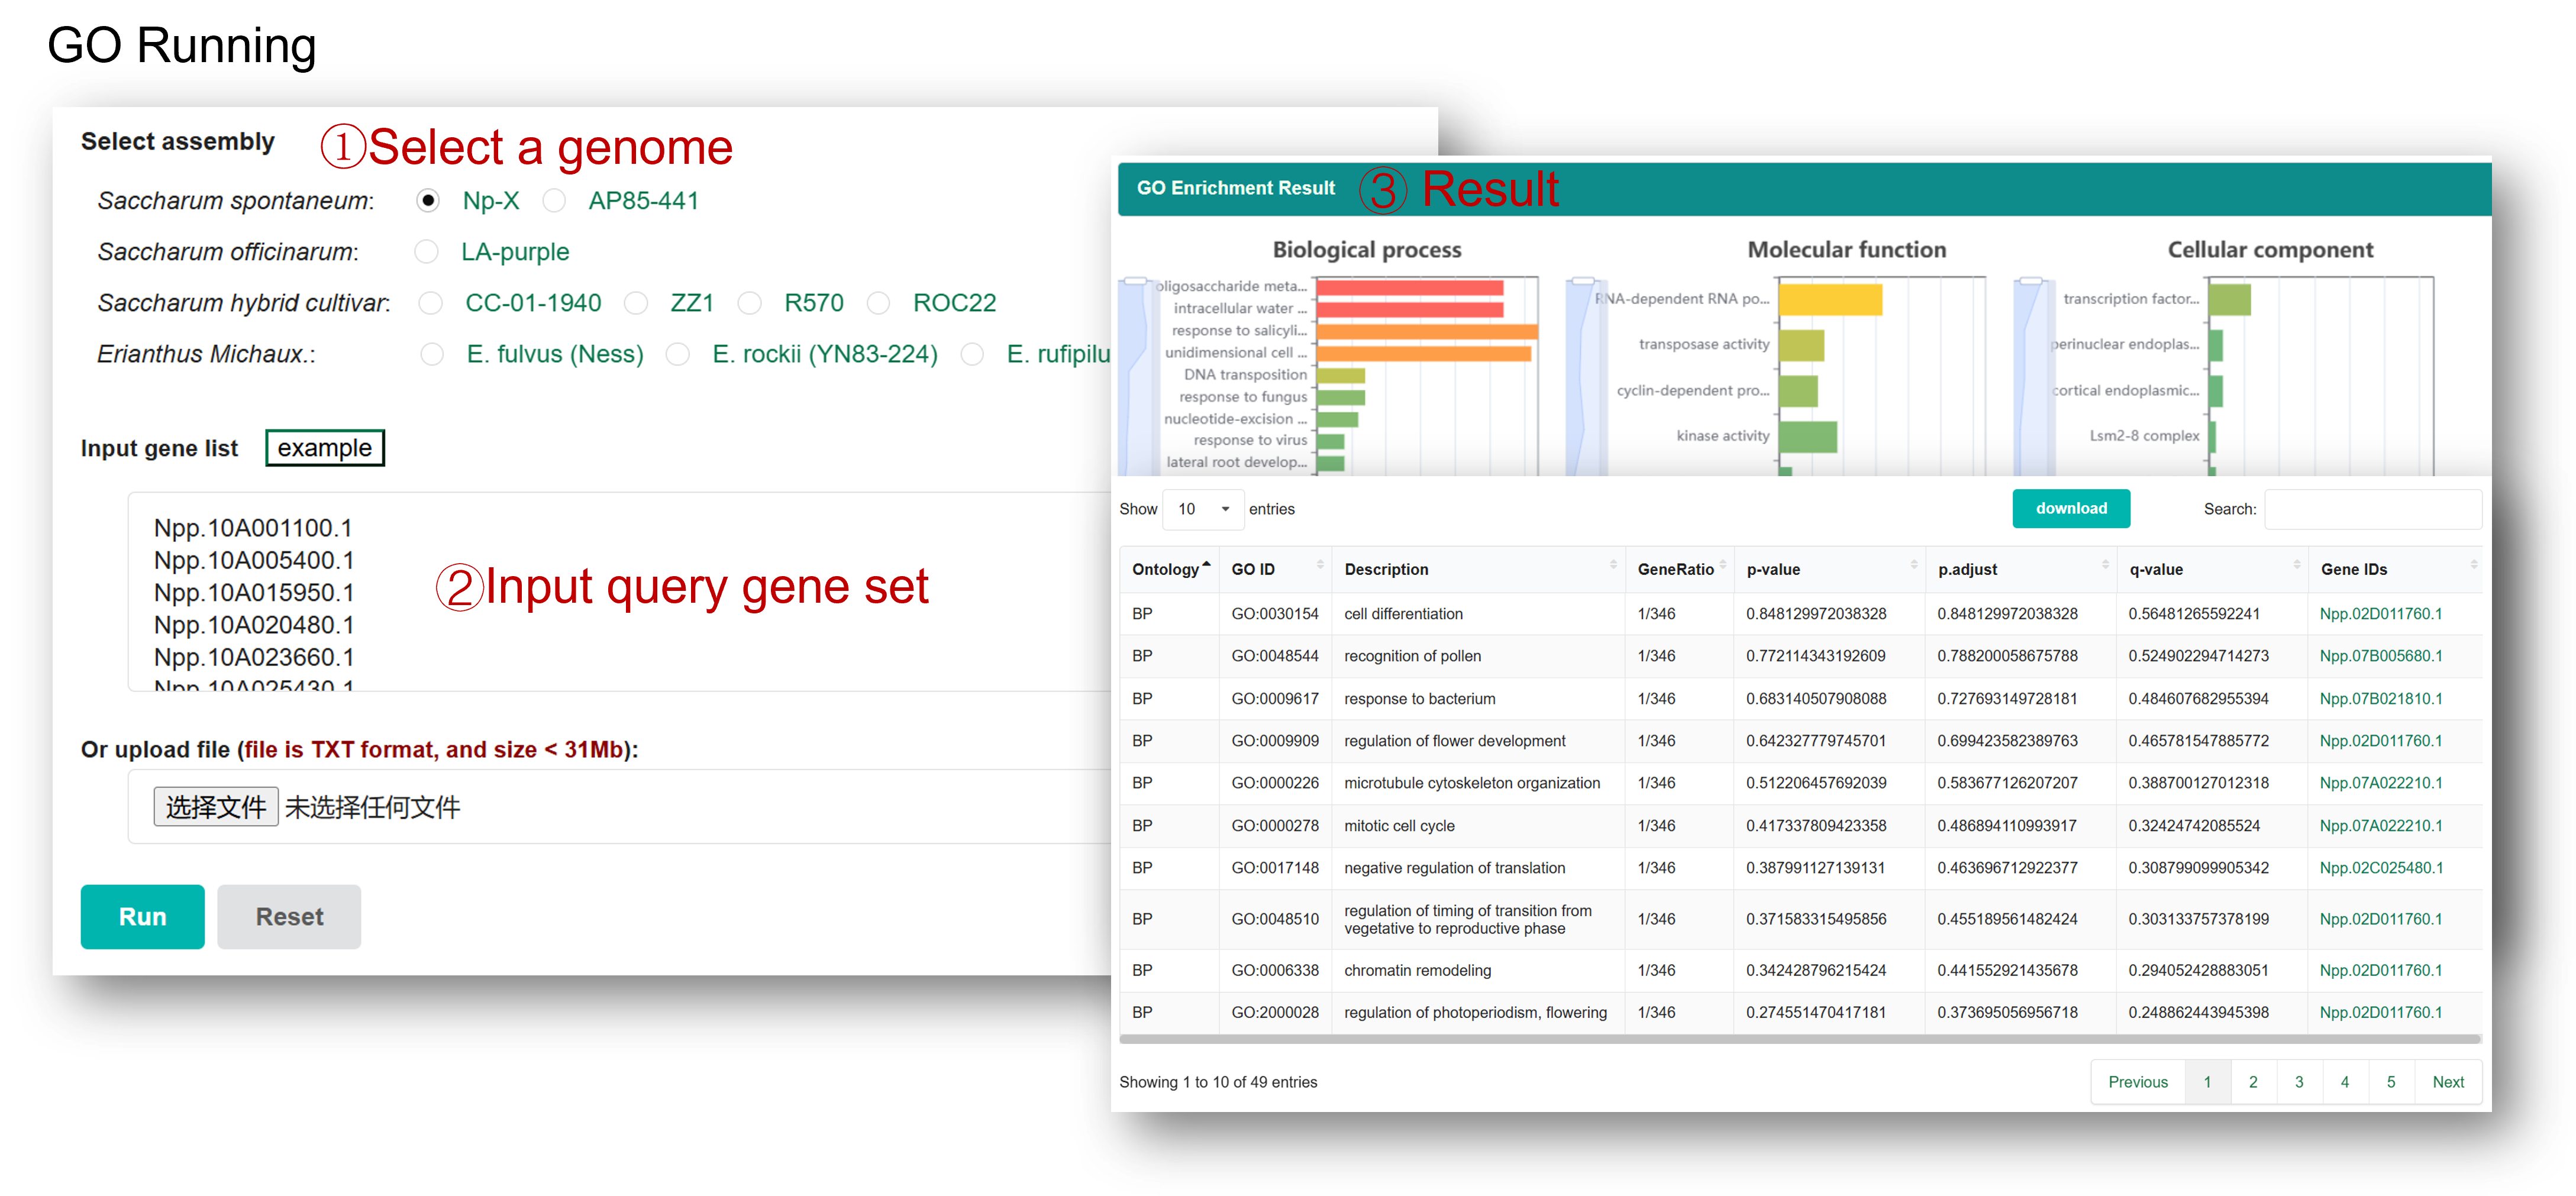
3.3 GO Enrichment
The GO Enrichment tool is developed to perform gene ontology enrichment analysis with a set of gene IDs of interest provided by users
3.4 KEGG Enrichment
The KEGG Enrichment tool is developed to perform pathway enrichment analysis with a set of gene IDs of interest provided by users
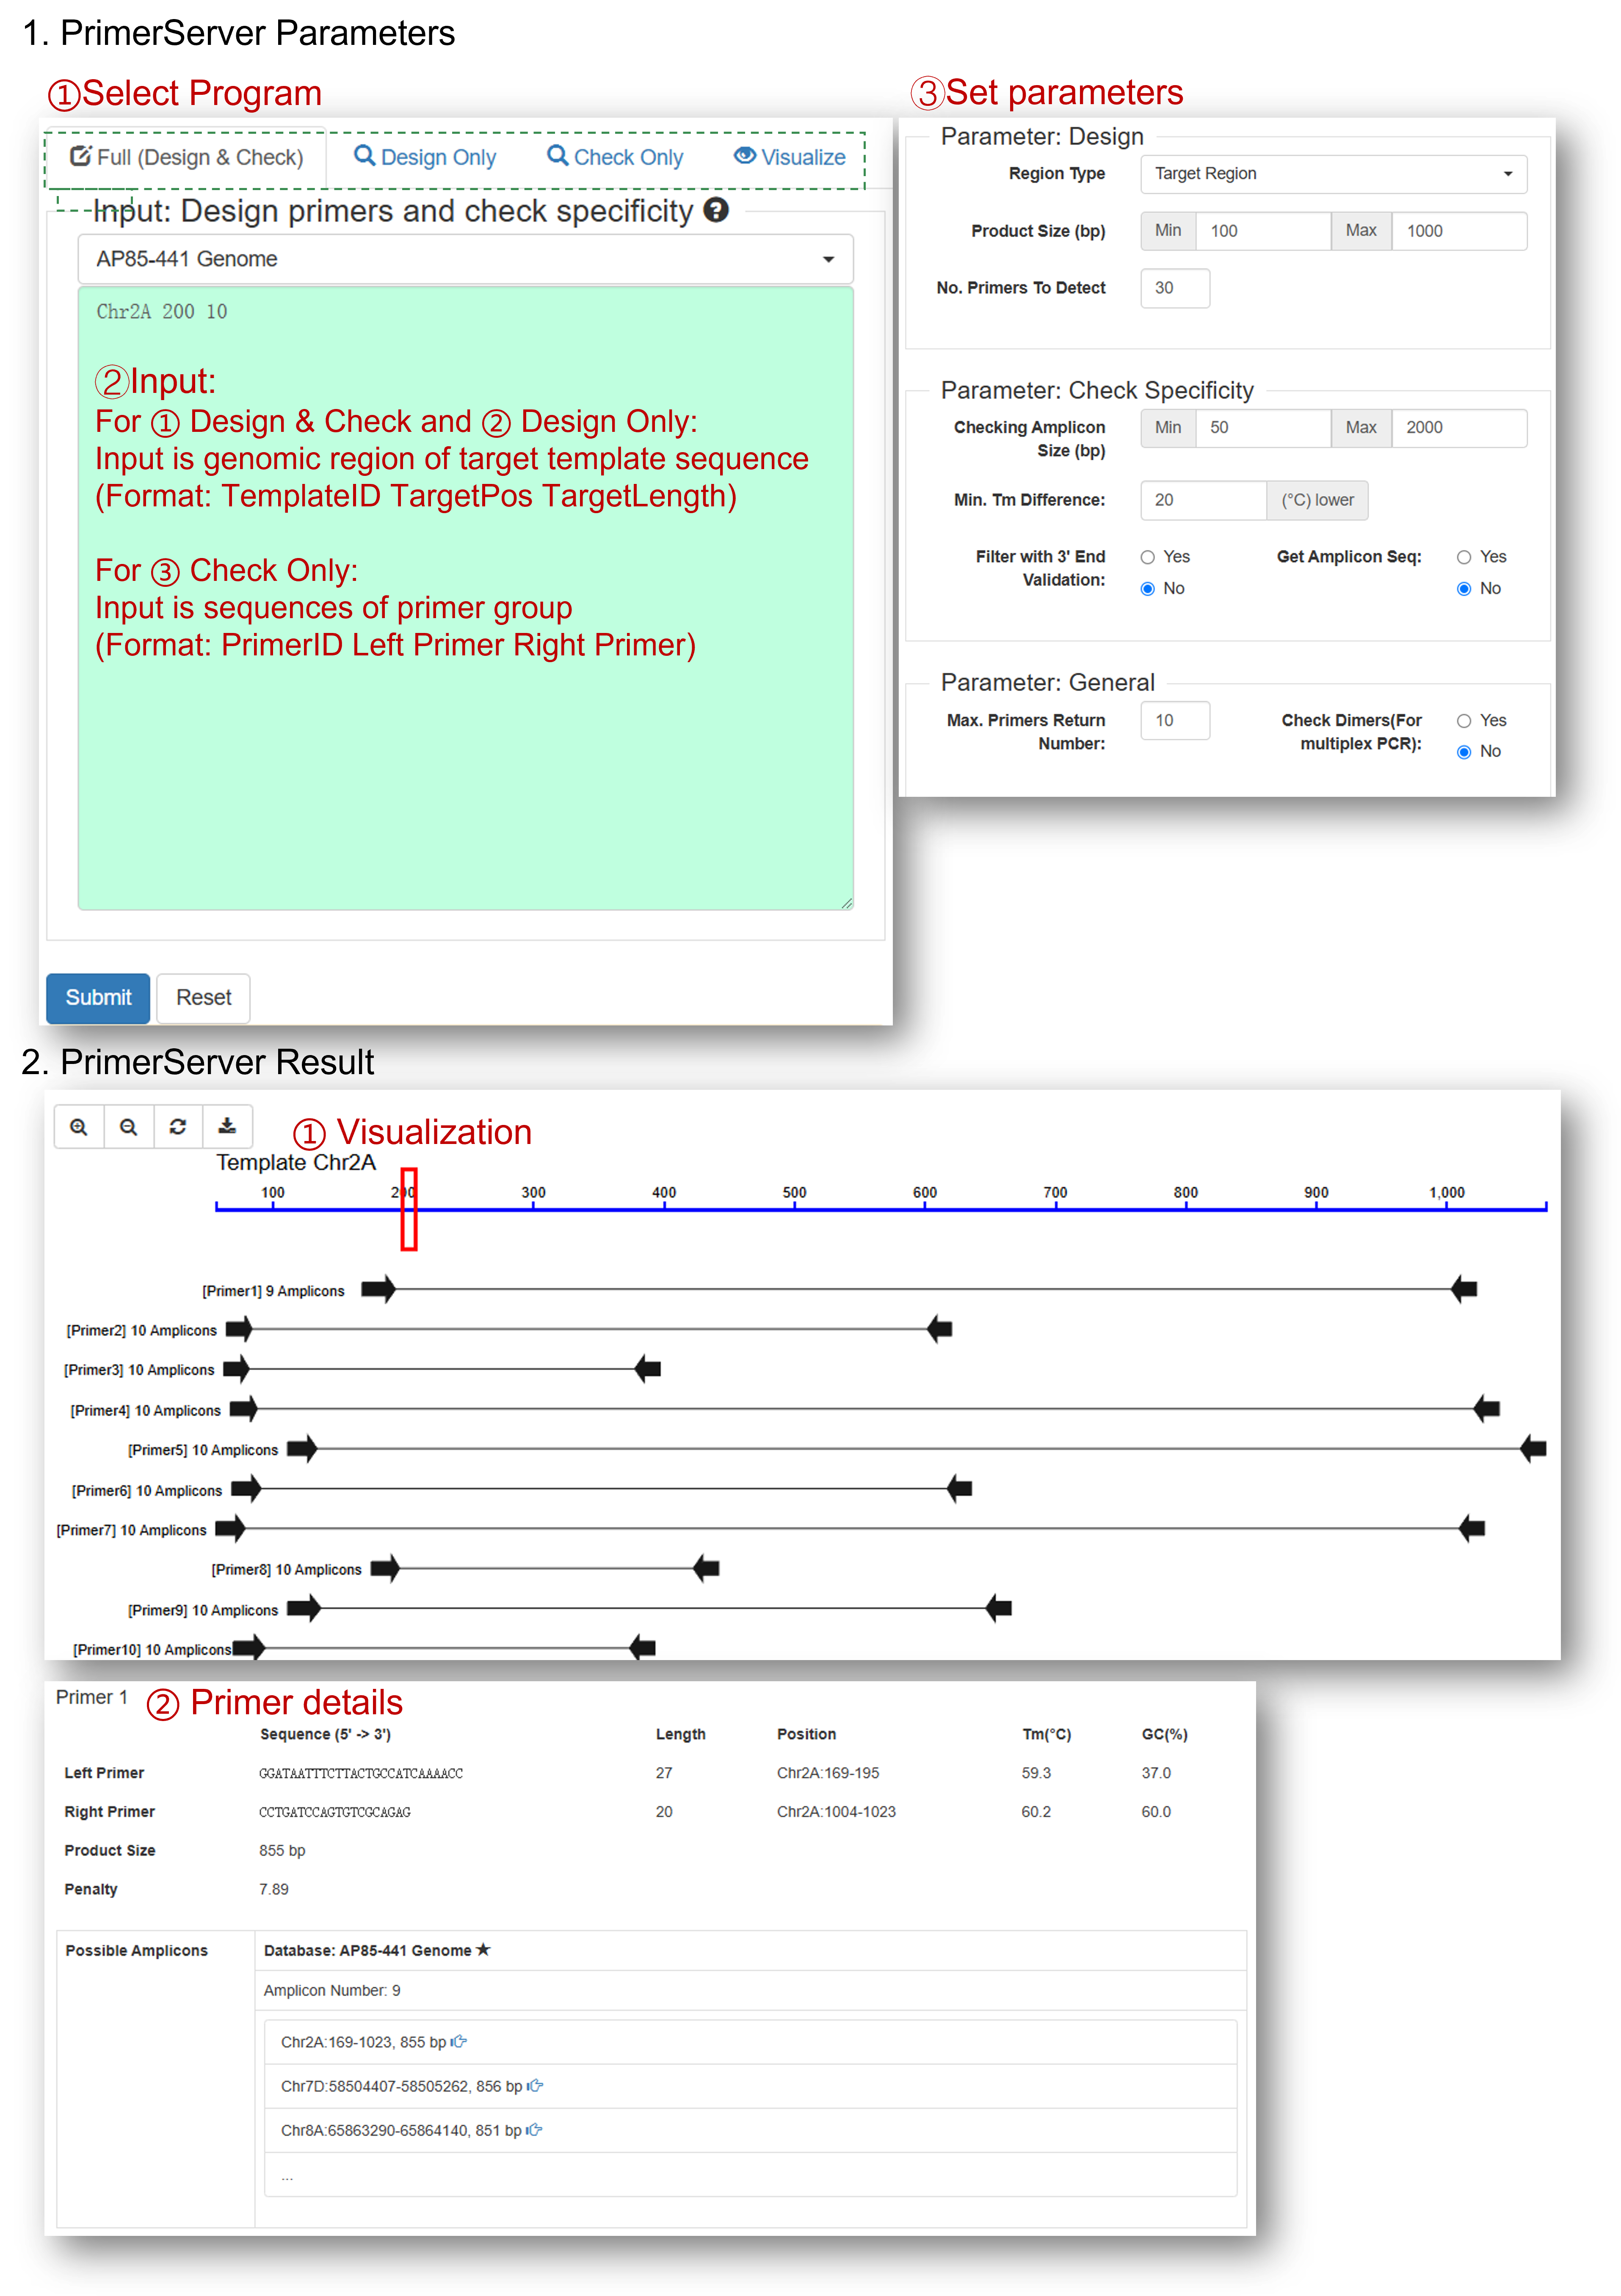
3.5 PrimerServer
The Primer Server (https://github.com/billzt/PrimerServer2) tool is deployed for efficiently site election, primer design, specificity checking and data presentation
3.6 PIN (Protein Interaction Network) Miner
The Protein Interaction Network module was constructed utilizing the PPI Predict function in TBtools (v2.146) (Chen et al., 2023). First, protein sequences and protein interaction data for Oryza sativa Japonica Group, the monocot model organism, were downloaded from the STRING database (v12.0) (https://string-db.org/). Next, the primary transcript for each gene locus from the sugarcane protein sequence file was extracted using an inhouse script. The protein accessions were then mapped to the corresponding gene accessions. Subsequently, the rice protein sequences, protein interaction data, and the sugarcane protein sequences were input into the PPI Predict module of TBtools. The confidence threshold for protein interactions was set to 750, ensuring that only high-confidence interactions were retained in the final predicted sugarcane protein interaction network.

3.7 CRIOff (CRISPR off target) Identifier
Gene editing stands as a pivotal strategy in achieving the dual objectives of high yield and enhanced resistance in sugarcane breeding. However, the complexity of the sugarcane genome, characterized by a high content of repetitive sequences, often leads to off-target effects in the designed sgRNAs. Consequently, the design of robust sgRNAs with high target cleavage efficiency and minimal off-target activity, along with the quantification of such off-target effects, is of paramount importance. To address this, we have developed CRIOff Identifier, a web-based tool for predicting and evaluating off-target effects of sgRNAs in sugarcane gene editing. CRIOff Identifier integrates two published tools for off-target prediction and scoring: Cas-offinder (https://github.com/snugel/cas-offinder) CRISPR-Net (https://github.com/JasonLinjc/CRISPR-Net)

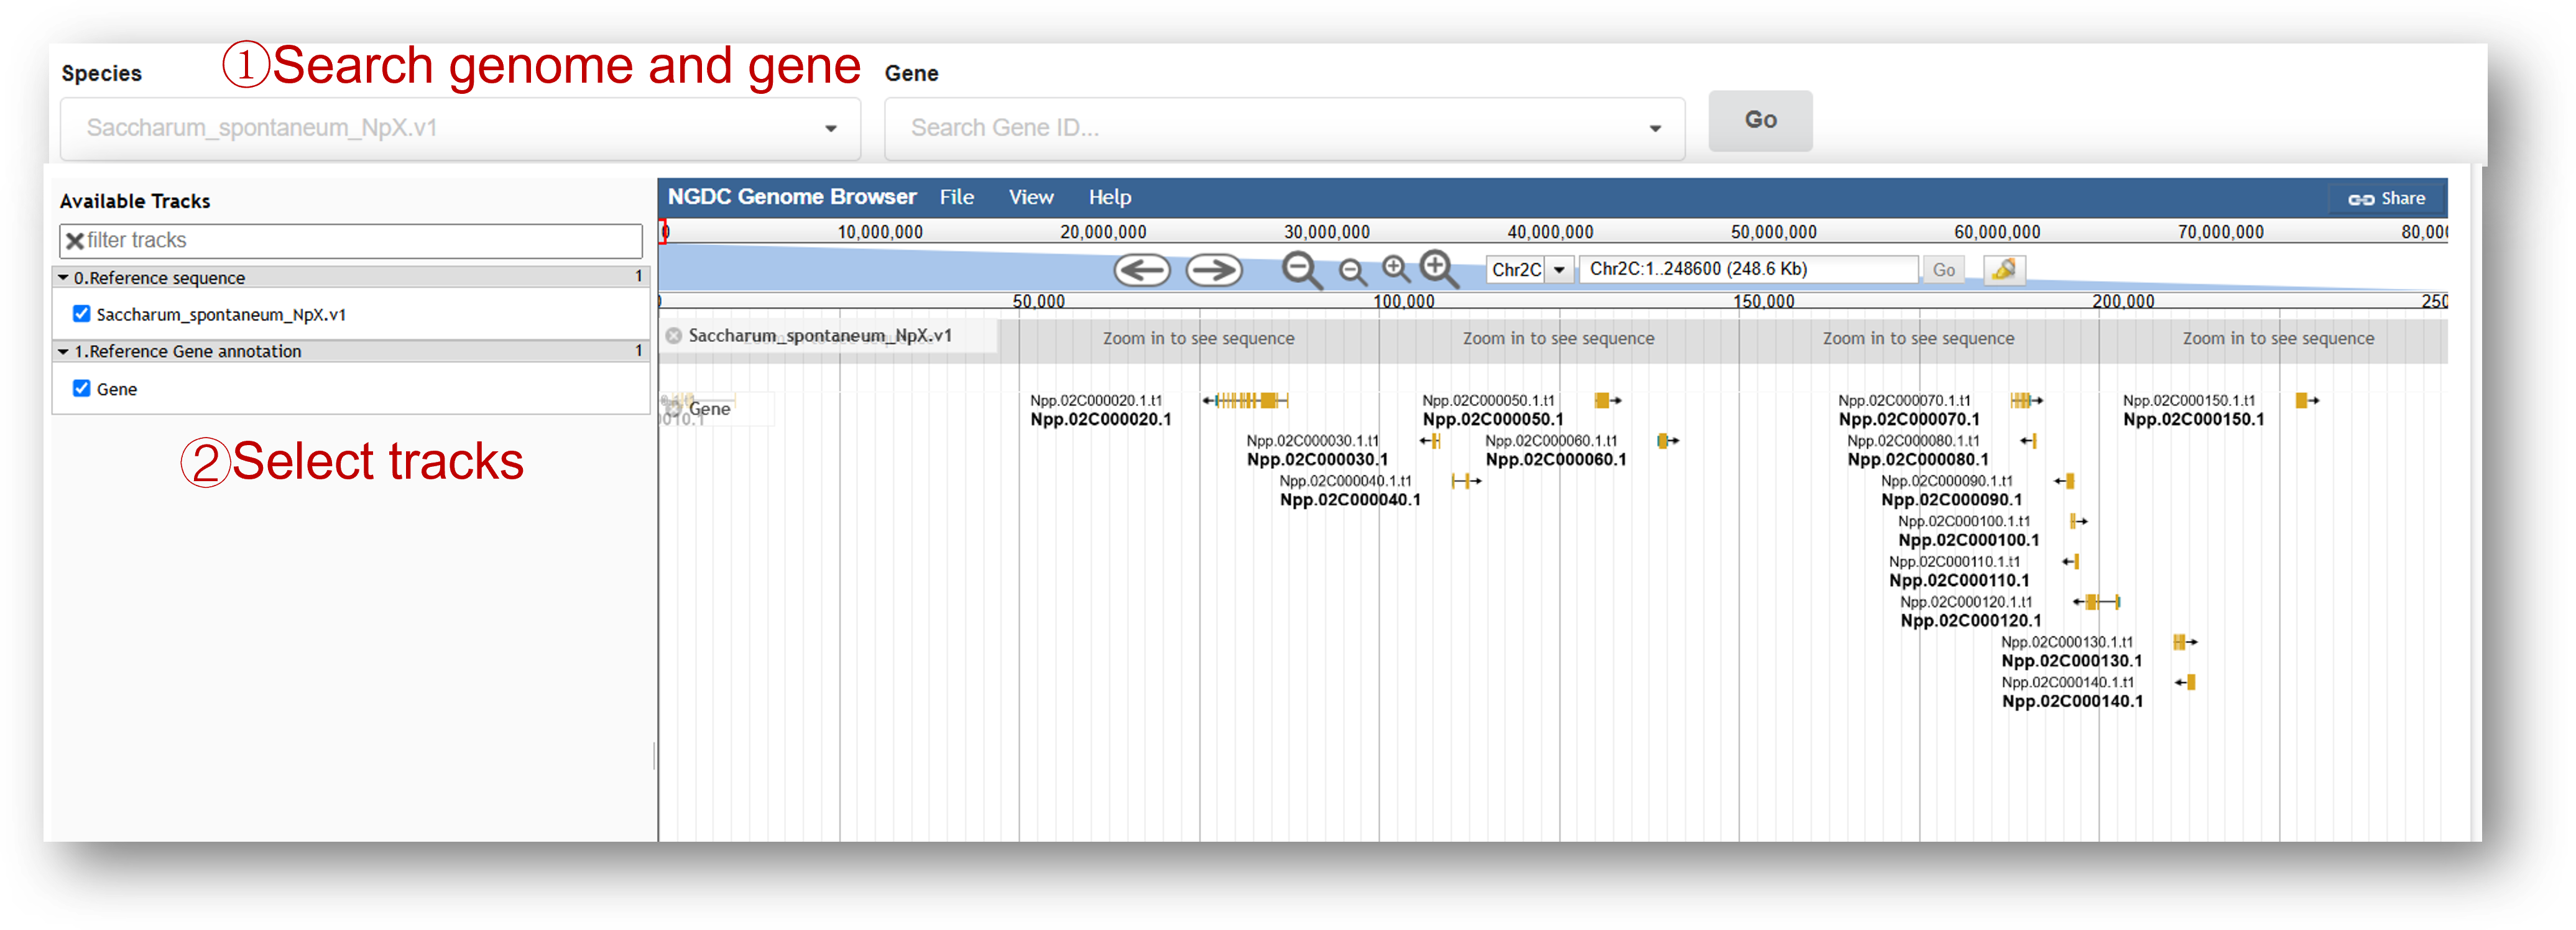
3.7 Visualization
Genome browse xxxx
Reference
Healey AL, Garsmeur O, Lovell JT, et al. The complex polyploid genome architecture of sugarcane[J]. Nature, 2024, 628(8009): 804-810.
Gómez-Gómez, L., & Boller, T. (2000). FLS2: An LRR receptor-like kinase involved in the perception of the bacterial elicitor flagellin in Arabidopsis. Molecular Cell, 5(6), 1003–1011. https://doi.org/10.1016/S1097-2765(00)80265-8
>Hartwig, T., Banf, M., Prietsch, G. P., Zhu, J.-Y., Mora-Ramírez, I., Schippers, J. H. M., Snodgrass, S. J., Seetharam, A. S., Huettel, B., Kolkman, J. M., Yang, J., Engelhorn, J., & Wang, Z.-Y. (2023). Hybrid allele-specific ChIP-seq analysis identifies variation in brassinosteroid-responsive transcription factor binding linked to traits in maize. Genome Biology, 24(1), 108. https://doi.org/10.1186/s13059-023-02909-w
Nida, H., Lee, S., Li, Y., & Mengiste, T. (2021). Transcriptome analysis of early stages of sorghum grain mold disease reveals defense regulators and metabolic pathways associated with resistance. BMC Genomics, 22(1), 295. https://doi.org/10.1186/s12864-021-07609-y
Wang, S., Sun, Z., Wang, H., Liu, L., Lu, F., Yang, J., Zhang, M., Zhang, S., Guo, Z., Bent, A. F., & Sun, W. (2015). Rice OsFLS2-Mediated Perception of Bacterial Flagellins Is Evaded by Xanthomonas oryzae pvs. Oryzae and oryzicola. Molecular Plant, 8(7), 1024–1037. https://doi.org/10.1016/j.molp.2015.01.012