1. Overview

The Tropical Crop Omics Database is a data portal that serves research on selective breeding and trait improvement for tropical crops. The database integrates the genome, variome, transcriptome, and cultivar data of 15 tropical crops, including cassava, rubber tree, coffee, and more. Using genes as the fundamental units, the database correlates multidimensional omics data to achieve the integration of various omics data within a single species. Furthermore, by leveraging homologous gene information, researchers can compare the omics characteristics among multiple species, enabling cross-species studies. Moreover, the database offers a range of online tools, such as BLAST, Genome Browser, PrimerDesign, Literature Seach, GO Enrichment, KEGG Enrichment, Synteny Viewer and Homolog Finder, to facilitate users in data mining.

2.Species

The Species page provides access to the relevant statistical results of different omics data for each species. Clicking on the data links allows for quick data retrieval.

  • Taking cassava as an example: you can view the taxonomy ID, reference genome version, size of the reference genome, number of reference genes, number of included genome entries, number of variant sites included, number of gene expression profiles included, number of projects included, number of samples included, and number of germplasm entries recorded for cassava.
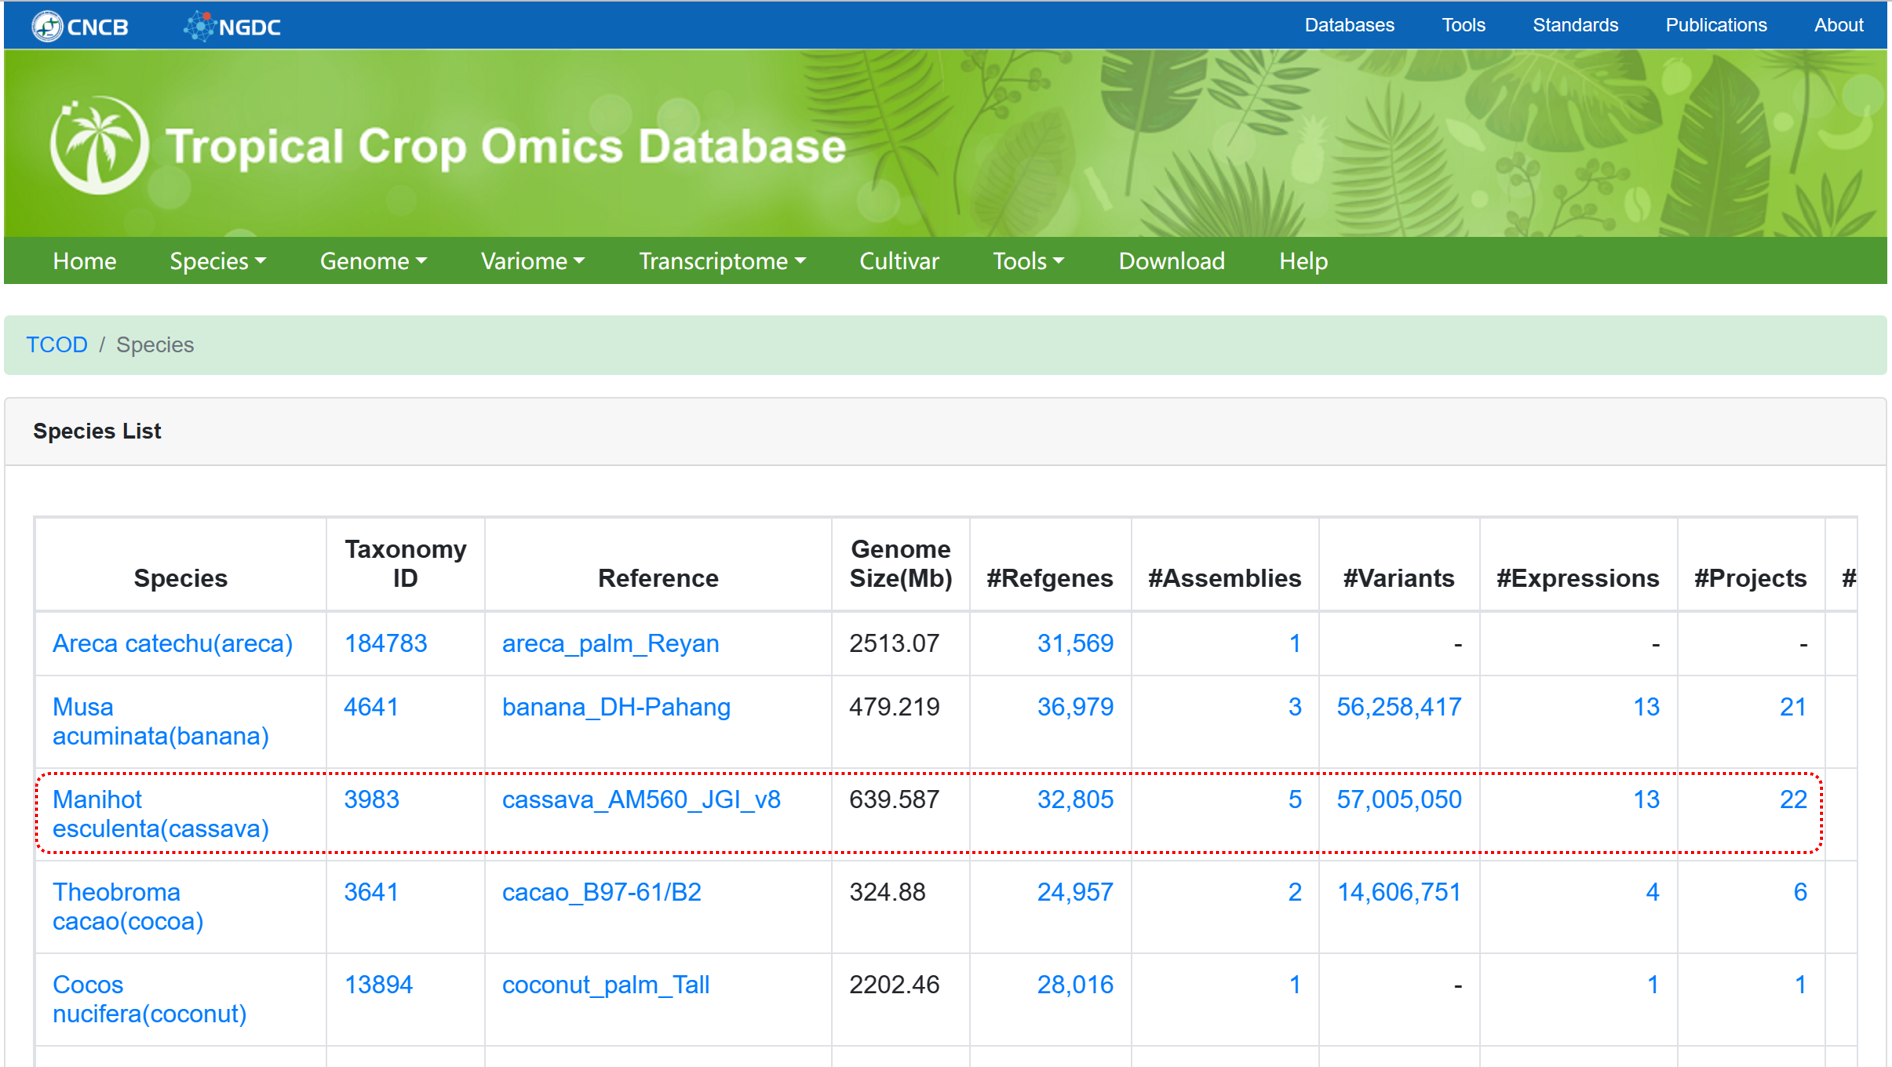
  • Figure 1 The overview of 'Species'

  • By clicking on the species name, you can navigate to a brief scientific introduction page about the corresponding species, including an overview of the species, its geographical distribution, applications, and the history of genome sequencing.
  • Figure 2 A scientific introduction to cassava

    3.Genome

    3.1. Assembly

    The 'Assembly' module offers users high-quality genome sequences. Currently, a collection of 34 chromosome-level assemblies has been obtained from various sources. Specifically, the de novo assembly of cassava varieties A4047 and AM560 was provided by ITBB-CATAS, the de novo assembly of cassava variety W14 was contributed by Hainan University, and the de novo assembly of rubber tree variety CATAS8-79 was supplied by RRI-CATAS. Additional assemblies were downloaded from websites such as NGDC GWH, NCBI Genome, EnsemblPlants, and Phytozome v13.

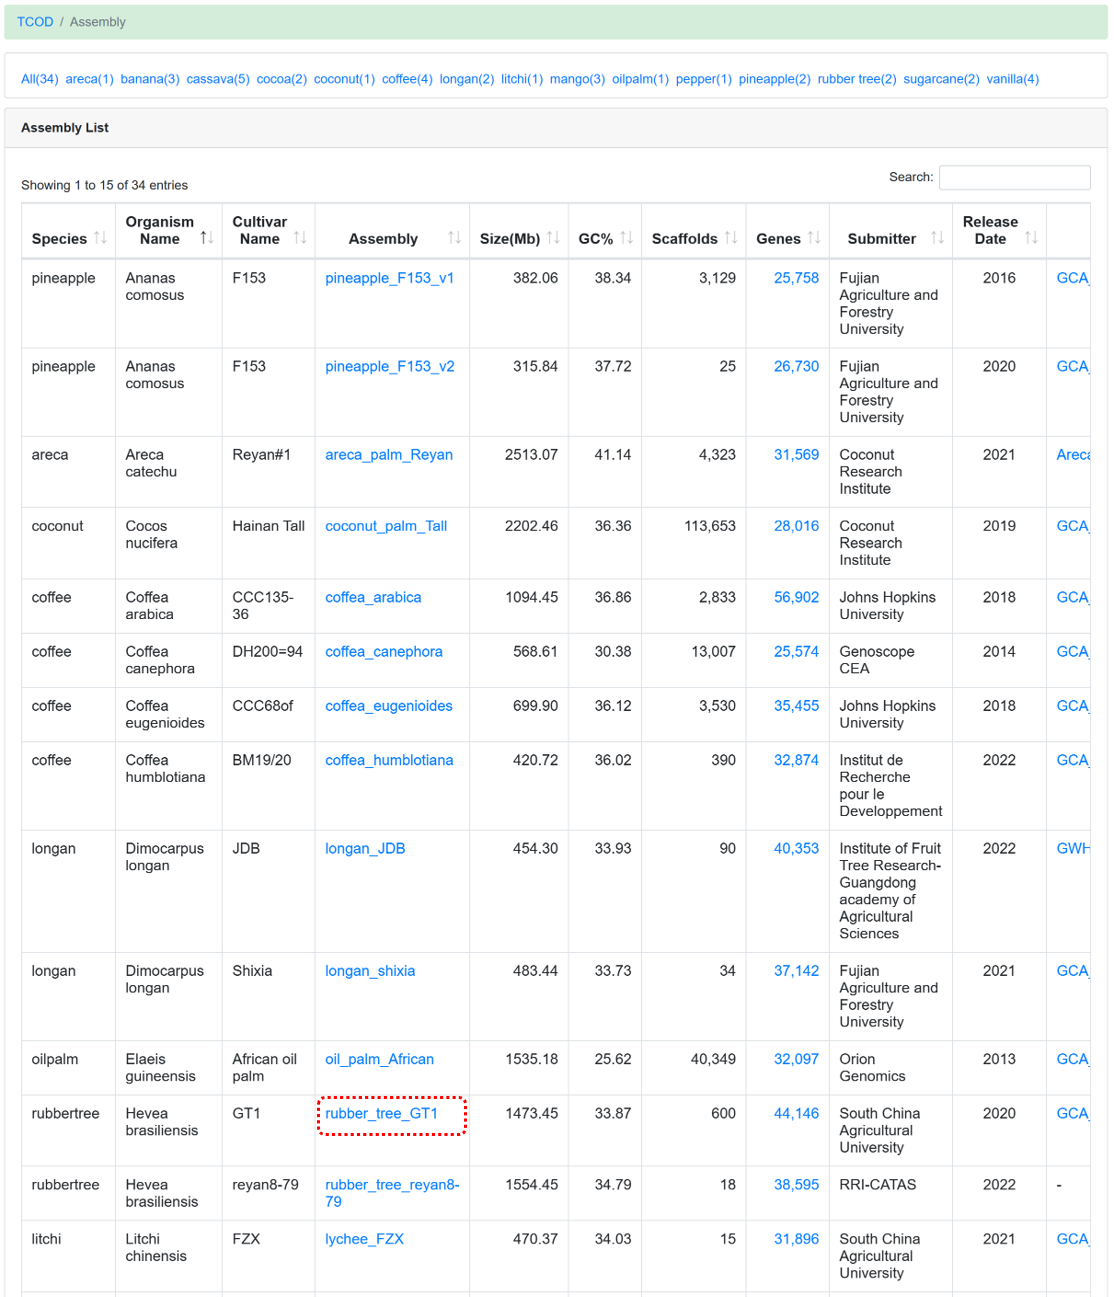
    Figure 3 The overview of 'Assembly' module

    Clicking on each assembly link allows you to view detailed information:

  • Basic information, including sequencing technologies, coverage, total length, scaffold number, N50 value, GC content and published literature.
  • Information about each chromosome, including the length, GC content and the number of genes.
  • The heatmap of gene density distribution on chromosomes, created by the Rideogram package, to visualize the gene-rich regions in each genome.
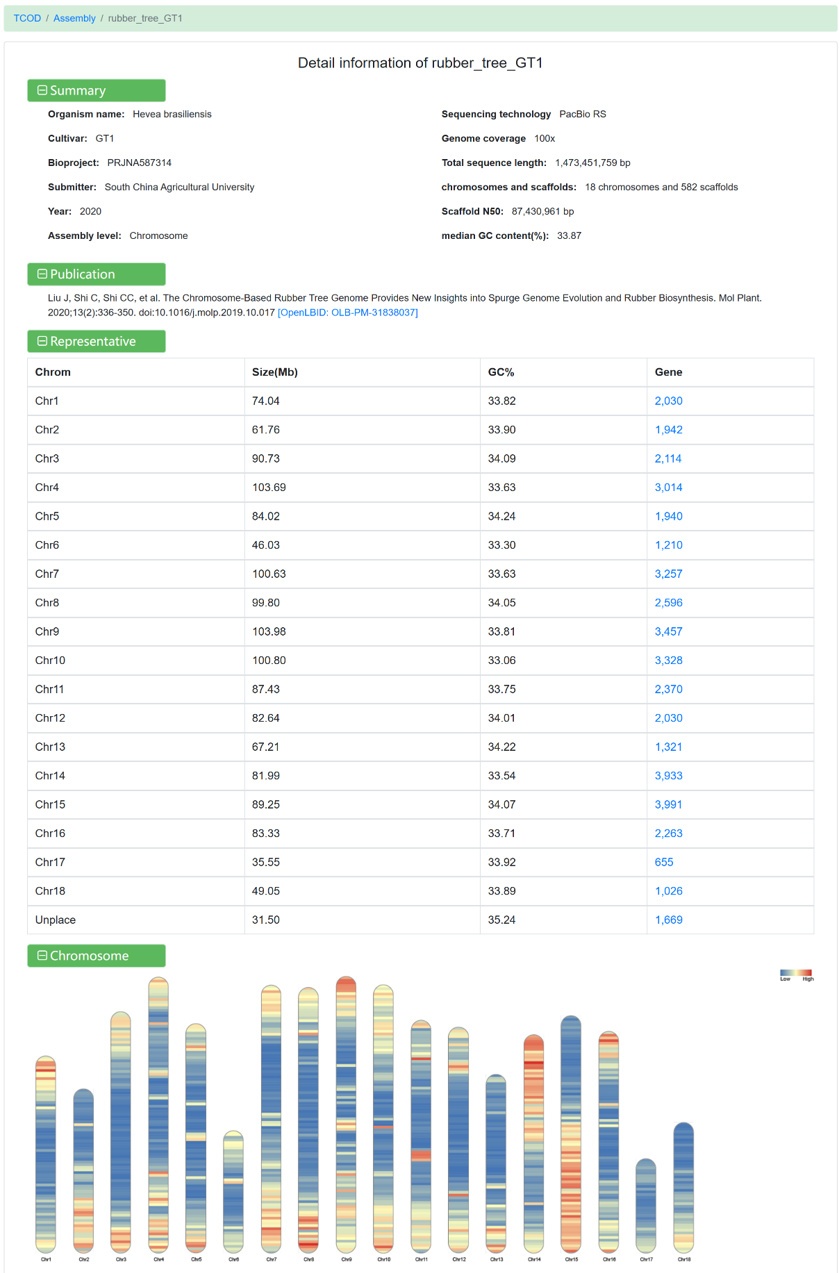
  • Figure 4 The detailed information for rubber_tree_GT1

    3.2. Gene

    The 'Gene' module integrates gene structures and functional information extracted from annotated files for each genome. We have utilized databases such as Nr, UniProt, InterPro, Pfam, and eggNOG-mapper to conduct gene annotation, ensuring comprehensive and reliable annotation information. The page supports advanced searches by selecting genome version, chromosome coordinates, gene name, and gene function.

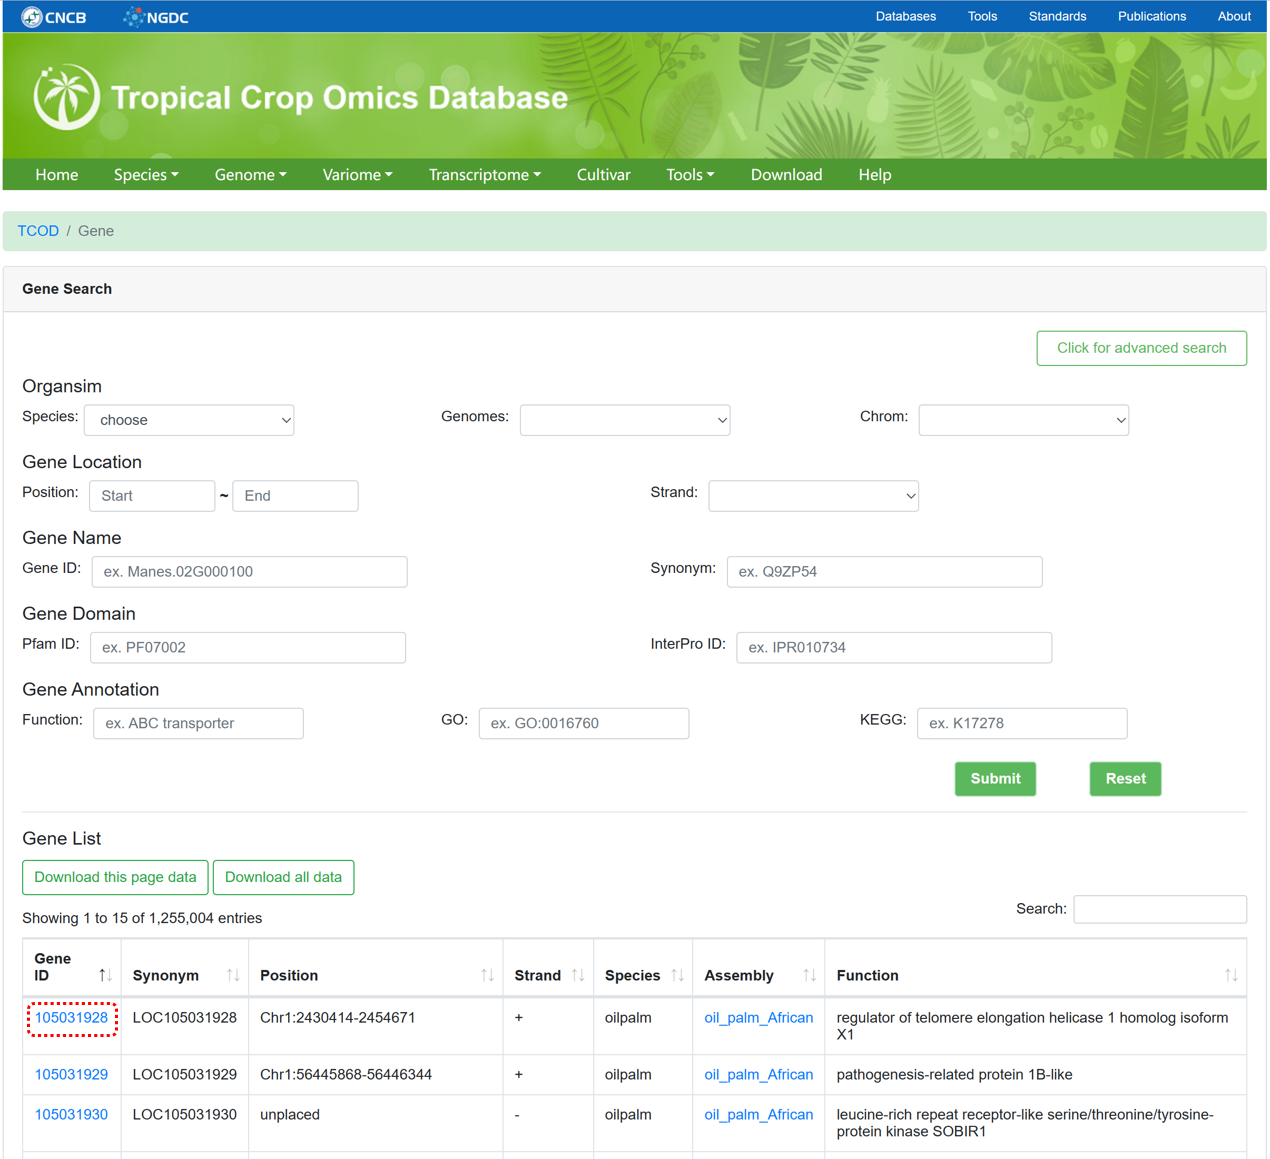
    Figure 5 The overview of 'Gene' module

    Clicking on each gene link allows you to view detailed information:

  • Basic information, including position, length, synonyms, function and corresponding pathway annotations like GO terms and KEGG terms.
  • Genome & Sequence, the nucleic acid and protein sequences of the gene are available, which can be used with the 'BLAST' tool to search for similar sequences in the database.
  • Homolog information, which provides an orthology relationship diagram of the gene and a list of homologous genes identified in genomes of other species.
  • Variant information, if there are variations on the gene, all variations will be displayed in the list.
  • Expression information, providing the gene's expression level for each sample in every project. If the gene is significantly upregulated or downregulated, the corresponding project's comparison will also be listed in the differential expression section.
  • Visualization, using Genome browser to visualize the gene interval.
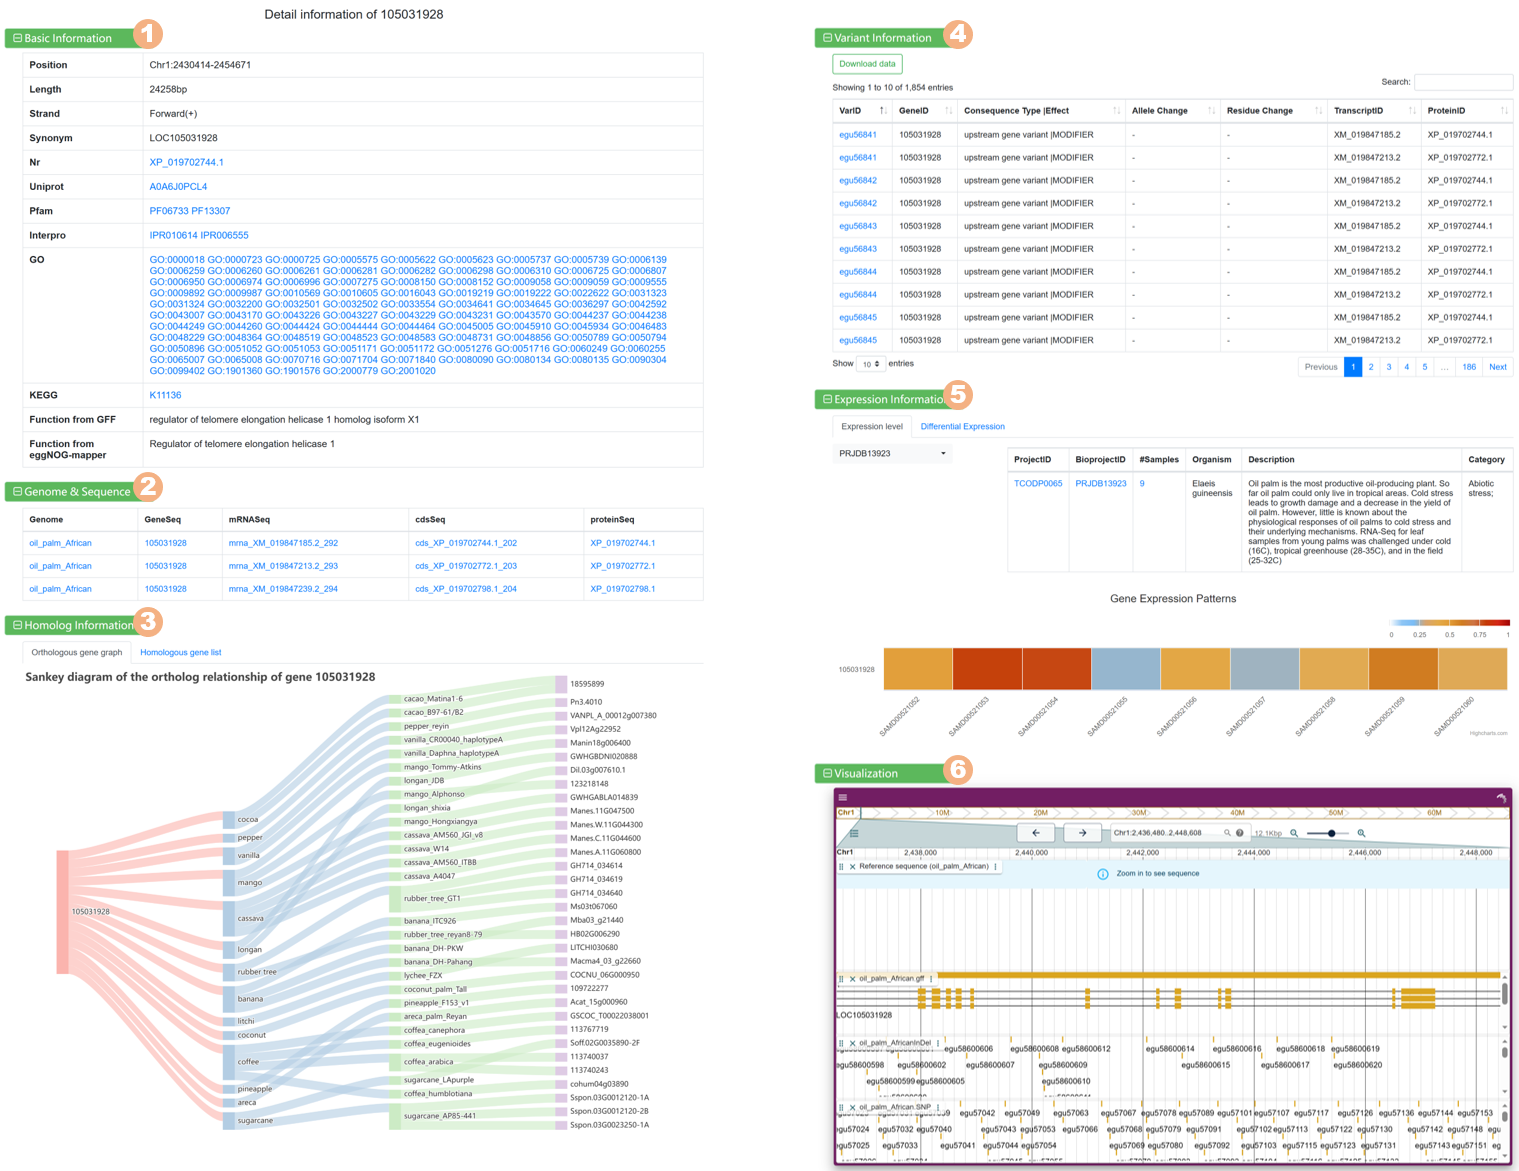
  • Figure 6 The detailed information for each gene

    4.Variome
    4.1. WGS Project

    The 'WGS Project' section provides metadata information for all WGS projects used for variation analysis. The page supports advanced search, data browsing, and data downloading.

  • Advanced search: you can filter datasets by project ID, release date, submission, description, organism and assay type.
  • Data browsing: you can view sample size, run, organism, sequencing technology, brief description, submitter, published literature and timestamp under each project. Clicking on the runs links provides access to download links for the raw sequencing data.
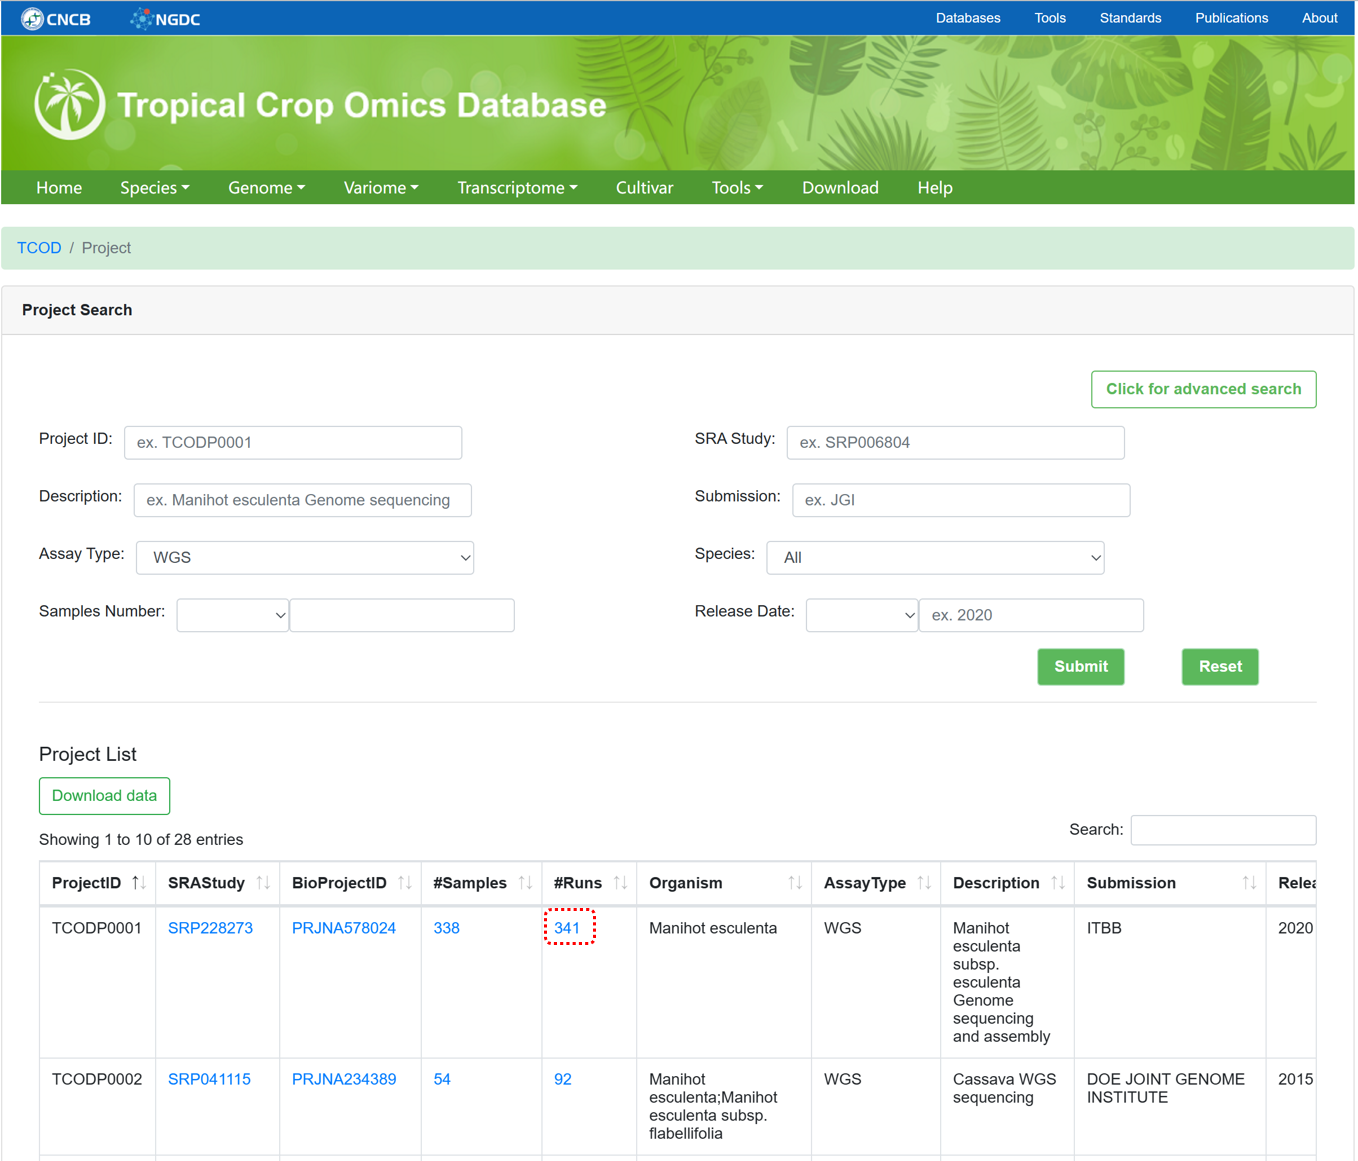
  • Figure 7 The overview of 'WGS Project'

    4.2. WGS Sample

    The 'WGS Sample' section provides metadata information for all WGS samples used for variation analysis. The page supports advanced search, data browsing, and data downloading.

  • Advanced search: you can filter datasets by biosample ID, sample name, cultivar name, project ID, country, submission, organism and assay type.
  • Data browsing: you can view sample name, run, cultivar, geographic information (where the sequencing samples were collected), tissue, sequencing platform, etc. By clicking on the runs links, you can access download links for the raw sequencing data. In addition, the variation gvcf file for each WGS sample can be downloaded. If the sample name closely matches a name in the cultivar data, the corresponding cultivar ID will be provided to help users quickly access germplasm information.
  • Figure 8 The overview of 'WGS Sample'

    4.3. Variation

    By collecting WGS data from different samples and utilizing standard variation analysis pipelines from NGDC GVM, the ‘Variations’ module provides genome-wide variation maps for 10 species. The page consists of three sections:

  • Statistical histogram: provides an overview of the variation site results across different species, presented in the form of a histogram.
  • Advanced search: supports multi-condition dynamic queries based on variants ID, position, variation type, consequence type, minor allele frequency (MAF) value, and gene information.
  • Variant site list: displays the list of variant sites that match the search criteria and returns relevant information for each site.
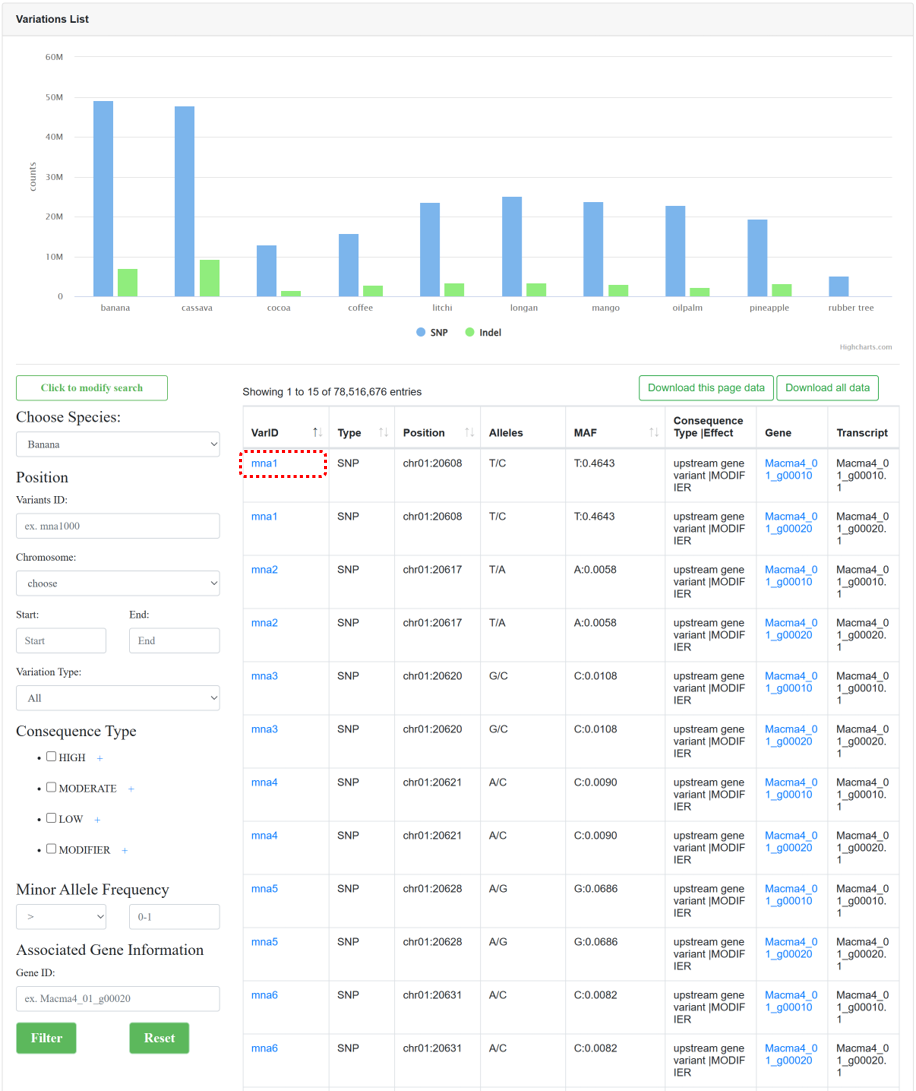
  • Figure 9 The overview of 'Variations' module

    Clicking on each variant link allows you to view detailed information:

  • Basic information, such as variant coordinate, reference and alternative allele, minor allele frequency.
  • Gene annotation information, including gene ID, transcript ID, protein ID, allele change, residue change and consequence type.
  • Population diversity, a list of genotypes for variant in different sample, clicking on the sample name to go to the 'WGS Samples' section for metadata information.
  • Allele distribution, using pie charts to visualize differences in the distribution of genotypes across populations.
  • Visualization, using Genome browser to visualize the variation interval.
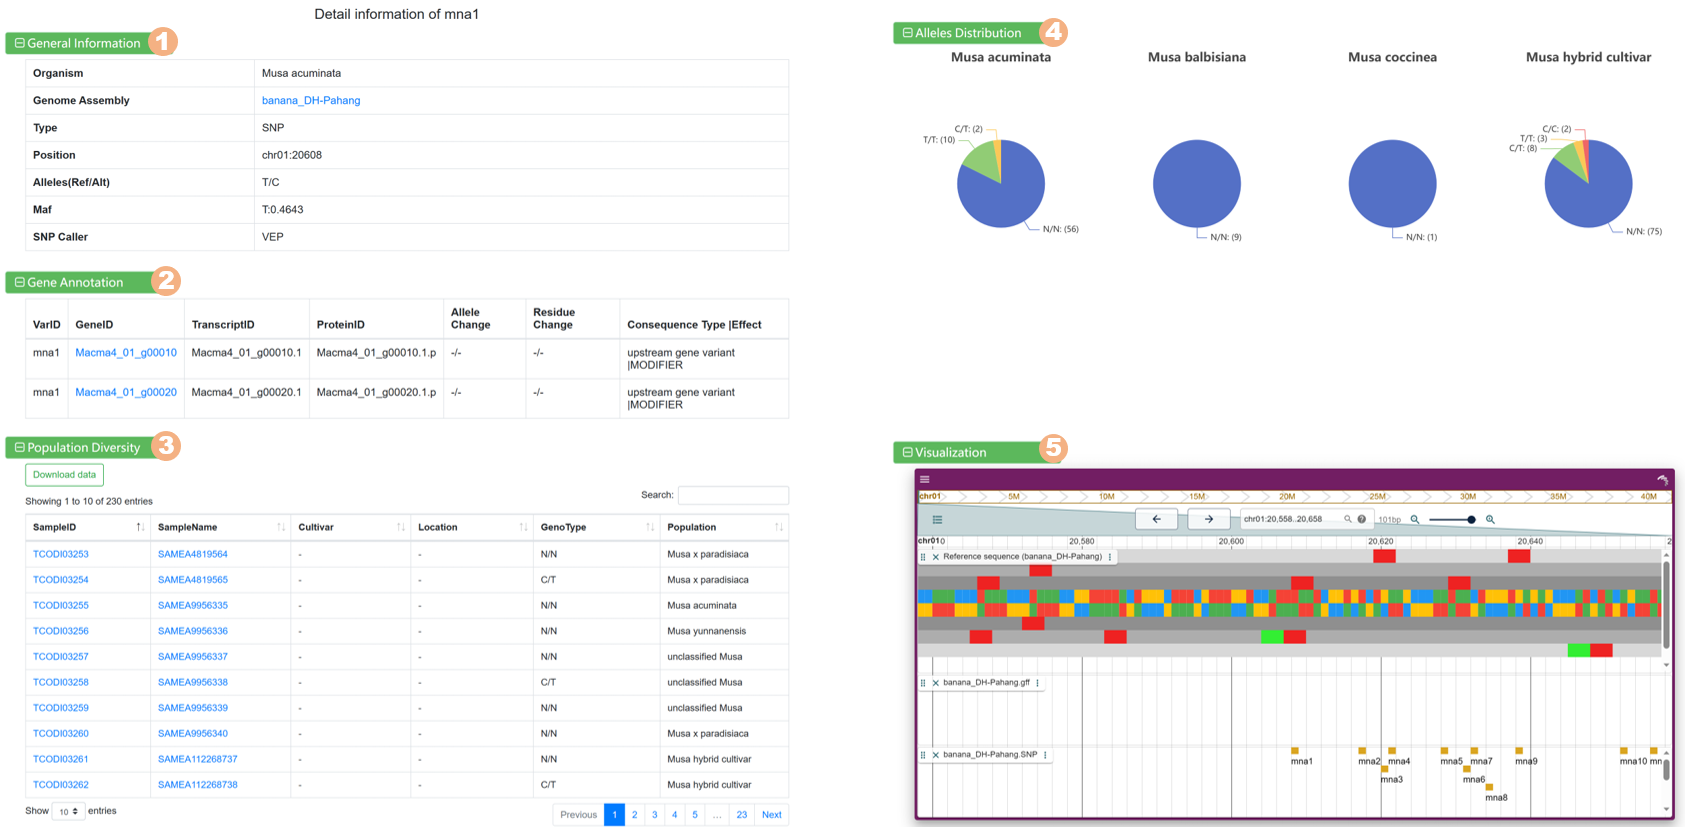
  • Figure 10 The detailed information for each variant

    5.Transcriptome
    5.1. RNASeq Project

    The 'RNASeq Project' section provides metadata information for collected RNASeq projects used for whole-transcriptome analysis, similar to the design of 'WGS Project'.

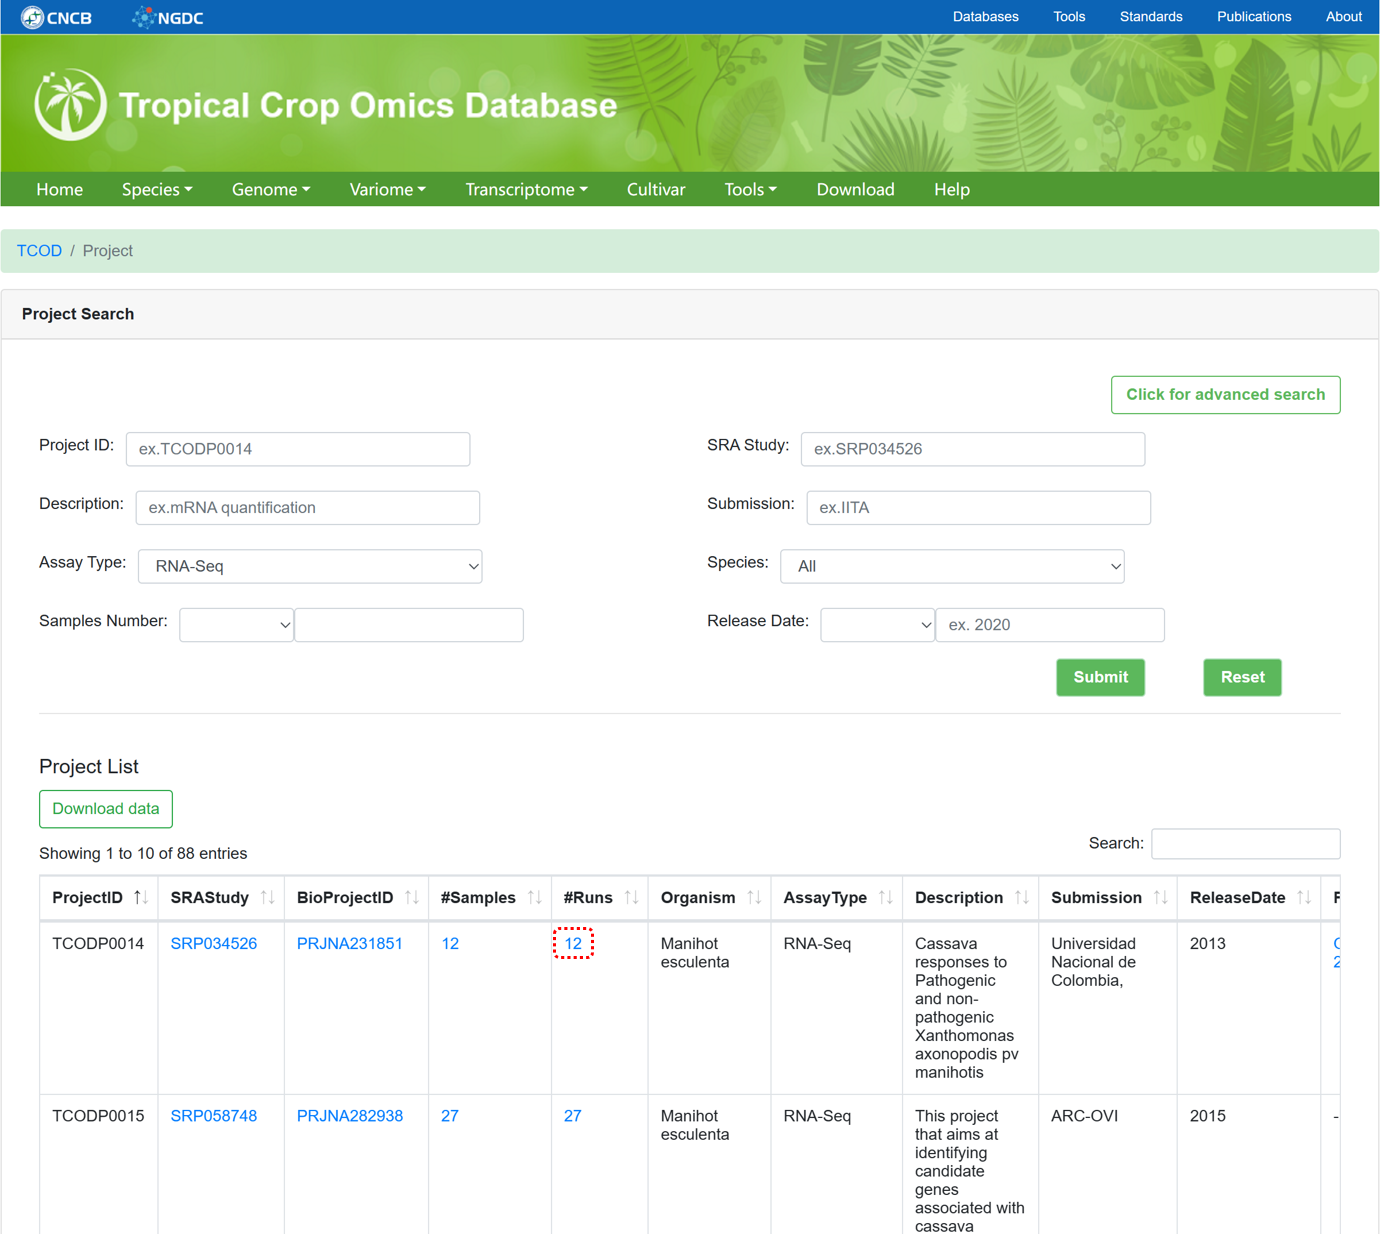
    Figure 11 The overview of 'RNASeq Project'

    5.2. RNASeq Sample

    The 'RNASeq Sample' section provides metadata information for collected RNASeq samples used for whole-transcriptome analysis. It is similar to the design of 'WGS Sample', but provides more detailed descriptions of the sample and overall alignment rate.

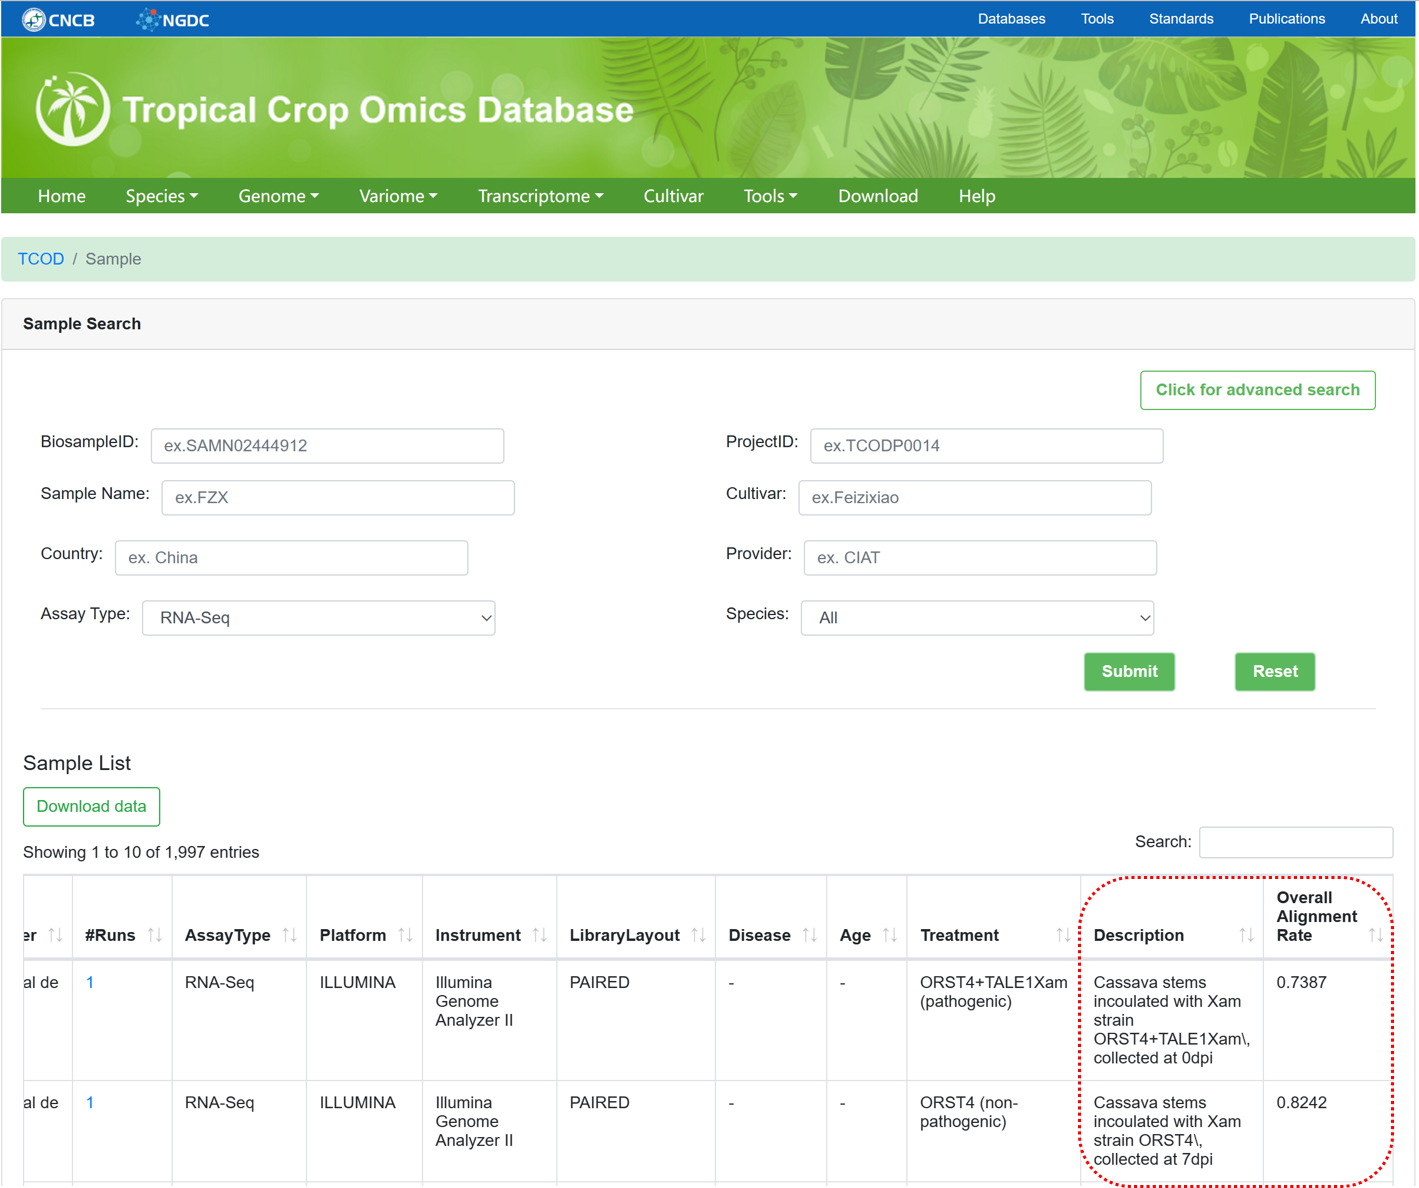
    Figure 12 The overview of 'RNASeq Sample'

    5.3. Expression

    By using standard transcriptome analysis pipelines from NGDC GEN on different RNA-Seq sequencing projects, the ‘Expressions’ module provides transcriptome profiles of 13 species under diverse experimental conditions. In addition, according to the description for each project, category tags (such as biotic stress, abiotic stress, etc.) were added to make it easier for users to find interested datasets.

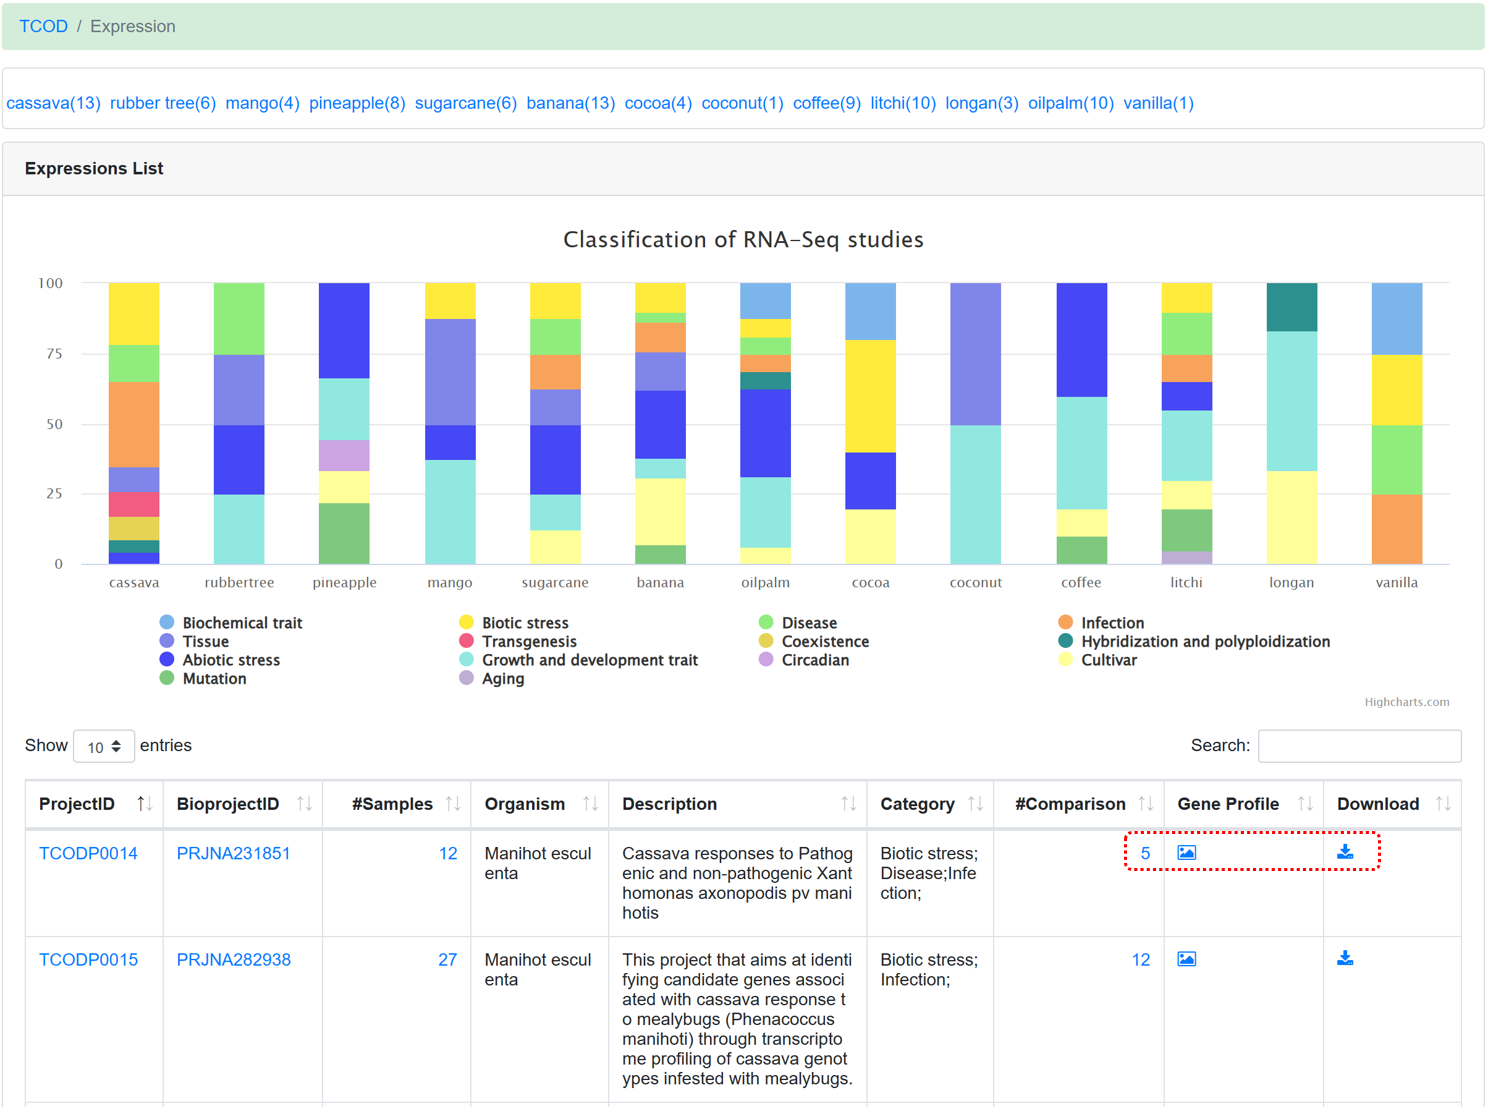
    Figure 13 The overview of 'Expression' module

    For each dataset, the following information is avaliable:

  • Visualization gene expression profiles, select the gene by clicking the drop-down box to view the TPM value in different samples.
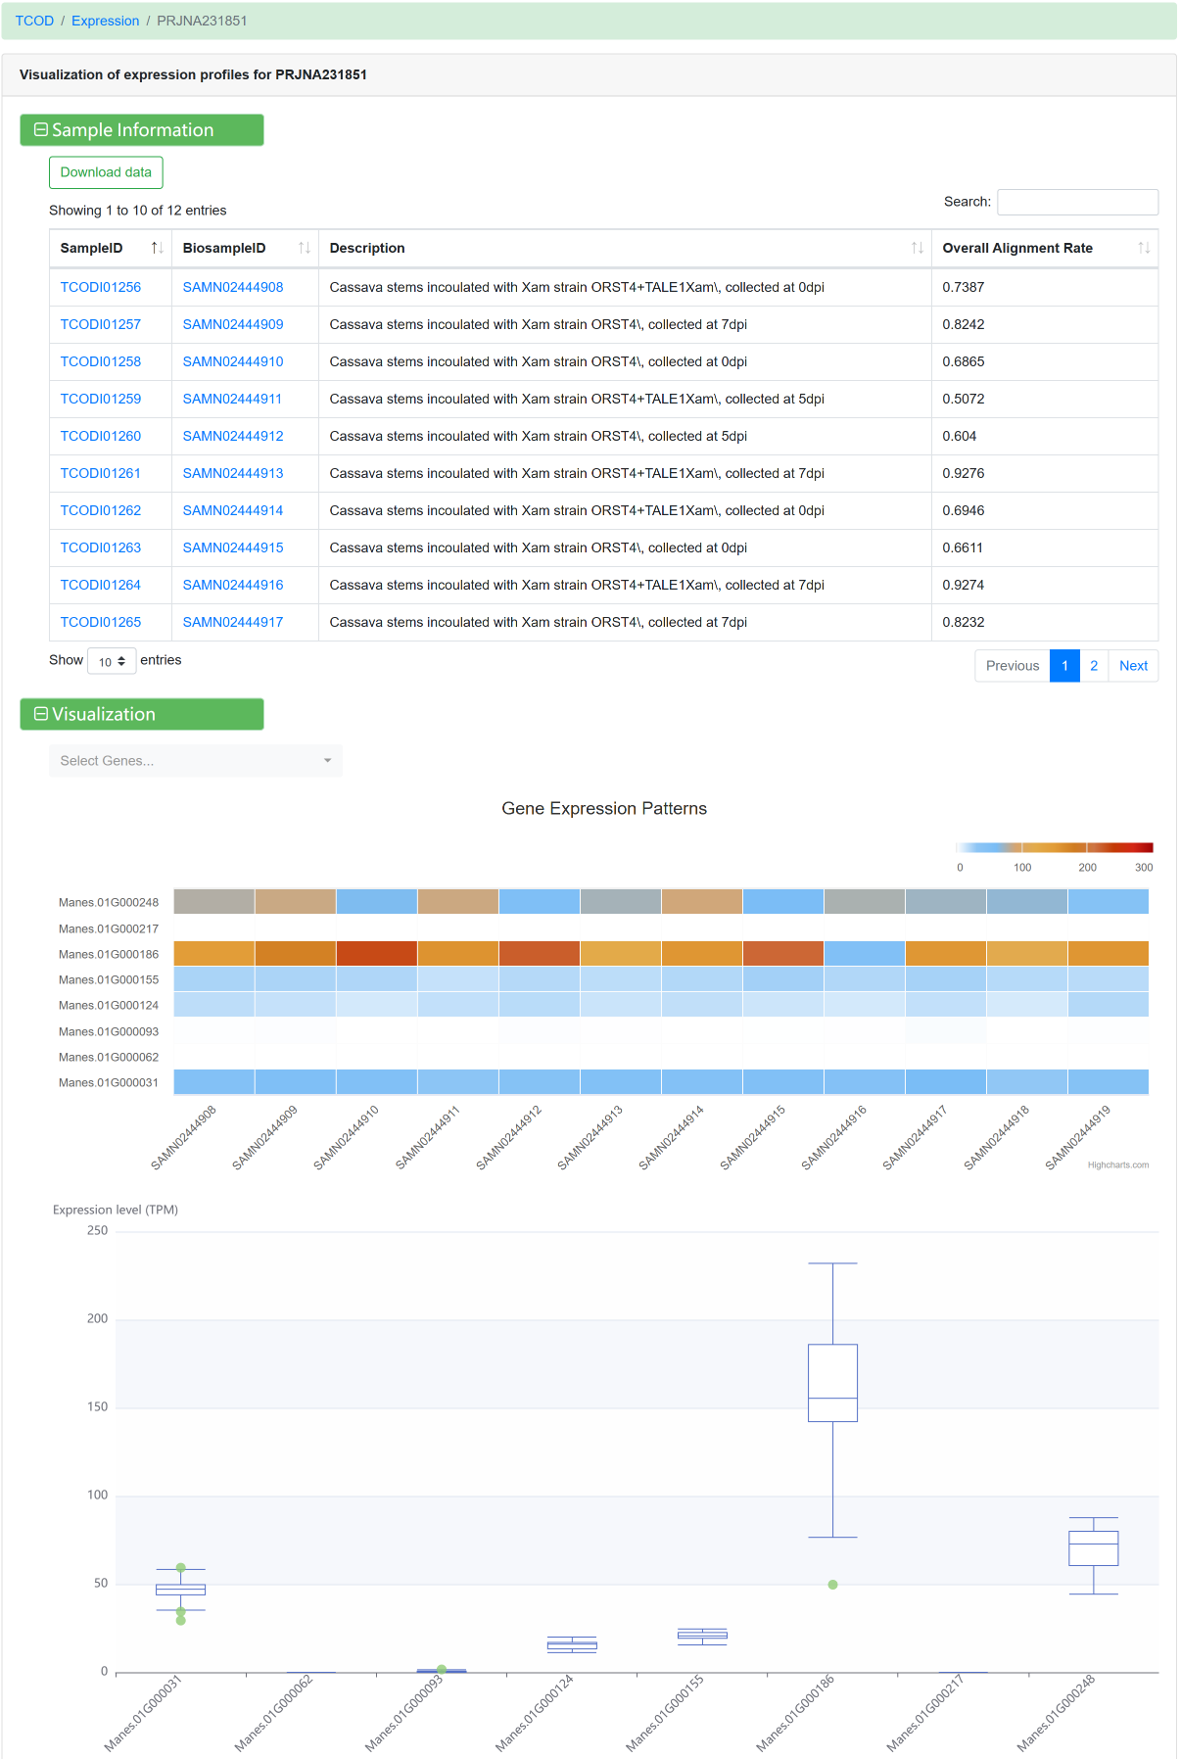
  • Figure 14 Visualization of gene expression profile

  • Differentially expressed gene lists under different compare conditions, after grouping samples through sample metadata information, the differential expression analysis between different experimental conditions was performed to obtain the up-regulated and down-regulated genes.
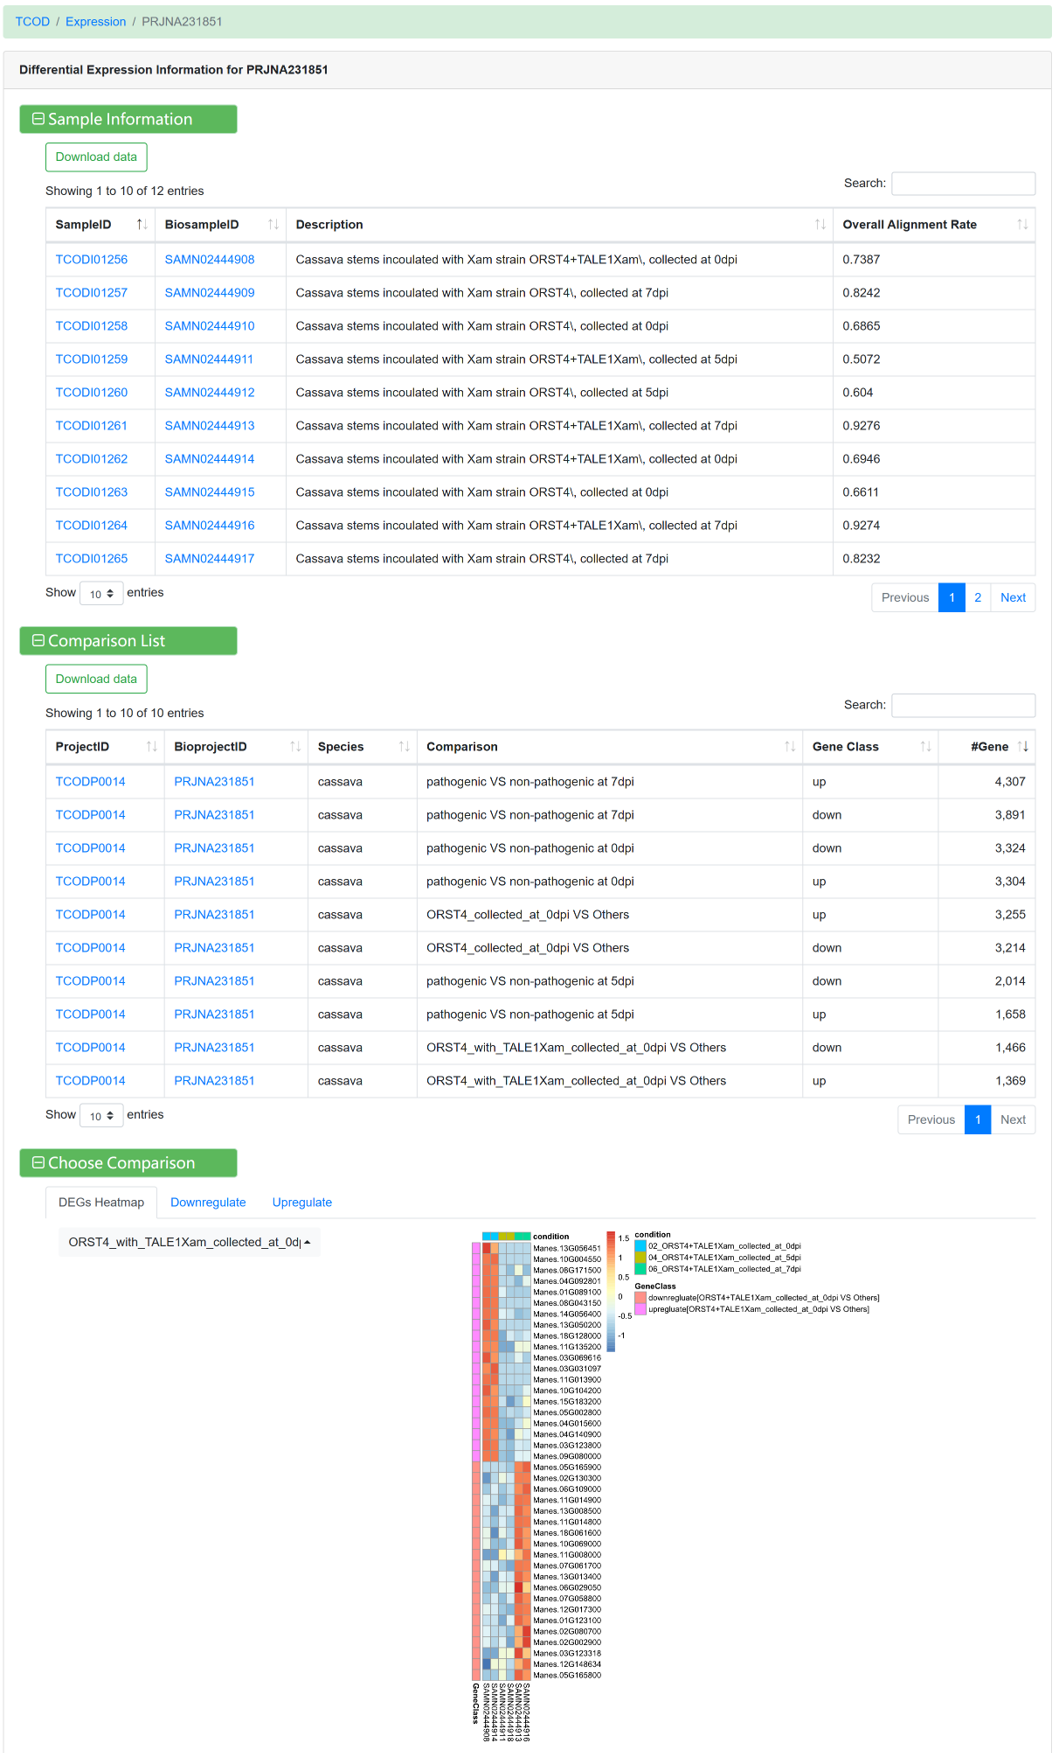
  • Figure 15 Differential expression information under different comparison conditions

    6.Cultivar

    The 'Cultivars' module currently includes 13,122 germplasm entries of 15 species, integrated from CIAT , IITA and GRIN. The page consists of the following three sections:

  • Global distribution maps of germplasm resources for various tropical crops.
  • Multi-condition dynamic retrieval can be performed by choosing cultivar ID, accession name, DOI number, country of origin, and source website.
  • List of returned cultivar entries.
  • Figure 16 The overview of 'Cultivars' module

    Clicking on each cultivarID link allows you to view detailed information:

  • Passport data, such as accession name, synonyms, DOI, origin country.
  • Botanical characteristics, such as plant height, stem color, developed leaf color, petiole color.
  • Agronomic characteristics, such as storage root form, root color, dry matter content, hydrocyanic acid content.
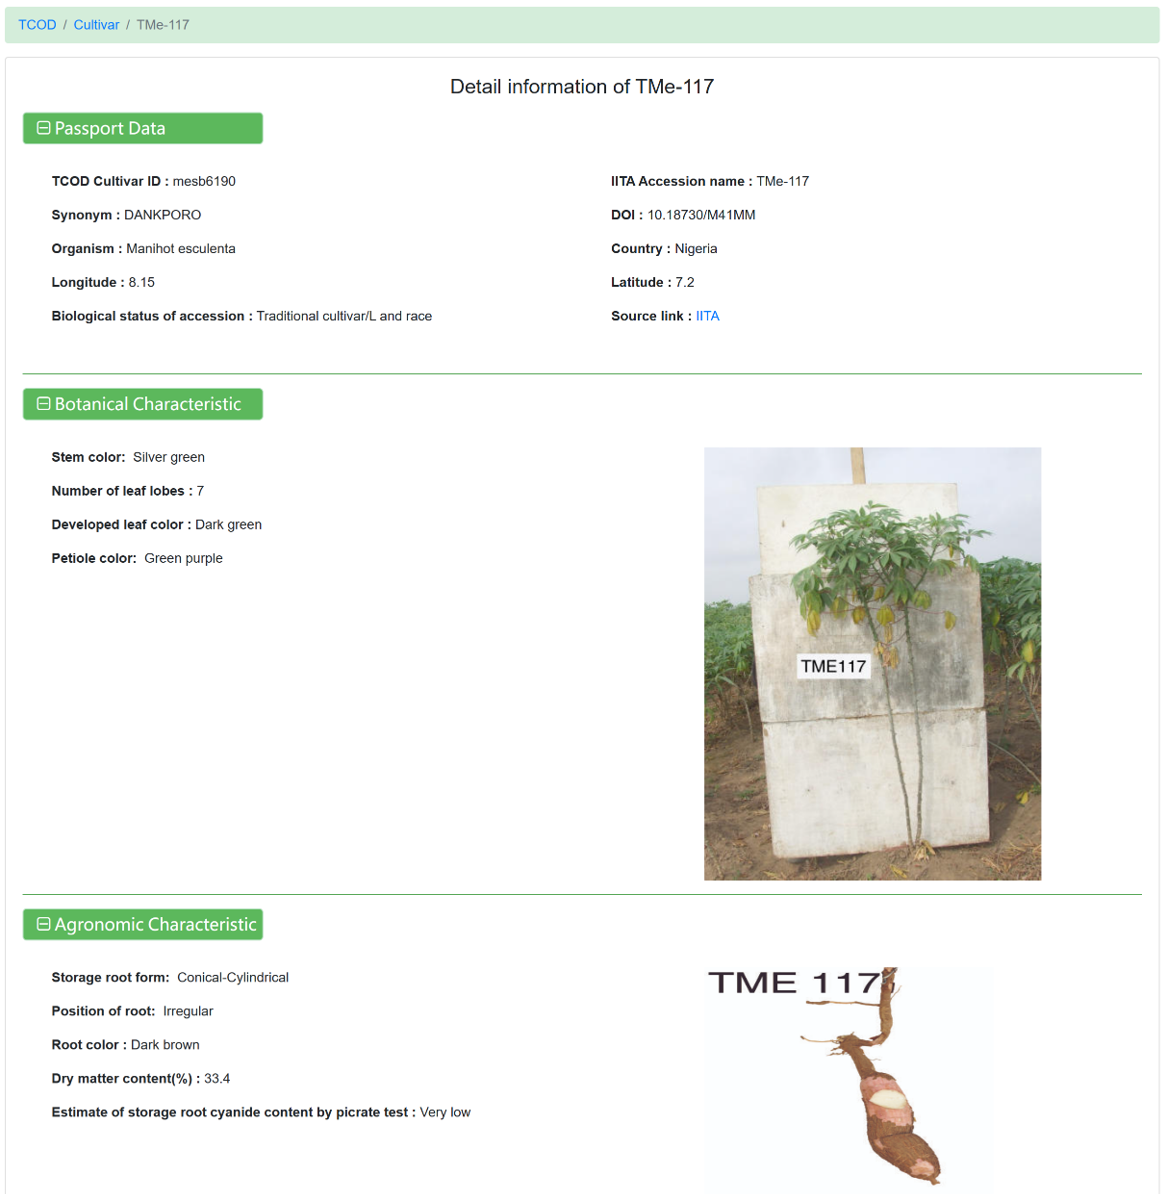
  • Figure 17 The detailed information for each cultivar

    7.Tools
    7.1. BLAST

    The BLAST tool provides alignment databases for 15 species, including genome, CDS, and protein sequences. Users can choose single or multiple species alignment databases to find similar sequences, or submit their own sequences for pairwise alignment.

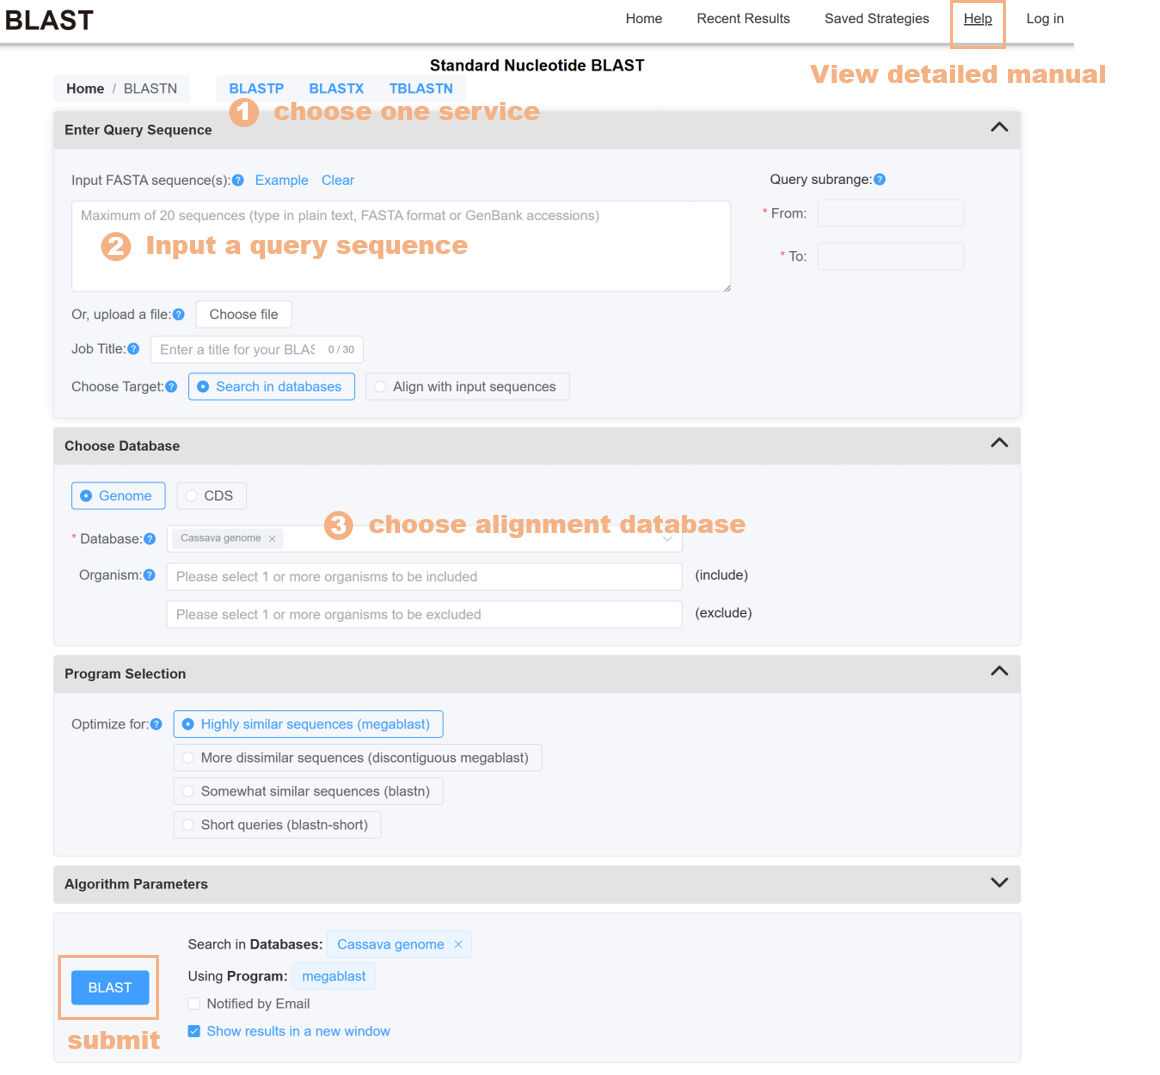
    Figure 18 The BLAST tool

    7.2. Genome Browser

    The Genome Browser calls the jbrowse plug-in to support the visualization of the genome sequence, gene structure, SNPs and InDels on the genes, and supports exporting the visualization results of selected regions to images.

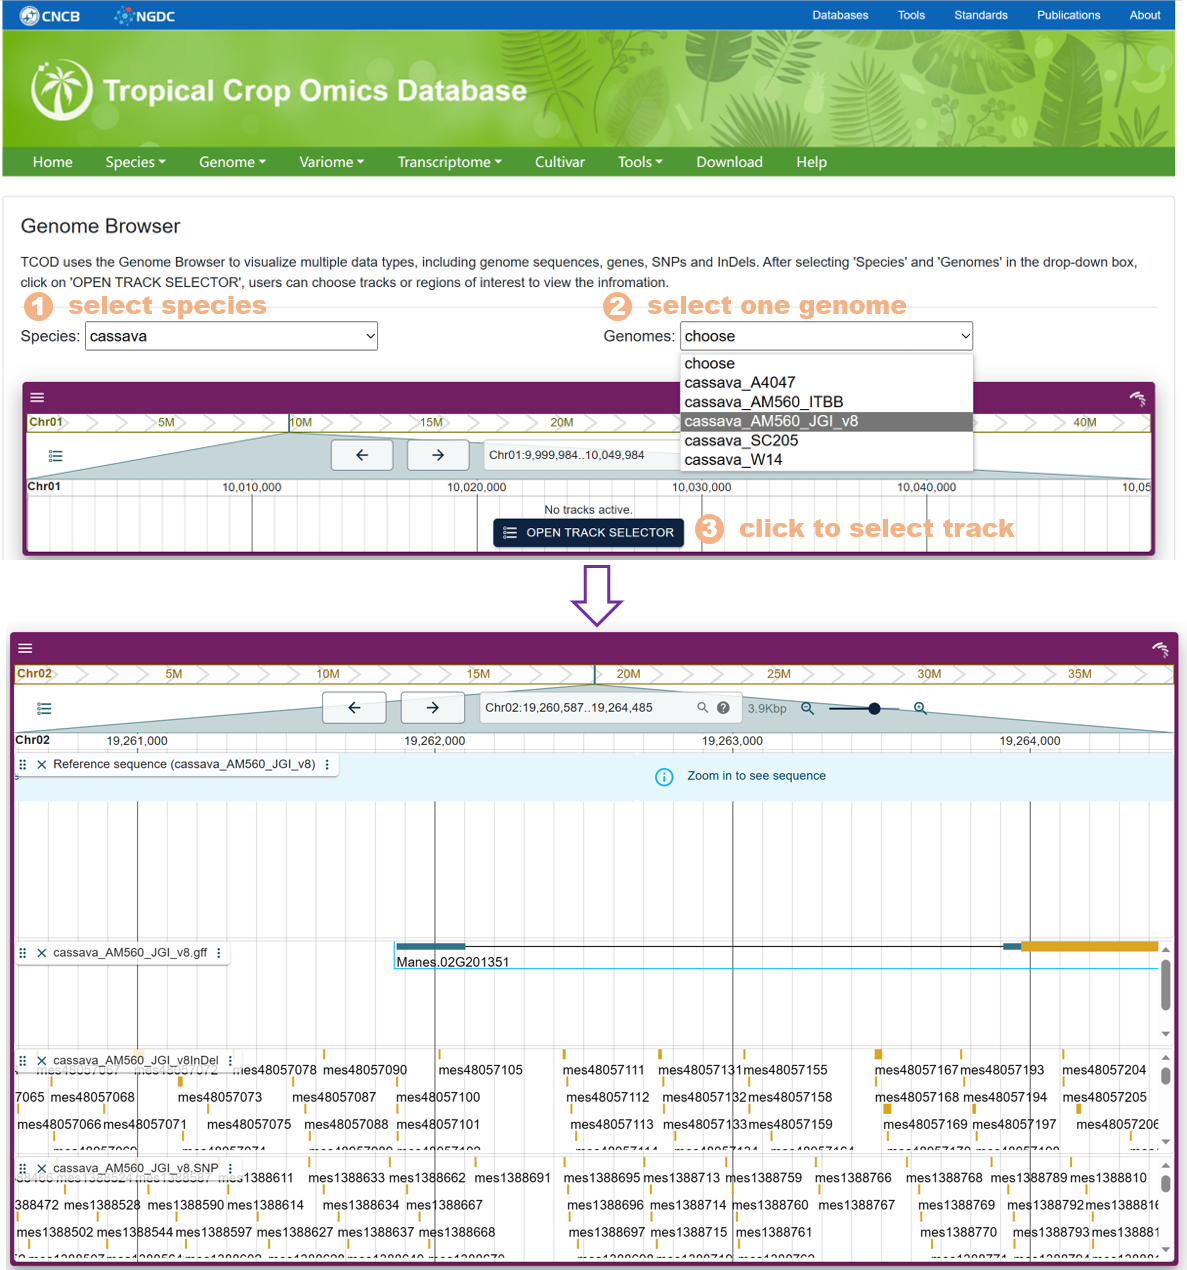
    Figure 19 The Genome Browser tool

    7.3. Primer Design

    The Primer Design tool is designed to assist users in designing primers for subsequent experimental validation. It is a secondary development based on Primer3web. The specific steps are as follows:

  • Enter the sequence for primer design.
  • Select the specific region where primers need to be designed.
  • Customize parameter settings (optional). Default parameters are provided.
  • Returned results: In addition to the optimal primer design, four alternative results are also provided for users to choose from.
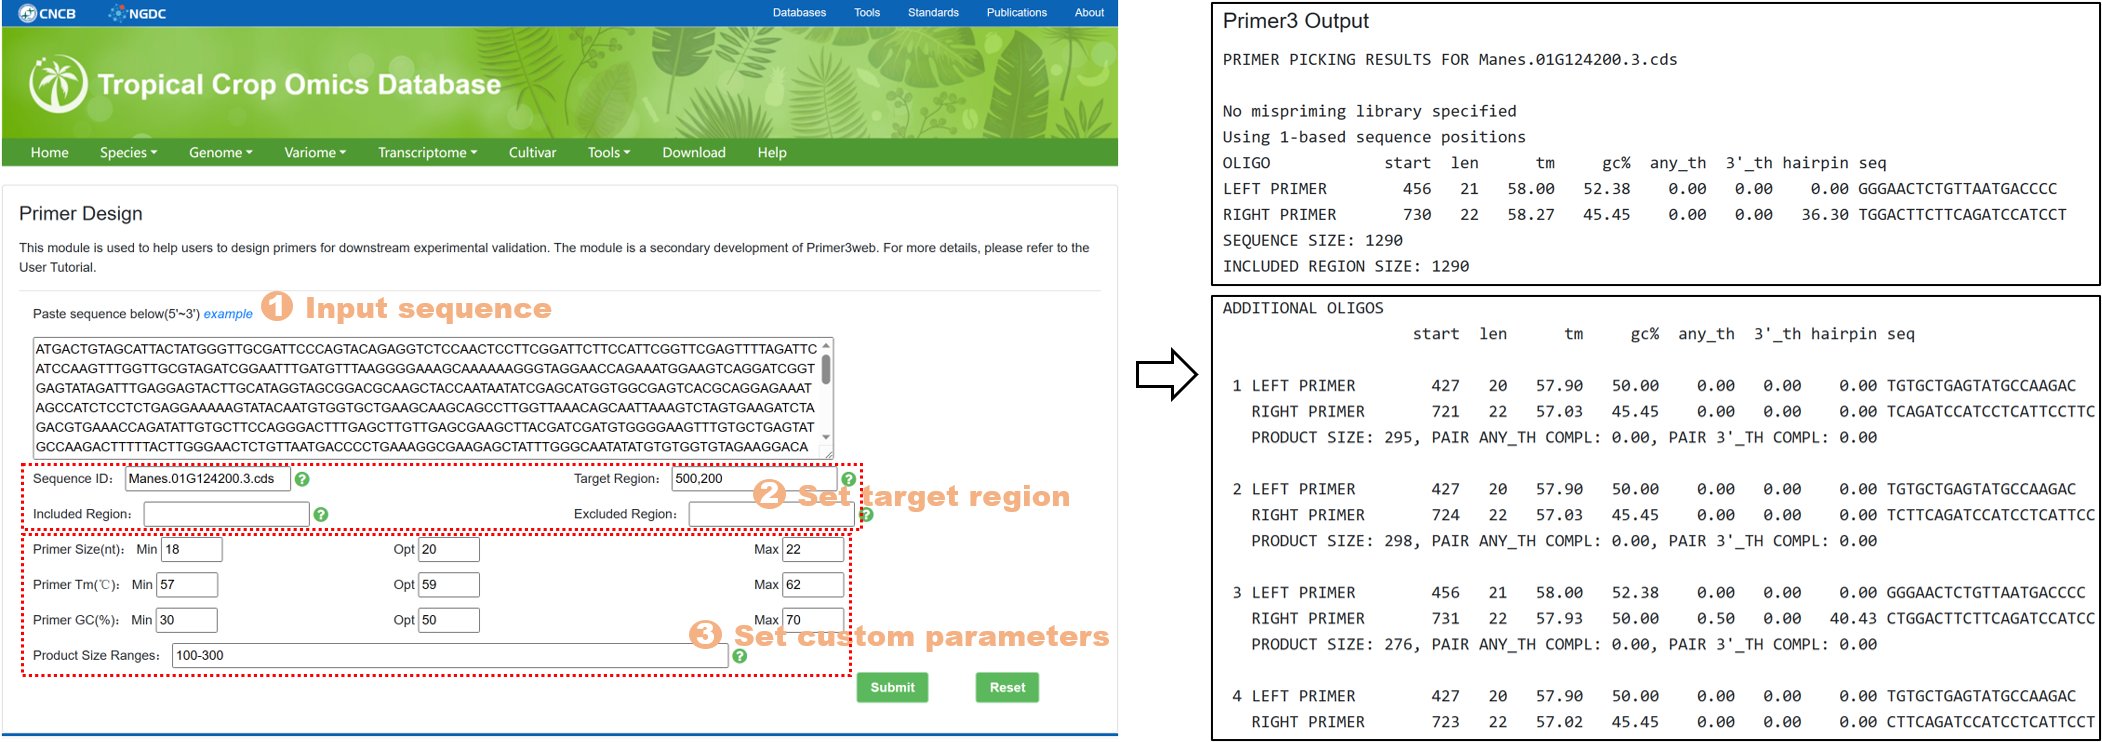
  • Figure 20 The Primer Design tool

    7.4. Literature Search

    The Literature Search tool utilizes the data interface provided by NGDC OpenLB to facilitate rapid literature searches based on selected journals, publication years, publication types.

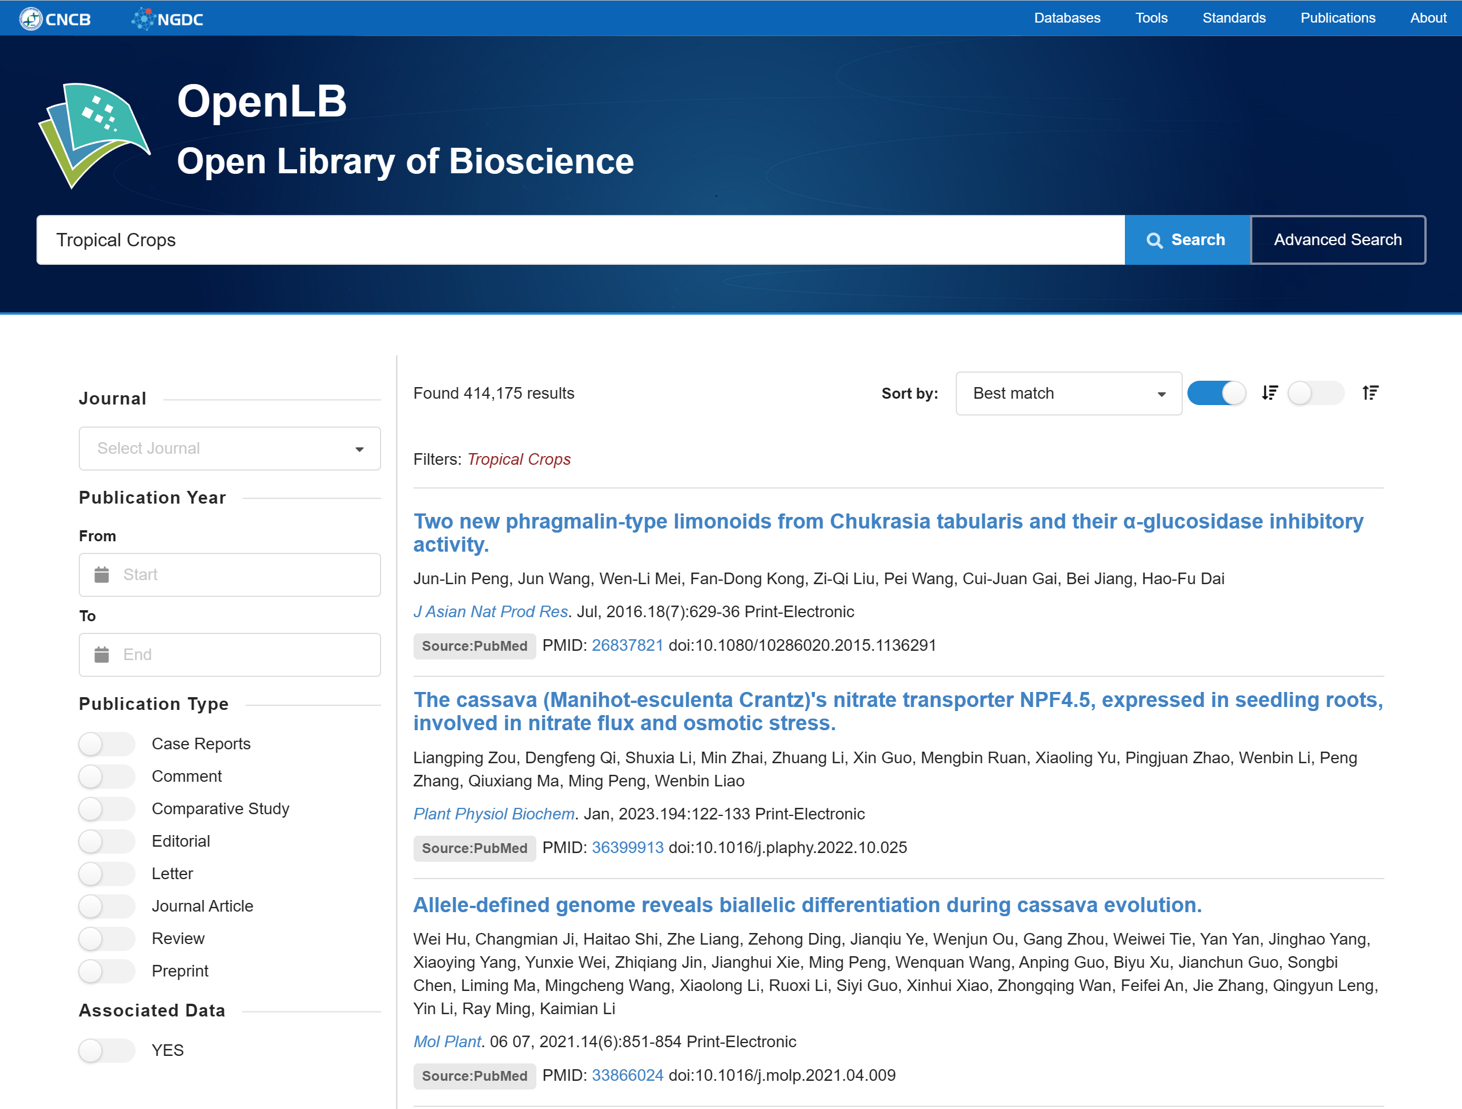
    Figure 21 The Literature Search tool

    7.5. GO Enrichment

    The GO Enrichment tool is used to help users carry out GO pathway enrichment analysis on the target gene set. The specific steps are as follows:

  • Input parameter: including selecting the target species, inputting the target gene set, setting the p value and q value, and clicking submit. This process may take about a minute.
  • Return the GO enrichment bubble map. The more the number of enriched genes, the larger the bubble size; the smaller the corrected p value, the closer the color is to red. You can click to download and save the image.
  • Get GO enrichment results, you can sort the results according to different columns, and support the results to be downloaded in excel.
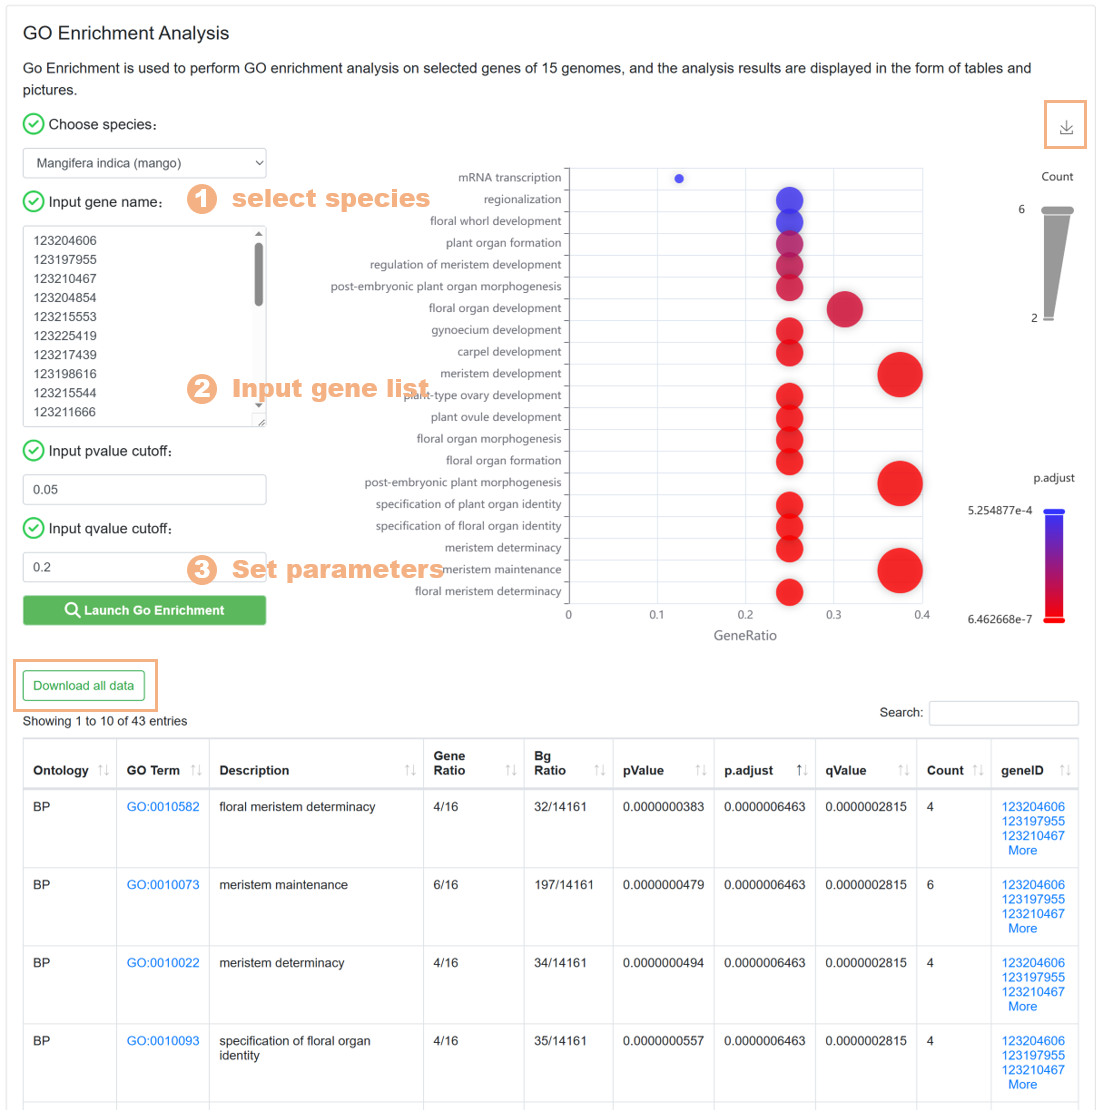
  • Figure 22 The GO Enrichment tool

    7.6. KEGG Enrichment

    The KEGG Enrichment tool is used to help users carry out KEGG pathway enrichment analysis on the target gene set, similar to the design of the GO Enrichment tool. The specific steps are as follows:

  • Input parameter: including selecting the target species, inputting the target gene set, setting the p value and q value, and clicking submit. This process may take about a minute.
  • Return the KEGG enrichment bubble map. The more the number of enriched genes, the larger the bubble size; the smaller the corrected p value, the closer the color is to red. You can click to download and save the image.
  • Get KEGG enrichment results, you can sort the results according to different columns, and support the results to be downloaded in excel.
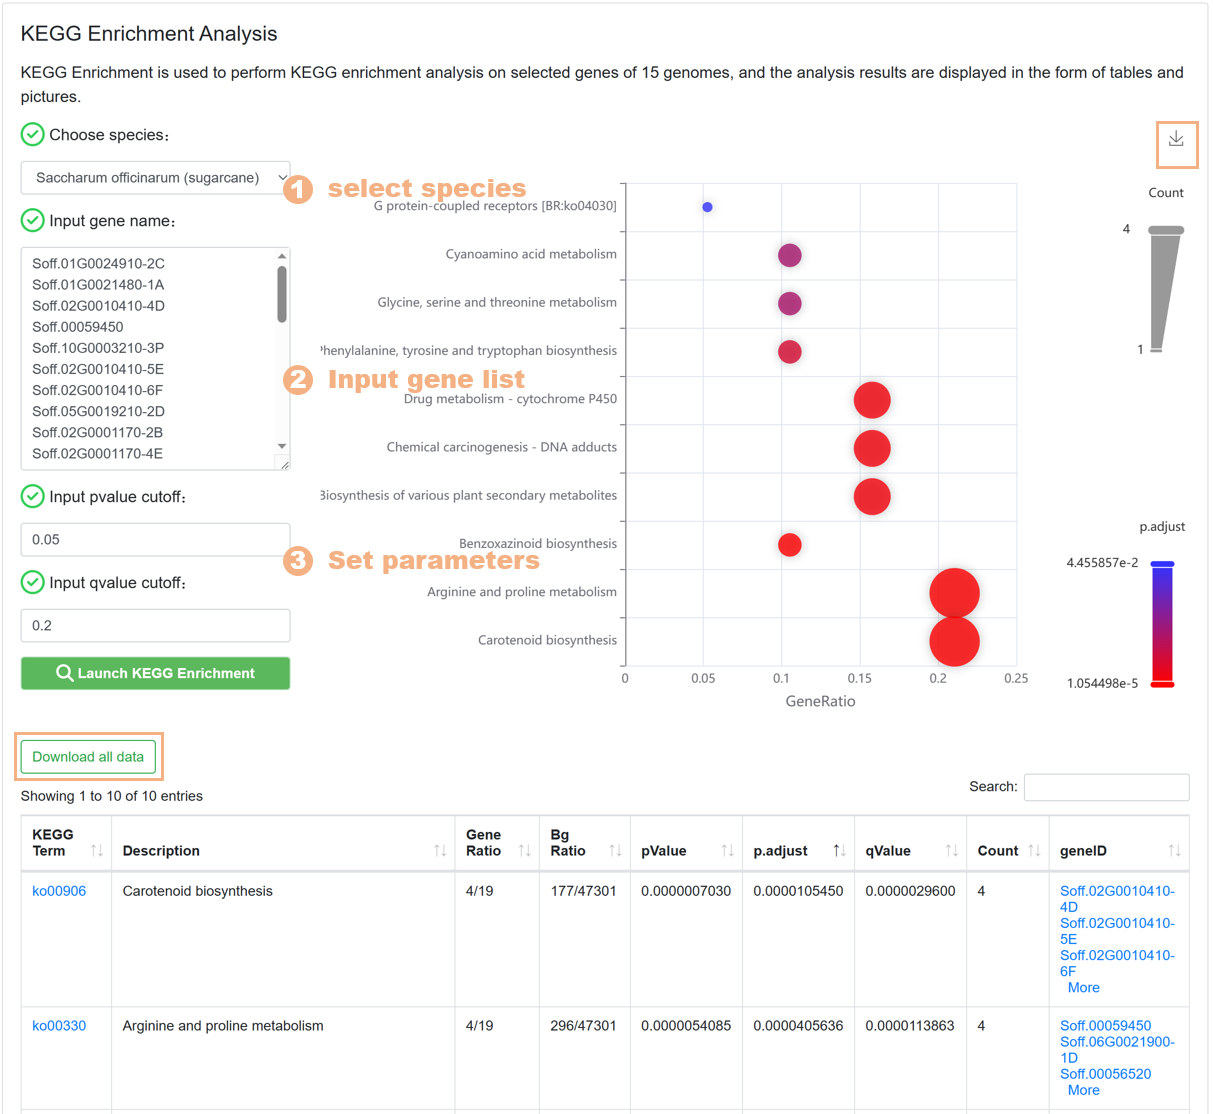
  • Figure 23 The KEGG Enrichment tool

    7.7. Synteny Viewer

    We utilized the Mummer software to conduct synteny analysis on the whole genome sequences of 15 species. The Synteny Viewer allows users to visualize the synteny results between different species, as well as between different subspecies of the same species. The specific steps are as follows:

  • Select the targeted species and choose the corresponding genome. Click on the "View" button to visualize the synteny.
  • In the dot plot view, identify the region that requires closer examination. Click on the "Open linear synteny view" to focus on the collinearity of the two genomes within that specific segment.
  • To gain more insights into the collinear segment, click on the "Open track selector" button to add the GFF annotation information of the genome. This will allow you to view the gene annotation information of the collinear region.
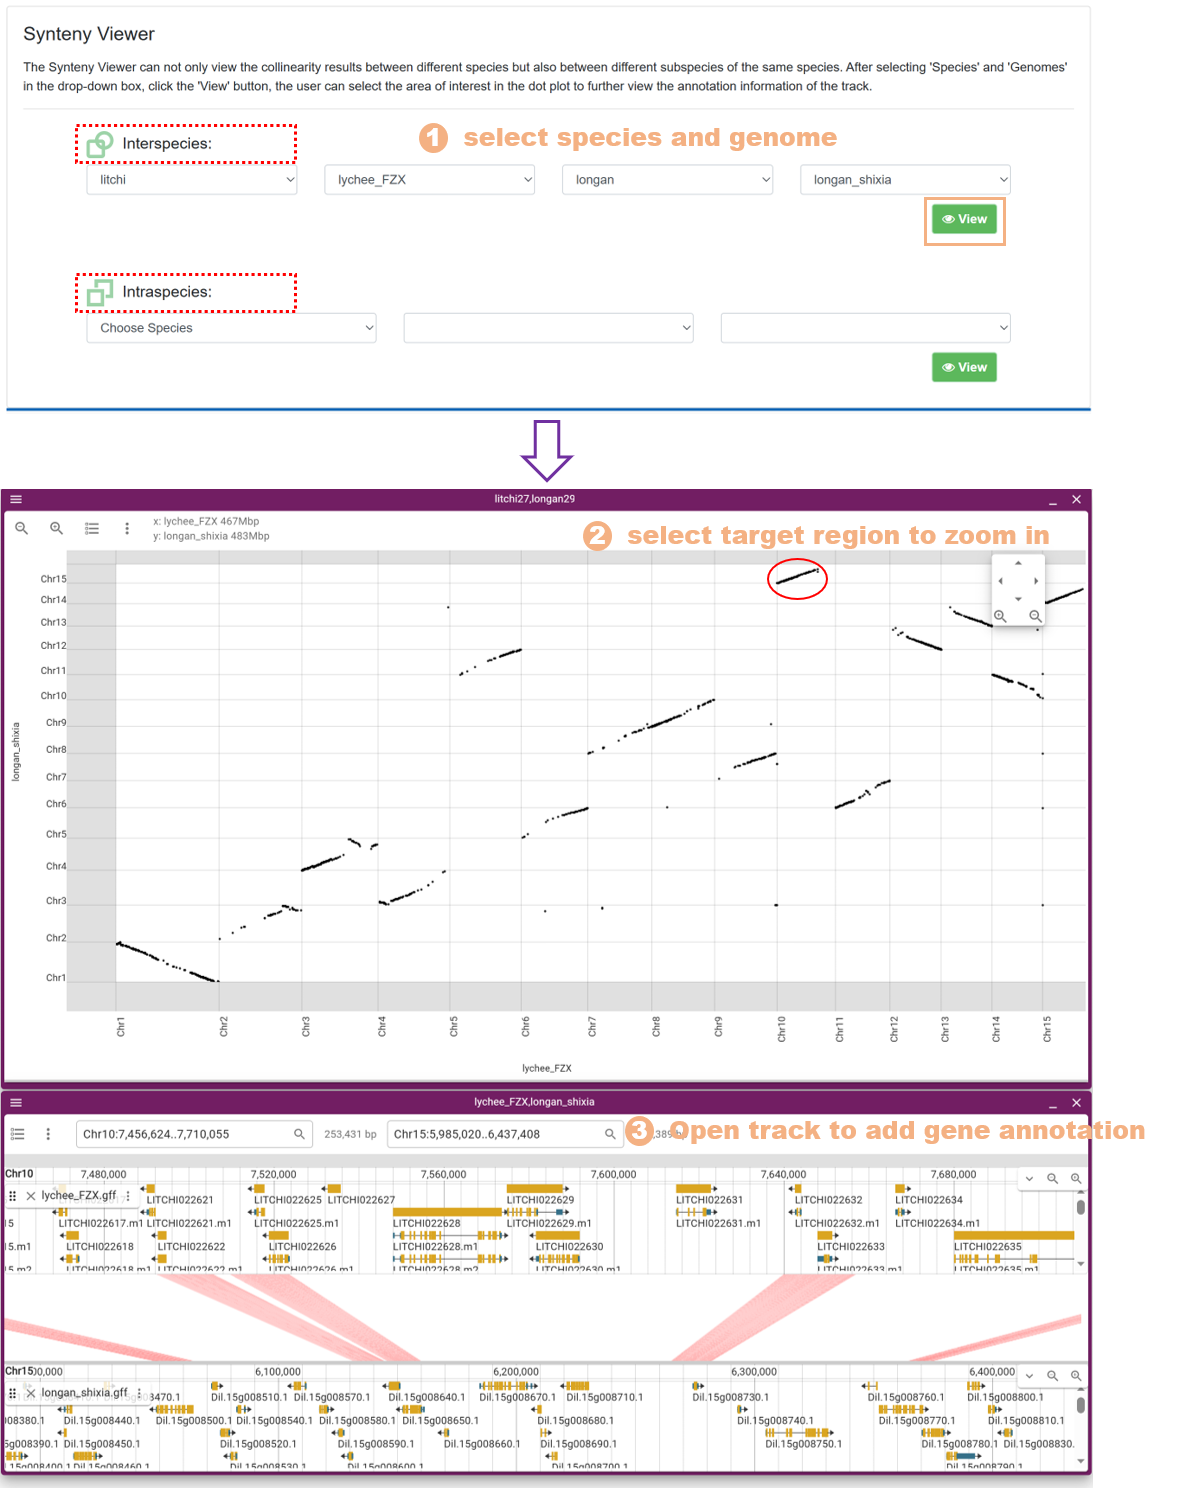
  • Figure 24 The Synteny Viewer tool

    7.8. Homolog Finder

    The Homolog Finder tool aids users in swiftly searching homologous genes. The page primarily encompasses:

  • Statistics displaying homologous gene entries between pairs of genomes for each species. By clicking on each small square within the figure, users can promptly access a list of homologous genes between the two genomes in the table below.
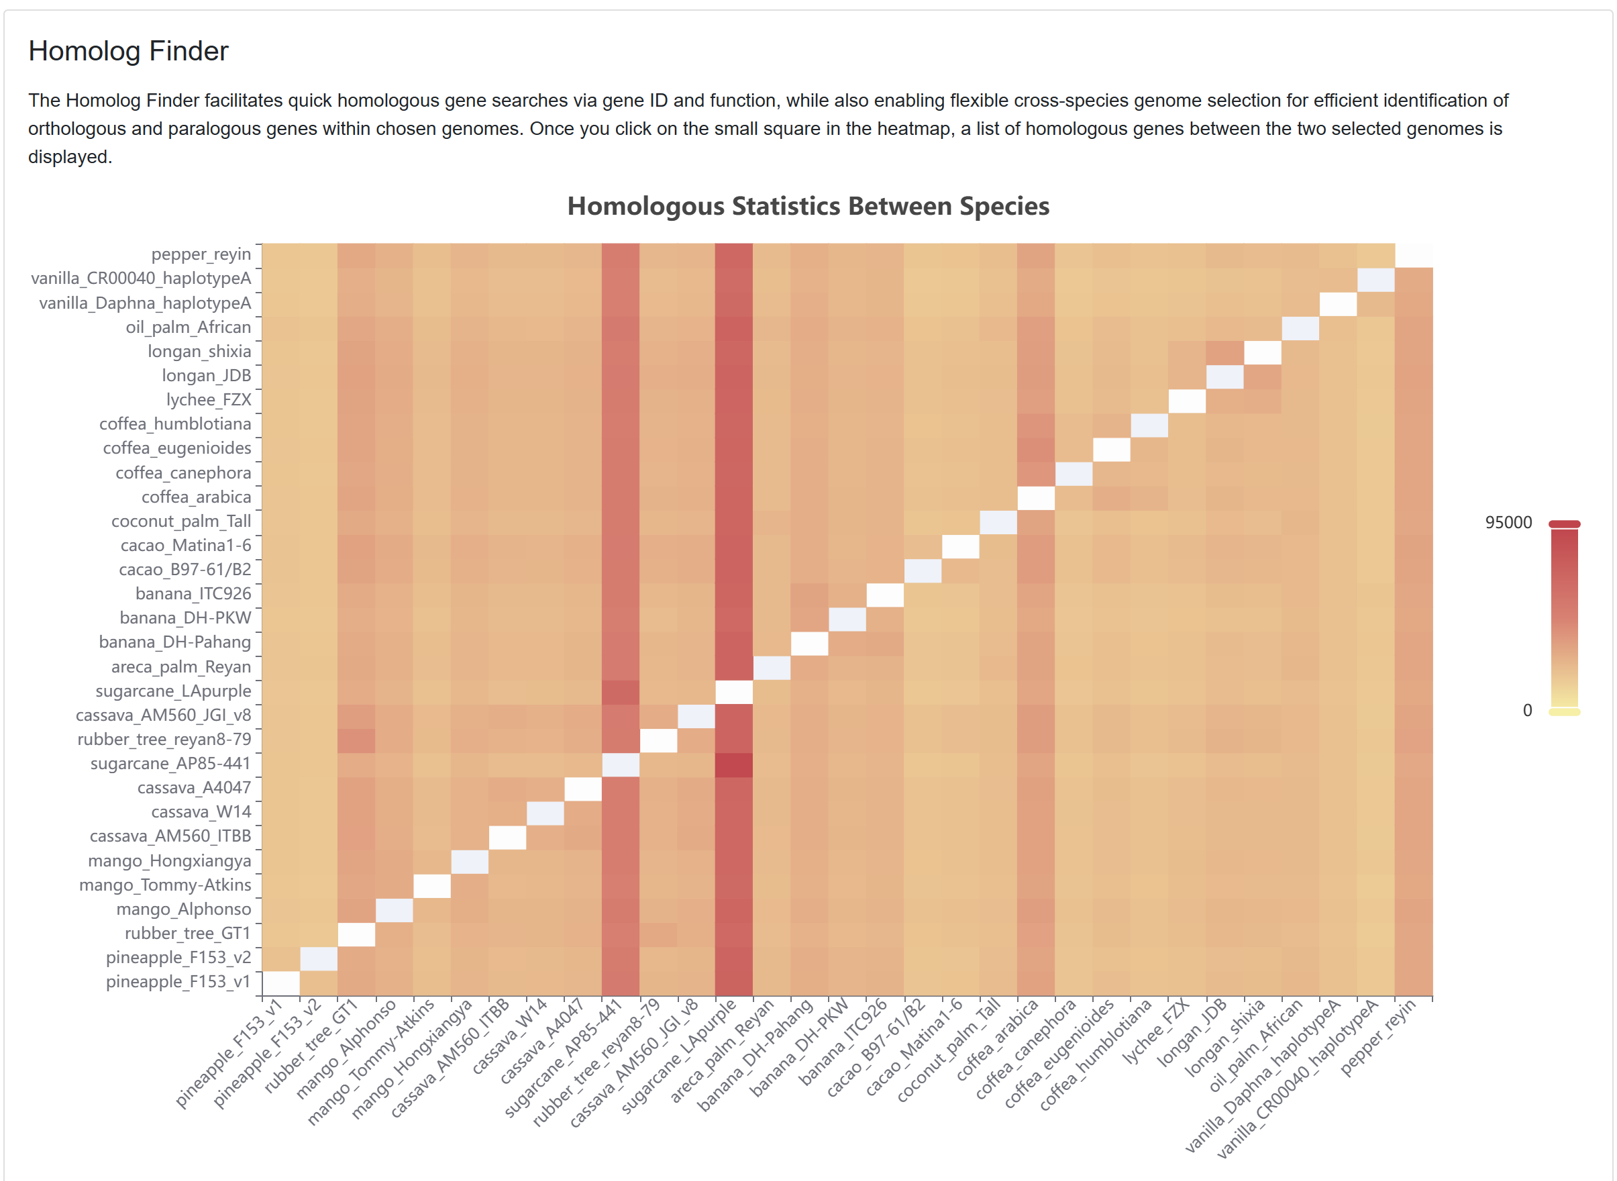
  • Figure 25 The homologous gene entries between pairs of genomes for each species

  • Advanced search:
  • based on genes: gene name or gene function can be input into the search box to find homologous genes.
  • based on species: species and genomes for querying and target species and genomes can be selected consecutively. Multiple species and genomes can be chosen as required.
  • The list of retrieved homologous genes: allowing users to view gene functions, orthologous genes, and paralogous genes. By clicking on the gene link, users can access comprehensive gene details, and the option to download the query results is provided.
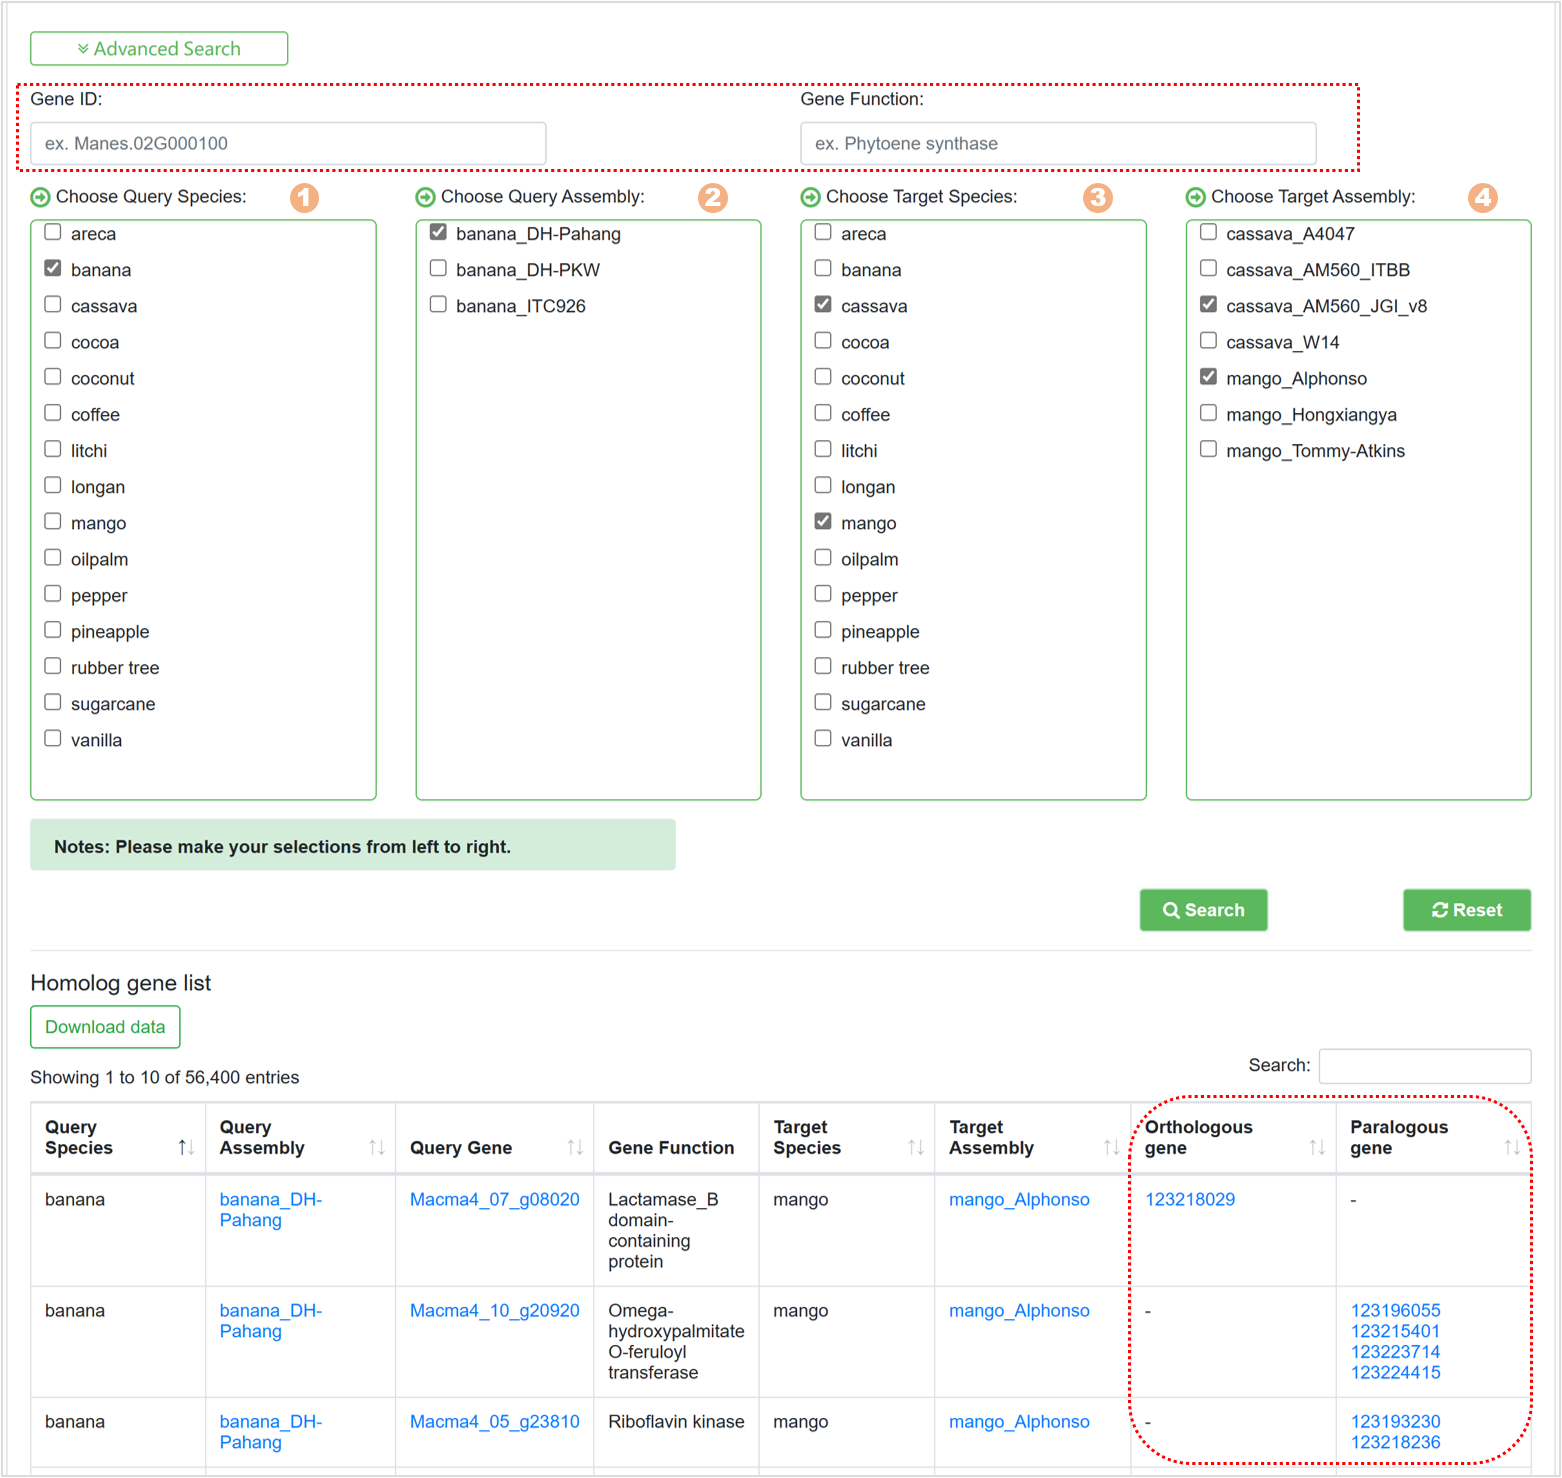
  • Figure 26 Advanced search for homologous genes

    8.Download

    For the diverse omics data resources integrated into the database, we offer the direct download for all available data except those that are yet to be released. The downloadable data encompass a wide range of information, including 30 genome sequences along with their corresponding annotation infromation, genome-wide variation data for 9 different species, transcriptome profiling results for 13 species, and germplasm items for 15 species.