1. Tutorial for Cell Taxonomy
Cell Taxonomy is a curated repository of 3,143 cell types and 26,613 associated cell markers encompassing 387 tissues and 257 conditions across 34 species based on 4,299 publications. Cell Taxonomy presents a well-structured taxonomy for curated cell types and incorporates 146 scRNA-seq studies containing about 3.5 million single cells to enable in-depth exploration of cell types and markers. Importantly, Cell Taxonomy provides multi-faceted cellular characterization and extensive assessment, facilitating users to select high-quality cell markers and expression profiles for cell types. Explore the taxonomy of cells now!
2. Curation model
Cell types and associated cell markers as well as tissues and conditions were collected based on integration of multiple sources and manual curation of literatures. Cell Taxonomy curation team manually curated cell types/cell markers from 1,555 publications out of thousands of single-cell relevant publications which are were not included in other databases. Records from "Cell Taxonomy" curation team only contains cell markers explicitly used for cell classification (clearly stated in the article) rather than thousands of differentially expressed genes from scRNA-seq analysis. The cell marker record sources, including Cell Taxonomy, CellMarker, PanglaoDB, Human Cell Landscape, etc., are indicated in the "cell marker" panel by clicking "show details" and in the "Source" column of the "Cell_Taxonomy_resource.txt" file in the download section. All records, both from our curation and the integration of other resources, were manually surveyed to extract essential information of cell types, species, tissues, conditions, cellular annotation, cell markers and cellular hierarchical relationships based on controlled vocabularies (shown in the Table). All cell types collected in Cell Taxonomy were manually curated based on standardized terms and assigned with a unique identifier prefixed with CT.
| Data type | Description | Value |
|---|---|---|
| Species | Controlled vocabulary | Homo sapiens, Mus musculus, Danio rerio, Drosophila melanogaster, etc. |
| Cell standard | Controlled vocabulary | Fibroblast neural crest derived, Jurkat cell, Germ line stem cell, etc. |
| Cell Ontology ID | Cell identifier | CL:0000034, CL:0000235, CL:0000236, etc. |
| Parent cell ID | Parent cell identifier | Cell Ontology ID |
| Tissue | Controlled vocabulary | Embryo, Testis, Gonad, Reproductive gland, Ovary, etc. |
| Tissue ID | Tissue identifier | Uber-anatomy ontology (UBERON) ID |
| Condition | Controlled vocabulary | Normal, Glioblastoma, High-grade glioma, Colon cancer, Endometrial cancer, etc. |
| Disease ID | Disease identifier | Disease Ontology ID |
| Cell marker | Controlled vocabulary | P75, CD34, HNK-1, SOX10, P75CD45, CD4, HNK1, Gfr1, Plzf, E-cad, etc. |
| Gene ID | Gene identifier | ENTREZ ID |
| Source | Controlled vocabulary | Cell Taxonomy, CellMarker, Human Cell Landscape, Human Cell Atlas, OnClass, ScTyper sigDB, SHOGoiN, PanglaoDB, Tinyatlas, CellMatch and Invitrogen |
| Reference | Publication in which the cell type or marker is described | PubMed ID |
3. Search
Cell Taxonomy provides quick search and advanced search for cell types, genes, tissues, conditions and species by specific name, synonyms or IDs. The advanced search enables combining searching and more relevant results will be returned.


-
4. Cell types
Cell Taxonomy works on a structured and standardized framework for cell types by literature curation and comprehensive integration. A tree structure of all curated cell types as well as detailed statistics are shown, including cell types with available cell markers and cell types without available ones. For the cell types with available cell markers, the detailed number of associated species, tissues, conditions, cell markers and publications for each curated cell type is presented in the table. For the cell types without available cell markers for now, the IDs and associated tissues are provided.

-
-
4.1 Description of cell type
The basic information of the cell type including Cell Taxonomy ID, Cell Ontology ID, synonyms and image are shown. The source of this image is http://www.cellimagelibrary.org/browse/celltype.

-
4.2 Summary
Cell Taxonomy summarizes multi-faceted characterization for each cell type, including publication-supported cell markers, cell surface markers, cellular similarity based on markers, cell composition of tissues, cellular comparison across species, assessment metrics of cell markers and available expression profiles. In specific, Cell Taxonomy provides several assessment metrics to help users select robust cell markers, including supported publication (number of publications), expression enrichment (log2FC, highly expressed ratio, specificity score) and conservation (number of orthologs reported as cell markers for this cell type across species). The cell markers are ranked in descending order by the number of metrics meeting the thresholds. You can adjust metric thresholds to screen for personalized high-quality cell markers.

-
4.3 Cell marker
Top publication-supported cell markers for each cell type in different species and tissues are shown. Fisher’s exact test is performed with FDR to test if cell markers are specifically associated with this cell type by publication number: *** for < 0.001, ** for [0.001, 0.01) and * for [0.01, 0.05).

The heatmap shows the number of supported publications of cell markers in different tissues for this cell type. The relevant data in the figures is presented in the table.

-
4.4 Cell marker expression enrichment
Cell Taxonomy provides expression enrichment profiles for top publication-supported cell markers including the highly expressed ratio (No. of highly expressed samples/No. of samples), differential expression fold-change between this cell type and other cell types and cell specificity score in relevant scRNA-seq studies. The detail information of cell marker expression enrichment scores in cell types (expression proportion, fold-change, p-value, FDR, cell specificity score and scRNA-seq studies) is listed in the table.


-
4.5 Cell surface marker
The cell surface information of cell markers for each cell type is incorporated from Human Protein Atlas by selecting genes which code for membrane proteins or membrane & secreted proteins with supported evidence at protein or transcript level.

-
4.6 Cellular comparison across species
The cell marker composition of cell types is compared across species based on the orthologous information. The orthologous genes are downloaded and extracted from NCBI HomoloGene. For specific cell type, the similarity of reported cell marker composition between different species is shown.

The cell markers and their orthologous genes which are also reported as cell markers for the same cell type are shown.

-
4.7 Cellular similarity based on cell markers
The cell marker composition of cell types is compared with each other. The similarity score (0-1) is calculated between two cell types by the number of common markers normalized by marker set sizes. One represents the same marker sets of two cell types and zero means the two cell types share no common markers.

-
4.8 Cellular composition of tissues
The cell-type distribution across human and mouse tissues are shown in representative large-scale scRNA-seq studies (Tabula Sapiens Consortium and Tabula Muris Consortium).

-
4.9 Cell cluster evaluation in scRNA-seq studies
Cell Taxonomy conducts the quality evaluation of cell clusters to ease users to select high-quality expression profiles for single-cell assignment. In specific, Silhouette coefficient of corresponding cell cluster, average Silhouette coefficient of all clusters in one sample, ROGUE purity score of corresponding cell cluster, average ROGUE purity score of all clusters in one sample, and cell number are provided in all collected samples to measure the quality of scRNA-seq studies for this cell type. You can adjust the threshold of these five metrics (top percentiles) to screen for personalized high-quality studies.

-
-
-
5. Cell markers
Molecular features serve as the basis for accurate cell-type classification and high-quality cell markers are essential information for each cell type. Cell Taxonomy provides the detailed statistics of cell markers including the number of associated cell types, tissues, conditions, conditions, publications and orthologous genes.

-
-
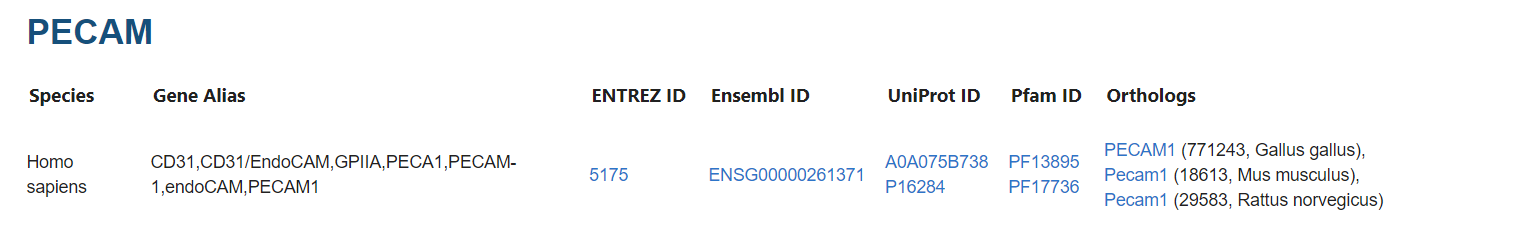
5.1 Basic information
The basic information of cell marker is provided including species, gene alias, ENTREZ ID, Ensemble ID, Uniprot, PFAM and orthologous genes.
-
5.2 Summary
Multi-faceted characterization for this cell marker is summarized including publication-supported cell types, cell surface marker, conserved cell marker and cell marker expression enrichment patterns. In specific, the assessment metrics of associated cell types contain supported publication (No. of publications), expression enrichment (log2FC, highly expressed ratio, specificity score) and conservation (number of orthologs reported as cell markers for this cell type across species). The cell types are ranked in descending order by the number of metrics meeting the thresholds. You can adjust metric thresholds to screen for personalized high-quality cell types for which this gene is more likely to be a cell marker.

-
5.3 Cell type
Cell types of this cell marker in various tissues are shown with significance indicating if this cell marker is specifically associated for this cell type by fisher’s exact test with FDR: *** for < 0.001, ** for [0.001, 0.01) and * for [0.01, 0.05).

The heatmap shows the number of supported publications of cell types in different tissues for this cell marker. The relevant data in the figures is presented in the table.

-
5.4 Cell marker expression enrichment
The expression enrichment profiles of this cell marker in top publication-supported cell types are shown including the highly expressed ratio (No. of highly expressed samples/No. of samples), differential expression fold-change between one cell type and other cell types and cell specificity score in relevant scRNA-seq studies. The expression enrichment scores of this cell marker in cell types (No. of expressed samples, No. of highly expressed samples, highly expressed ratio, expression proportion, fold-change, p-value, FDR, cell specificity score and scRNA-seq studies) are listed in the table.


-
5.5 Cell surface marker
The cell surface information of this cell markers is incorporated from Human Protein Atlas by selecting genes which code for membrane proteins or membrane & secreted proteins with supported evidence at protein or transcript level.

-
5.6 Cell marker comparison across species
The cell markers are compared across species and their orthologous genes which are also reported as cell markers for the same cell type are shown.

-
-
-
6. Tissues
Cell Taxonomy describes cell types and cell markers in hundreds of tissues with standard ontology IDs. The tree structure of curated tissues and detailed statistics are provided including the number of associated species, conditions, cell types, cell markers and publications.

-
6.1 Summary
For this tissue, multiple information including the number of associated cell types, conditions, species and publications as well as the mostly reported cell type is summarized.

-
6.2 Basic information
The curation information of species, cell types, cell markers, conditions and sources associated with this tissue is provided in detail.

-
6.3 Publication-supported cell types and markers
The top publication-supported cell types in this tissue are displayed in the bar figure. And the heatmap shows the number of supported publications of cell markers for different cell types in this tissue.


-
-
7. Species
Cell Taxonomy characterizes cell types in tens of species, including Homo sapiens, Mus musculus, Drosophila melanogaster, Danio rerio, Rattus norvegicus, Macaca fascicularis and so on. The detailed statistics of species including the number of associated cell types, tissues, cell markers, conditions and publications are displayed.

-
8. Conditions
Hundreds of conditions (mainly diseases) are collected in Cell Taxonomy with standard disease ontology IDs. The detailed statistics of conditions including the number of associated cell types, tissues, cell markers, species and publications are shown.

-
9. scRNA-seq studies
Cell Taxonomy analyzes 146 publicly available scRNA-seq studies containing 3.5 million cells of human and mouse to comprehensively characterize cell types and cell markers. Cells are labelled based on cell types classified in the original publications, and cell types in studies are manually annotated with standardized names in Cell Taxonomy. You can search and filter specific scRNA-seq studies that match certain criteria such as species, cell type and tissue.

-
9.1 Details of the study
The detail information of this study is displayed including the journal, year, PMID, cell number, tissue and library.

-
9.2 Sample
The samples contained in this study are listed with the information of species, tissue, and cell number.

-
9.3 Metadata
The cell number of cell types in tissues is displayed for each sample. And the relevant data in the figures is presented in the table.

-
9.4 Dimensional reduction
The t-SNE and UMAP graph are presented for cell clusters in samples of this study. RunTSNE and RunUMAP method in R Seurat packages were used, and the original annotation of cell types in the study is used as reference for clustering results.

-
9.5 Silhouette coefficient
Cell Taxonomy provides Silhouette coefficient in studies to measure the goodness of cell clusters. Silhouette coefficient ranges from -1 to 1, indicating the difference between intra-cluster distance and inter-cluster distance, where 1 means clusters are well apart from each other, 0 means clusters are indifferent, and -1 means clusters are defined in the wrong way.

-
9.6 Heterogeneity of cell population
An entropy-based statistic, ROGUE, is calculated to accurately quantify the purity of identified cell clusters (B Liu, 2021). A ROGUE value greater than 0.9 indicates a cell cluster with high purity.

-
9.7 Cell marker evaluation
Differential expression pattern of cell markers between one cell type and other cell types is evaluated by FindMarkers in Seurat v4.0 (logFC threshold = 0.25). By selecting the cell type of your interest, you can see the top ranked cell markers for this cell type with high fold change.

Select the gene of your interest, you can see the top ranked cell types for this gene with high fold change.

-
9.8 Cell type specificity
Jensen-Shannon (JS) divergence score (0-1) is calculated to quantify the cell type specificity of one marker gene (Cabili MN, 2011). The JS score greater than 0.6 indicates the higher specificity. By selecting the gene name of your interest, you can see the top ranked cell types in which the gene is specifically expressed.

-
-
10. Publications
Cell Taxonomy contains about two hundred thousand records from manual curation of about 4,300 single-cell related literatures. The publication can be filtered by published year and the detailed cell types and cell markers reported in this publication are shown.


11. Download
Cell Taxonomy provides the download service of all detail information for 3,143 cell types and 26,613 associated cell markers in 257 conditions and 387 tissues across 34 species. From this file, you can easily map Cell Ontology ID to Cell Taxonomy ID.
12. Tools
Cell Taxonomy deploys two useful tools for further mining data in Cell Taxonomy. For example, Cell Type Predictor provides customized analysis to predict cell types by user-provided gene list (possibly identified from scRNA-seq studies). Cell Type Predictor will compare them to cell types with the curated list of cell markers in Cell Taxonomy (top ranked ones based on expression enrichment, publication and conservation) and suggest matching cell types based on similarity scores.

The tool of Cell Type Comparator facilitates comparison of two cell types based on their cell markers and will return the cell-type-shared and cell-type-specific markers.

13. Contact us
If you have any questions or comments, please feel free to contact us via email (wangshiting@big.ac.cn, jiangs@big.ac.cn, qianqiheng2018m@big.ac.cn).
14. How to cite
When using the Cell Taxonomy database, please cite:
[1] Jiang, S., Qian, Q., Zhu, T., Zong, W., Shang, Y., Jin, T., Zhang, Y., Chen, M., Wu, Z., Chu, Y. et al. (2023) Cell Taxonomy: a curated repository of cell types with multifaceted characterization. Nucleic Acids Res, 51, D853-D860.
Link of OpenLB: https://ngdc.cncb.ac.cn/openlb/publication/OLB-PM-36161321
15. Licenses
Cell Taxonomy is free for academic use only. For any commercial use, please contact us for commercial licensing terms.