I. Introduction
1. What is CompoDynamics?
2. What is the data source of CompoDynamics?
3. How did we perform quality control and analyze the data?
4. How is CompoDynamics organized?
II. How to use CompoDynamics?
1. Homepage
2. Browse page
3. Compositions & Features page
4. Tools
5. Statistics
III. Molecular compositions & features
1. Nucleotide content
2. Codon
3. Amino acid
4. Coding potential
5. physicochemical property
6. Phase separation
I. Introduction
CompoDynamics ( https://ngdc.cncb.ac.cn/compodynamics) is a comprehensive database for characterizing molecular characteristics of coding sequences (CDS). Taking advantage of the exponential growth of RefSeq data, CompoDynamics presents rich molecular compositions and features for each CDS and genome, and provides a portal to compare these properties in different species, family domains and functional genes.
CompoDynamics currently contains over 118 million () high-quality CDSs of genes and proteins in genomes (complete/reference/representative) of species (see statistics page for more information). CompoDynamics provides extensive annotation of molecular compositions & features for both genomes and CDSs, including
- Nucleotide Content (four individual nucleotides (A, T, G, C), pairwise combinations (GC, AG, GT, AT, AC, CT) and their positional contents in the 1st/2nd/3rd codon positions)
- Codon (codon usage, RSCU, ENC, CDC)
- Amino acid usage
- Coding potential (coding potential score, coding label, Fickett score)
- Physicochemical properties (molecular weight, surface area, residue volume, hydrophobicity, charge, structure)
- Phase separation (phase separation potential score, disorder region)
Importantly, CompoDynamics provides multi-dimensional tools in exploration of molecular compositions & features, including comparison of multiple molecular compositions & features across species, protein family domains and genes of different function. In addition, CompoAnalyzer facilitates automatic analysis of the molecular compositions & features for user-input sequences.
All coding sequences (*_cds_from_genomic.fna.gz) in archaea, bacteria, fungi, invertebrates, plants, vertebrates (mammals and other), protozoa and viruses from RefSeq were retrieved in May 27, 2020. CDSs from latest and complete/reference/representative genome assemblies were retained.
Sequences of length not a multiple of 3 are removed. CDSs are grouped into different categories, and most of them belong to canonical CDS. The remaining CDSs are labeled accordingly if they (i) lack start codon, (ii) lack stop codon or (iii) contain in-frame stop codon. The various genetic codes of species are considered during this process. Six types of features are calculated for CDS:
| Classes | Calculations |
|---|---|
| Nucleotide | A, G, C, T, GC, AG, GT, AT, AC, CT and their positional contents in the 1st/2nd/3rd codon positions |
| Codon | Codon frequency (observed aaa, observed aag...), RSCU (rscu aag, rscu aaa...), ENC, CDC |
| Amino Acid | Amino acid number and frequency (observed ARG, observed CYS...) |
| Coding Potential | LGC coding label, CPC2 coding label, LGC coding potential score, CPC2 coding probability, Fickett score |
| Physicochemical Property | MW, SA, RV, kdHydrophobicity, wwHydrophobicity, hhHydrophobicity, Positive, Negative, Neutral, Alpha, Beta |
| Phase Separation | disorder percentage, disorder segment, disorder 30aa, disorder 50aa, LLR, COREscore, PAPAprop, PAPAfi, PScore |
Among them, RSCU (Relative Synonymous Codon Usage) values, CDC (Codon Deviation Coefficient) values are computed by CAT (Zhang et al., 2012);
ENC values are computed by CodonW (John Peden); Fickett scores, CPC2 labels are computed by CPC2 (Kang et al., 2017); LGC labels are computed by LGC (Wang et al., 2019);
Phase separation features are calculated by ESpritz (I Walsh et al., 2012), PLAAC (AK Lancaster et al. 2014) and Pi-Pi (RMC Vernon et al., 2018).
Molecular compositions & features in genome scale are calculated by one of the three ways: 1) averaging across all CDSs of that genome;
2) weighted averaging on CDS lengths; 3) calculation based on other genome scale features. For instance,
GC frequencies are averaged by weights of each CDS length to yield genome-level frequencies;
the average value of hydrophobicity represents the value of genome and RSCU AAA values are calculated based on genome codon frequencies.
The logical relationship of CompoDynamics is represented below:

II. How to use CompoDynamics?
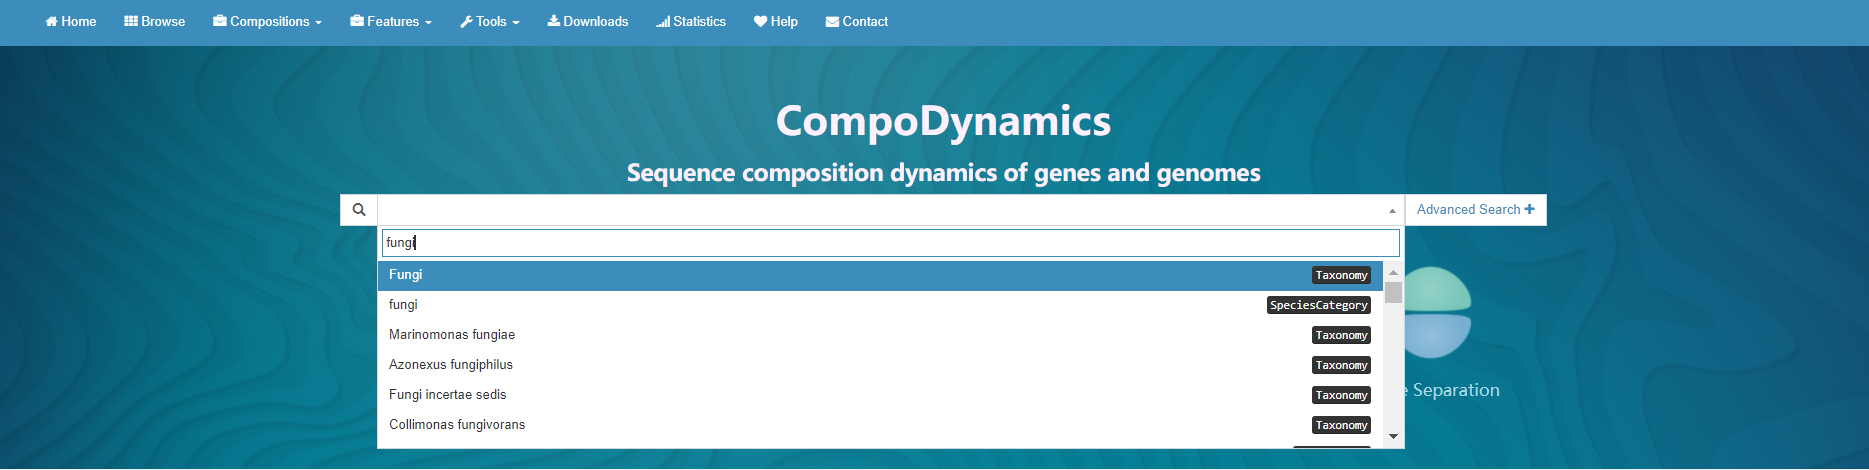
In homepage, CompoDynamics offers a fast and case-insensitive search function. In the quick search box you search for various terms of interest, including:
- Species category, e.g., fungi;
- Taxon, e.g., Cosavirus;
- Organism name, e.g. homo sapiens;
- Assembly accession, e.g. GCF_900128725.1;
- RefSeq item, e.g. NW_003943604.1, NZ_LT667500.1;
- Gene name, e.g. 4a, ACE2;
- Protein name, e.g. Eukaryotic translation initiation factor 2A;
- Protein id, e.g. NP_114414.2;
Advanced search offers more specific filtering options:

By clicking “Search” it will direct you to browse page.

In this page the browse of the genome-level and CDS-level information are provided. It should be noted that the two tables are always associated. It means that the results in CDSs table belong to the genomes in Genomes table under any circumstances.
For more detailed search, click “Show Filters” button, and two kinds of filters (genomes filter and CDSs filter) are provided. The input filters will affect both results in Genomes table and CDSs table.

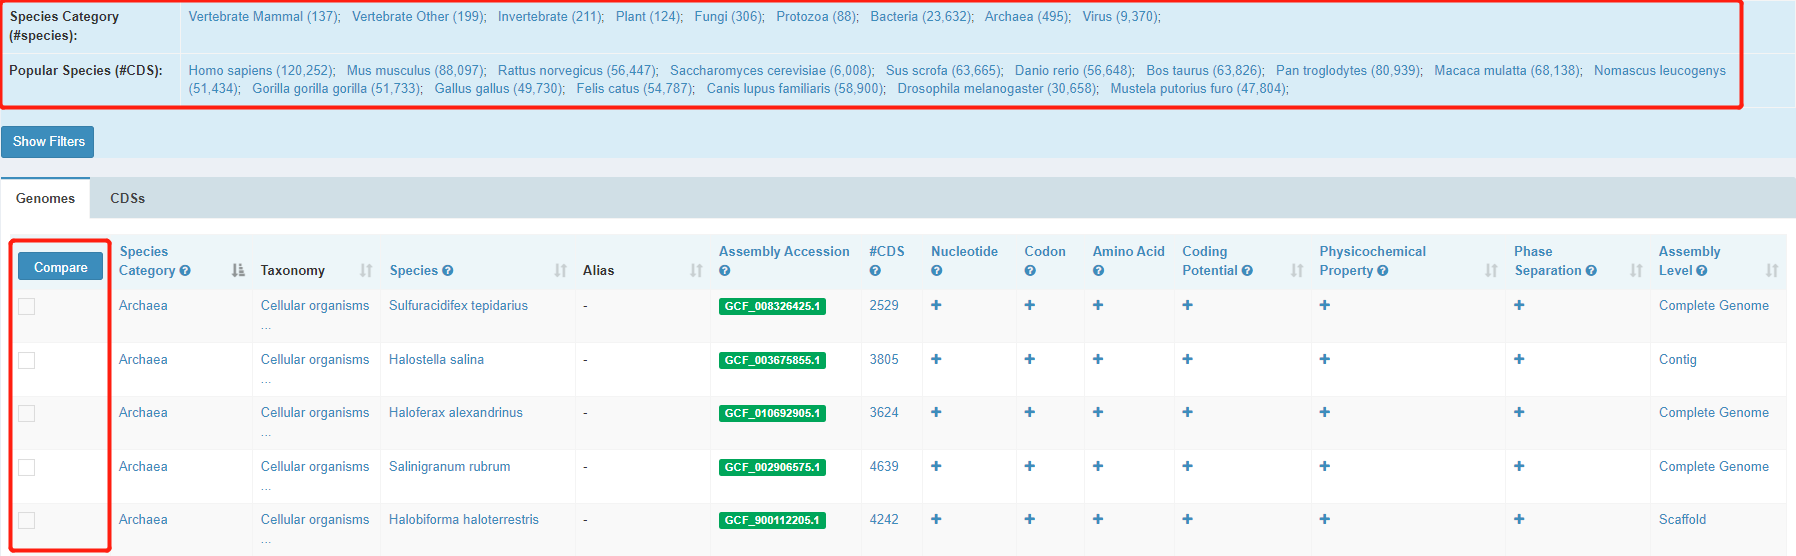
1. Genome-level browse
The Genomes table shows basic information about each genome, including species category, lineage, species, alias, assembly accession and CDS counts. You can get a quick search by clicking a taxonomy or more specific, one of the popular species we provided on this page. After selecting the genomes of interest and then clicking the "compare" button, it will compare all the molecular compositions & features of the genomes selected.
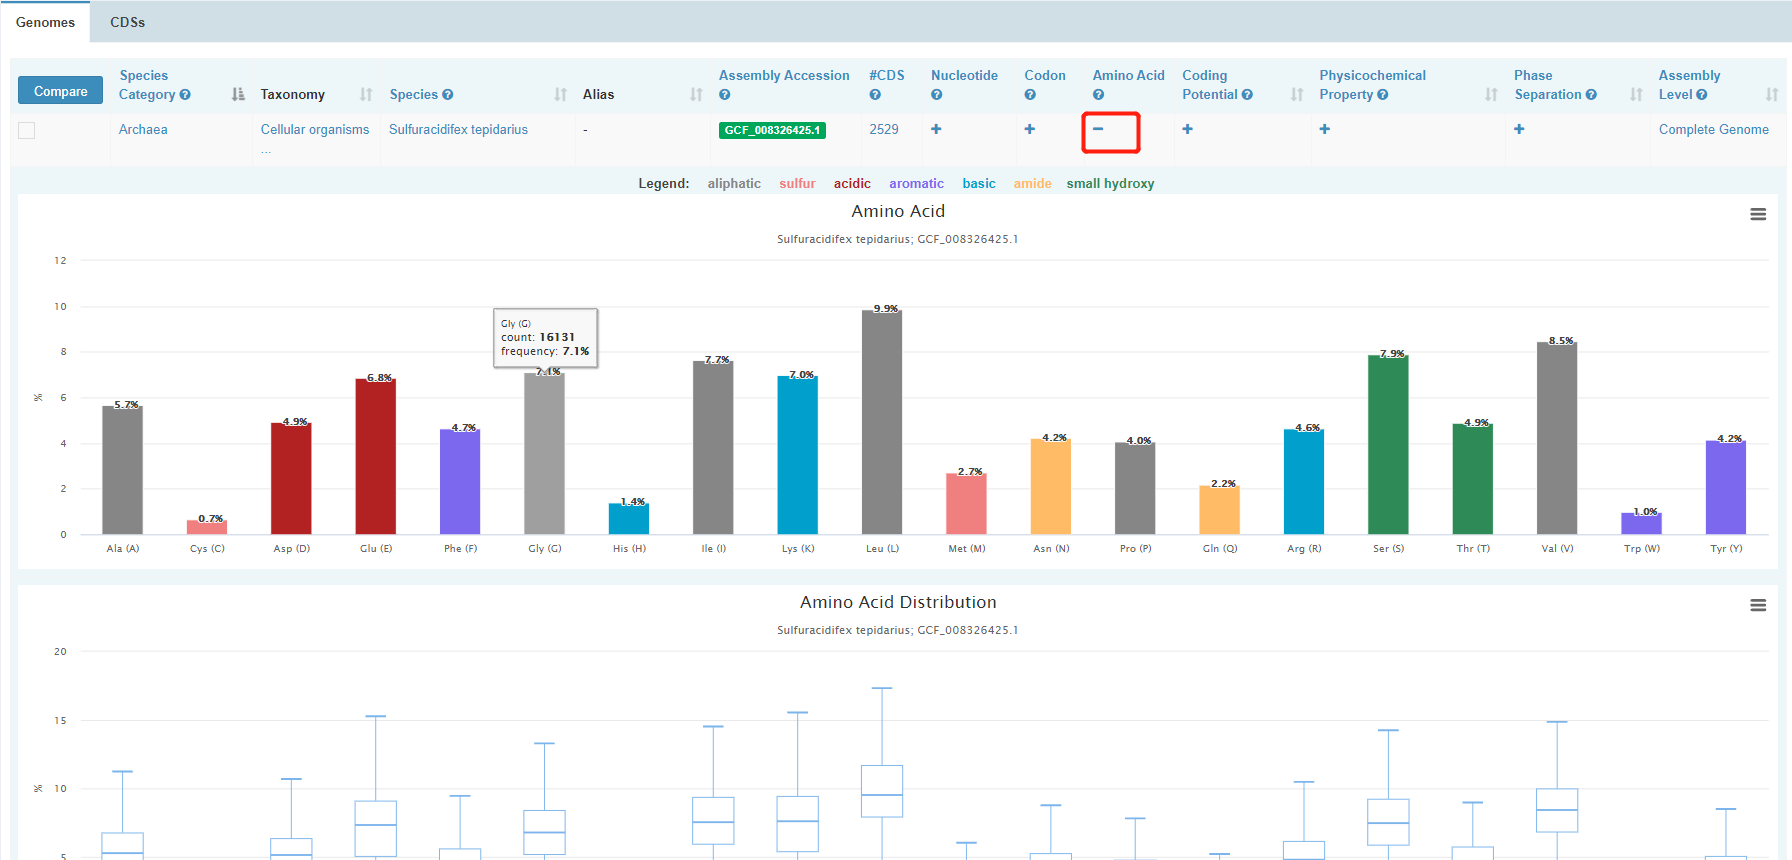
To view interested features of a genome, click “+”. For example, after clicking “+” for “Amino Acid”, it shows the statistics of amino acid usage of the genome.
Clicking a white-on-green term in Genomes table will direct you to the individual page of the genome. In this page, meta information and statistics of molecular compositions & features including nucleotide content, codon, amino acid usage, coding potential, physicochemical property and phase separation are presented in detail for the genome. Most of the graphs can be downloaded.

2. CDS-level browse
CDSs table shows basic information about each CDS, including Gene Name, Protein ID, Protein Name and CDS length.

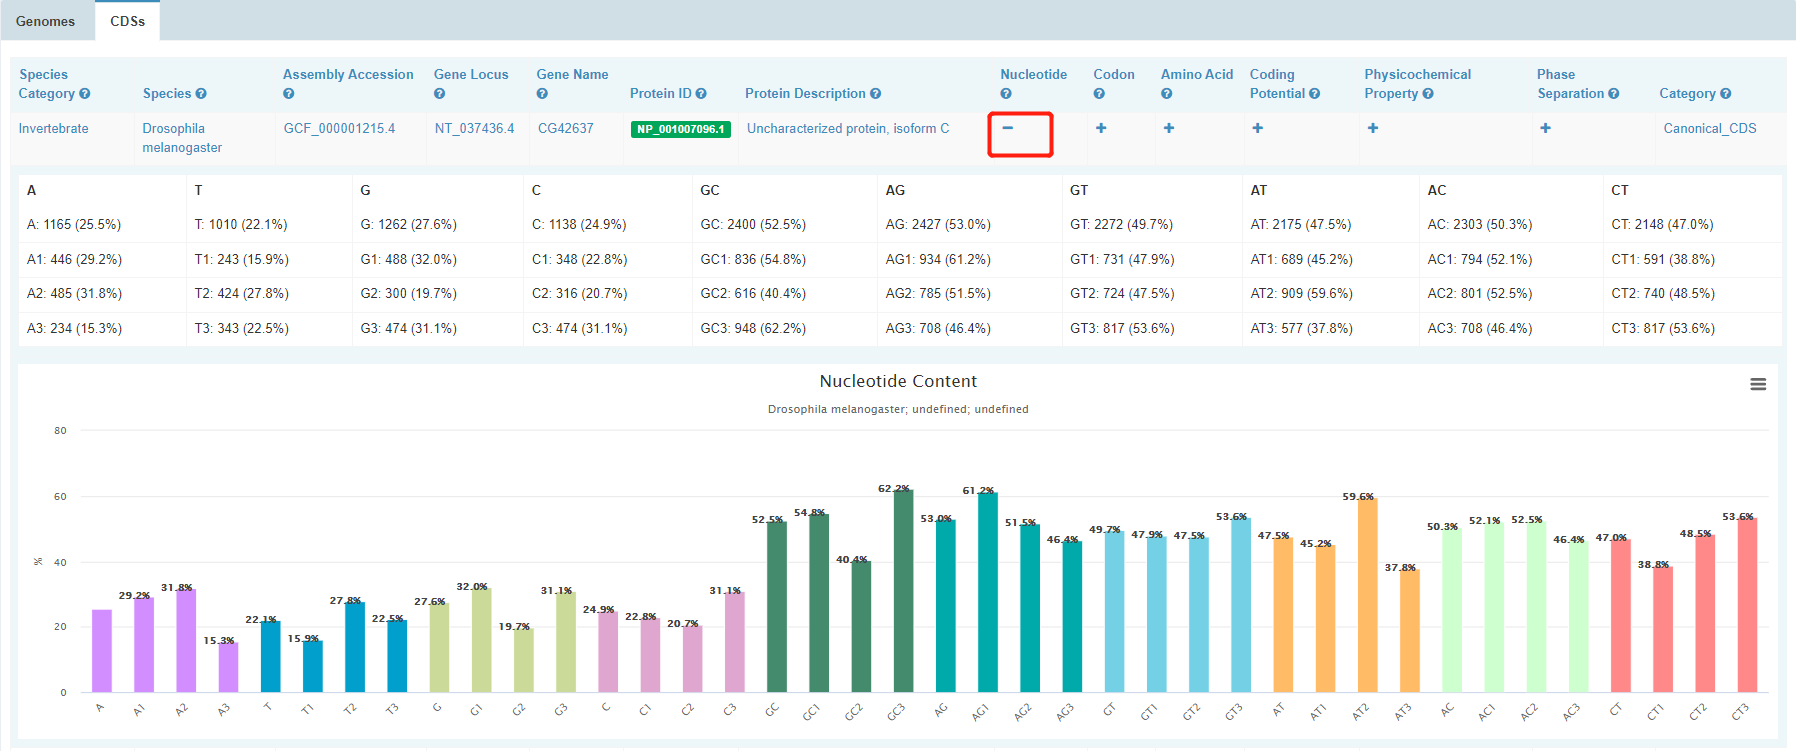
To view interested features of a CDS, click “+”.
Clicking a white-on-green term will direct you to the individual page of the CDS. In this page, meta information and statistics of molecular compositions & features including nucleotide content, codon, amino acid usage, coding potential, physicochemical property and phase separation are presented in detail for the CDS. Most of the graphs can be downloaded.

The Compositions & Features page together present six types of molecular compositions & features: nucleotide content, codon, amino acid usage, coding potential, physicochemical properties and phase separation features.


For example, if you are interested in the most codon-biased genomes in virus, you can go to Compositions-Codon page and sort by either CDC or ENC while applying virus as species category. Select the genomes of interest, and click the “compare” button, it will compare all the molecular compositions & features of the genomes for you.


1. SpeciesComparator
SpeciesComparator compares multiple molecular compositions & features between multiple species you select (up to 5). For example, if you select human and mouse, it will return you the available genomes.

Select from these genomes and click the “Compare” button, and it will compare multiple molecular compositions & features between the two genomes.
2. FamilyComparator
FamilyComparator compares multiple molecular compositions & features between CDSs of multiple Pfam families/domains. For example, if you select human as species and Trypsin and SH2 as family names, it will return you the available Pfam families/domains. The corresponding CDSs are listed in the CDS table.

Select from these Pfam families/domains and click the “Compare” button, it will compare multiple molecular compositions & features between CDSs of these families/domains.
3. GOComparator
GOComparator compares multiple molecular compositions & features between CDSs of multiple GO terms. For example, if you select mouse as species and cytoplasm and nucleus as function terms, it will return you the available GO terms. The corresponding CDSs are listed in the CDS table.

Click Compare button to compare.
4. CompoAnalyzer
CompoAnalyzer automatically analyzes the molecular compositions & features for user-input sequences. You can input your sequences in the box or upload your fasta file. Then select species or genetic code and click the “Run” button.

The molecular compositions & features of the sequences you input will be returned to you, including nucleotide content, codon, amino acid usage, coding potential, physicochemical property and phase separation features. All the data can be downloaded.
Data statistics is provided to help users obtain an overview of compositions and features, Chargaff’s rules and the relationship between GC content and other compositions/features across various species categories.

III. Molecular compositions & features
1. Nucleotide Content
- Four individual nucleotides (A, T, G, C)
- Pairwise combinations (GC, AG, GT, AT, AC, CT)
- Positional contents in the 1st/2nd/3rd codon positions.
2. Codon
- Codon usage (AAA, AAG, …): Percentage of 64 codons used by a CDS (CDS level) or a the coding region of a genome (Genome level).
-
RSCU (RSCU AAG, RSCU AAA, …): RSCU values are computed by CAT (Zhang et al., 2012). RSCU stands for relative synonymous codon usage,
it is the ratio of the observed frequency of codons to the expected frequency given that all the synonymous codons for the same amino acids
are used equally. For instance, Threonine is encoded by 4 synonymous codons: ACA, ACG, ACC, ACT. Thus RSCU ACG is calculated as
(observed_ACG * 4 )/(observed_ACN), where N stands for all 4 nucleotides. For genome level, RSCUs are computed based on the genome codon usage.
-
ENC: ENC values are computed by CodonW (John Peden). ENC stands for effective number of codons (Wright F., 1990). The value is between 20 (when one codon is used effectively for each aa) and 61 (when codons are used randomly for each aa). For genome level, ENC is computed as the mean of all CDSs of the genome.
-
CDC:CDC values are computed by CAT (Zhang et al., 2012). CDC stands for codon deviation coefficient. CDC effectively accounts for background nucleotide composition in estimating codon usage bias and utilizes a bootstrap assessment of the statistical significance of codon usage bias. For genome level, CDC is computed as the mean of all CDSs of the genome.
3. Amino Acid
- Amino Acid Usage (Ala, Cys, ...): Percentage of 20 codons used by a CDS (CDS level) or the coding region of a genome (genome level).
4. Coding Potential
-
CPC2 label, LGC label: Coding/noncoding classification provided by CPC2 (Kang et al., 2017) and LGC (Wang et al., 2019). For genome level, numbers (freqs) of CDSs predicted as CPC2 coding/CPC2 noncoding/LGC coding/LGC noncoding/coding in both/noncoding in both/TUCP (Transcripts of Uncertain Coding Potential, meaning predicted as coding by one method but noncoding by the other) are provided.
-
CPC2 coding probability, LGC coding potential score: The coding potential estimates provided by CPC2 and LGC. For genome level, the values are computed as the mean of all CDSs of the genome.
- Fickett Score: Fickett Scores are computed by CPC2 (Kang et al. 2017). Fickett Score is used to examine the coding probability by accounting both combinational effect of nucleotide composition and codon usage bias (Fickett J.W., 1982). For genome level, Fickett Score is computed as the mean of all CDSs of the genome.
5. Physicochemical Property
Physicochemical properties, including molecular weight, residue volume, surface area, structure and charge, are scaled from 0 to 1. For each genome, the grand average of hydropathicity (GRAVY) is calculated as a sum of each amino acid frequency multiplied by its hydrophobicity value based on the Kyte-Doolittle method. Likewise, genome-wide averages of other physicochemical properties are also calculated in a similar way as GRAVY (Kyte J et al., 1982).
- MW: Relative molecular weight of the protein product. Note that the weight is normalized by protein length. MW is computed as the mean of relative molecular weights of all the amino acids weighted by aa frequency. The table below shows the weights of each aa:
-
SA: Relative surface area of the protein product. The value is normalized by protein length. SA is computed as the mean of
surface areas of all the amino acids weighted by aa frequency. The table below shows the relative surface areas of each aa:
For genome level, SA is computed as the mean of all CDSs of the genome. -
RV: Relative residue volume of the protein product. The value is normalized by protein length. RV is computed as the mean of relative
residue volumes of all the amino acids weighted by aa frequency. The table below shows the residue volume of each aa:
For genome level, RV is computed as the mean of all CDSs of the genome. -
kdHydrophobicity, wwHydrophobicity, hhHydrophobicity: These are hydrophobicity values based on different hydrophobicity scales: kdHydrophobicity
(Kyte J et al., 1982), wwHydrophobicity
(Wimley W.C. et al., 1996), and hhHydrophobicity
(Hessa T et al., 2005).
Hydrophobicity is computed as the mean of hydrophobicities of all the amino acids weighted by aa frequency.
The hydrophobicity values for amino acids in the three scales are listed in the table below.
For genome level, hydrophobicity is computed as the mean of all CDSs of the genome.
-
Positive, Negative, Neutral: These are the fractions of positively/negatively/neutrally charged amino acids. Among the 20 amino acids,
five have a side chain which can be charged. Lys, His and Arg are positively charged; Glu and Asp are negatively charged.
The other 15 amino acids are neutrally charged.
For genome level, these three values are computed as the mean of all CDSs of the genome. -
Alpha, Beta: These are the fractions of amino acids which promote α-helix/β-sheet secondary structures. 8 amino acids promote α-helix
(Ala, Cys, Glu, Gln, His, Leu, Lys, Met). 6 β-sheet (promote Ile, Phe, Thr, Trp, Tyr, Val).
For genome level, these two values are computed as the mean of all CDSs of the genome.
Amino acid 3-letter 1-letter MW RV [1] SA [2] kdHydrophobicity [3] wwHydrophobicity [4] hhHydrophobicity [5] Alpha [6] Beta [6] Alanine Ala A 89.09318 88.6 115 1.80 -0.17 0.11 1.29 0.90 Arginine Arg R 174.20096 173.4 225 -4.50 -0.81 2.58 0.96 0.99 Asparagine Asn N 132.11792 114.1 160 -3.50 -0.42 2.05 0.90 0.76 Aspartic acid Asp D 133.10268 111.1 150 -3.50 -1.23 3.49 1.04 0.72 Cysteine Cys C 121.15818 108.5 135 2.50 0.24 -0.13 1.11 0.74 Glutamine Gln Q 146.1445 143.8 180 -3.5 -0.58 2.36 1.27 0.80 Glutamic acid Glu E 147.12926 138.4 190 -3.50 -2.02 2.68 1.44 0.75 Glycine Gly G 75.06660 60.1 75 -0.40 -0.01 0.74 0.56 0.92 Histidine His H 155.15456 153.2 195 -3.20 -0.96 2.06 1.22 1.08 Isoleucine Ile I 131.17292 166.7 175 4.50 0.31 -0.60 0.97 1.45 Leucine Leu L 131.17292 166.7 170 3.80 0.56 -0.55 1.30 1.02 Lysine Lys K 146.18756 168.6 200 -3.90 -0.99 2.71 1.23 0.77 Methionine Met M 149.21134 162.9 185 1.9 0.23 -0.1 1.47 0.97 Phenylalanine Phe F 165.18914 189.9 210 2.8 1.13 -0.32 1.07 1.32 Proline Pro P 115.13046 112.7 145 -1.6 -0.45 2.23 0.52 0.64 Serine Ser S 105.09258 89.0 115 -0.80 -0.13 0.84 0.82 0.95 Threonine Thr T 119.11916 116.1 140 0.70 -0.14 0.52 0.82 1.21 Tryptophan Trp W 204.22518 227.8 255 -0.90 1.85 0.30 0.99 1.14 Tyrosine Tyr Y 181.18854 193.6 230 -1.3 0.94 0.68 0.72 1.25 Valine Val V 117.14634 140.0 155 4.20 -0.07 -0.31 0.91 1.49 [1]. RV: Zamyatnin, A.A. 1972. Prog Biophys Mol Biol. 24: 107-123.
[2]. SA: Chothia, C. 1976. J Mol Biol. 105: 1-12.
[3]. kdHydrophobicity: A simple method for displaying the hydropathic character of a protein. Kyte J, Doolittle RF. J Mol Biol. 1982 May 5;157(1):105-32.
[4]. wwHydrophobicity: Experimentally determined hydrophobicity scale for proteins at membrane interfaces. Wimley WC, White SH. Nat Struct Biol. 1996 Oct;3(10):842-8.
[5]. hhHydrophobicity: Recognition of transmembrane helices by the endoplasmic reticulum translocon. Hessa T, Kim H, Bihlmaier K, Lundin C, Boekel J, Andersson H, Nilsson I, White SH, von Heijne G. Nature. 2005 Jan 27;433(7024):377-81
[6]. Alpha, Beta: Chou, P.Y. and Fasman, G.D. 1974.. Biochemistry. 13: 222-245.
6. Phase Separation
-
Total % Disorder, Disorder Segment, Disorder 30AA, Disorder 50AA: ESpritz (I Walsh et al., 2012)
calculates the proportion of IDR (intrinsically disordered regions)
regions in each protein sequence (Total % Disorder), the number and location of IDRs greater than 30aa (Disorder 30AA),
the number and location of IDRs greater than 50aa (Disorder 50AA), and the number and length of total IDR regions (Disorder Segment).
For genome level, the numbers and percentages of CDSs containing Disorder Segment/Disorder 30AA/Disorder 50AA are computed. - COREscore, LLR, PAPAprop, PAPAfi: These values are computed by PLAAC (AK Lancaster et al. 2014). COREscore value (larger value indicates higher phase separation potential), LLR (for log-likelihood ratio), PAPAprop and PAPAfi scores are calculated by PLAAC for each coding sequence.
-
PScore: Phase separation propensity score (PScore) is computed by Pi-Pi (RMC Vernon et al., 2018).
It is the number of π-π electrostatic interactions indicative of potential for phase separation. If the PScore is greater than 4, it represents a very strong phase separation potential.