Basic information
Metadata
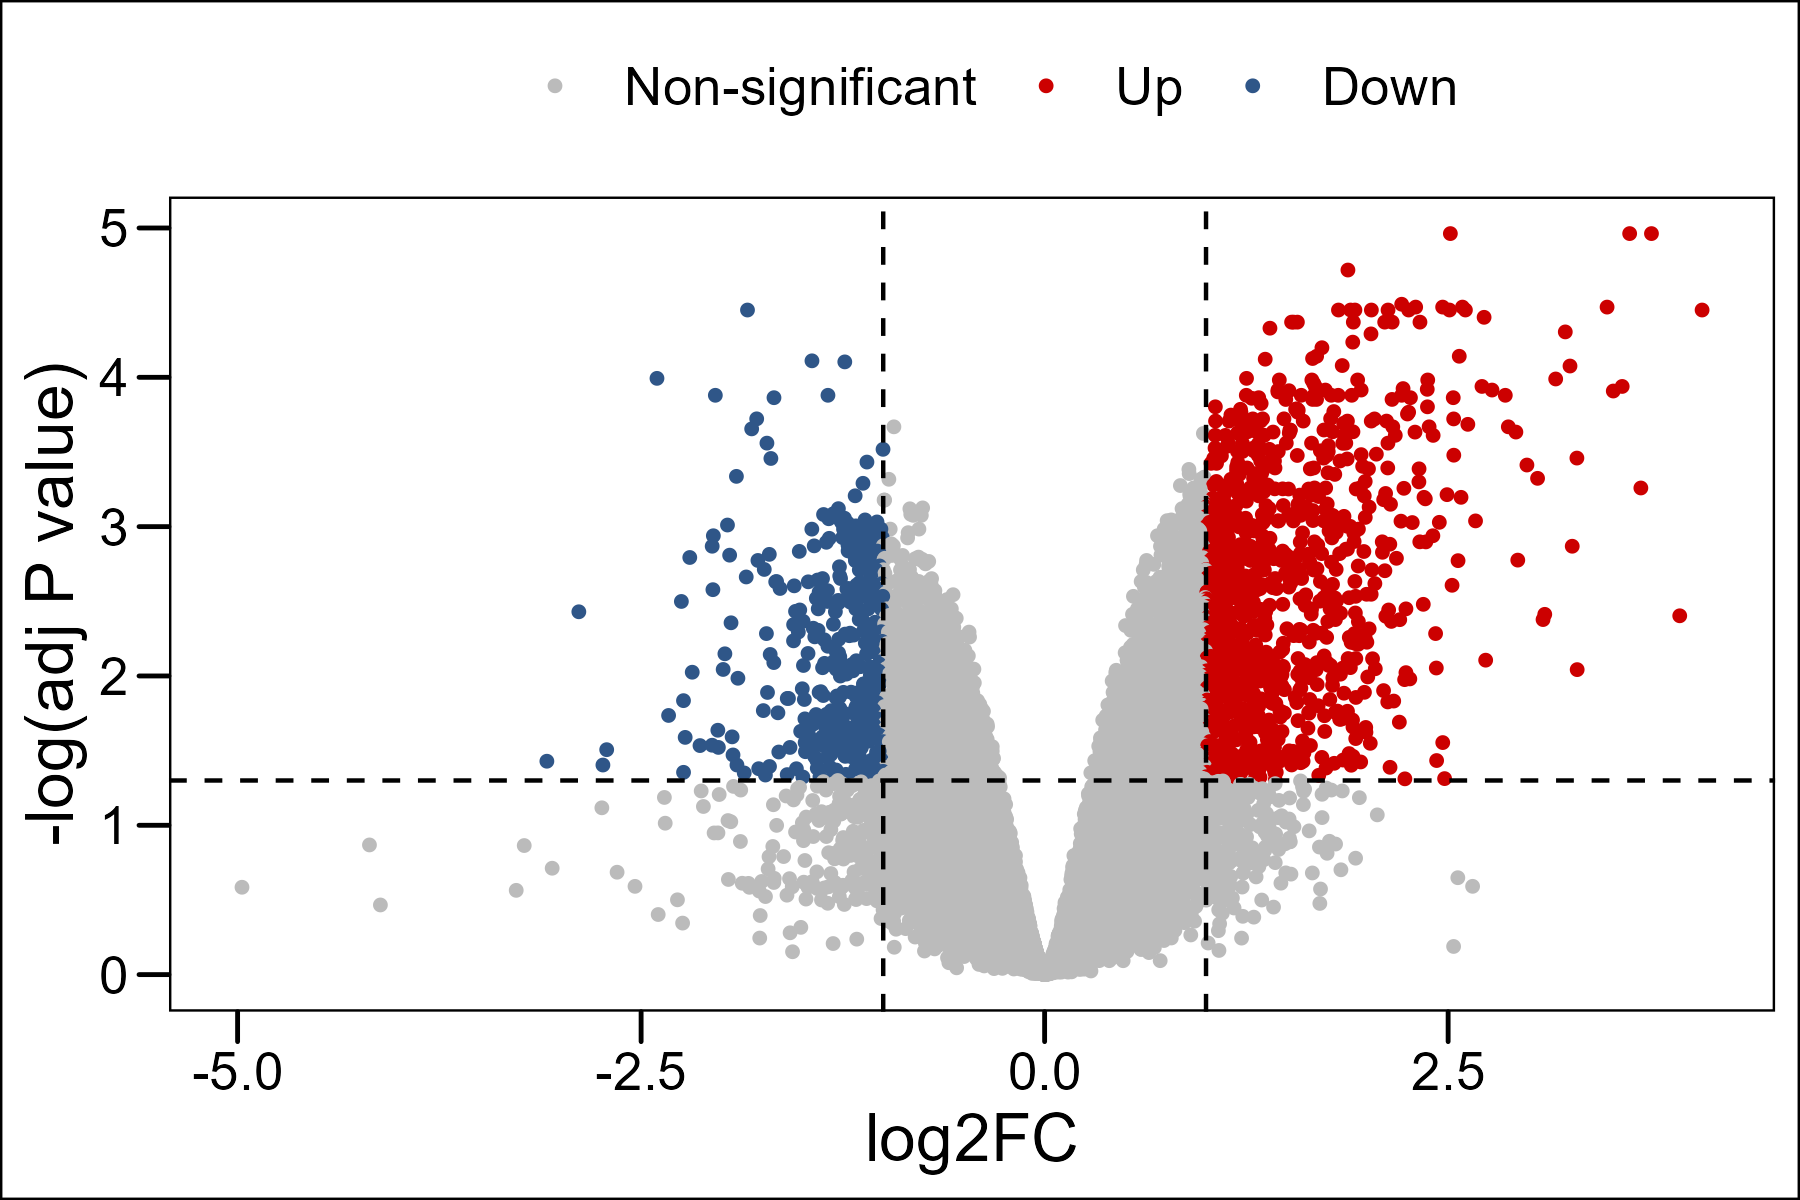
Differential analysis
| Symbol | log2FC | P value | Adjusted P value | Group1 | Group2 |
|---|
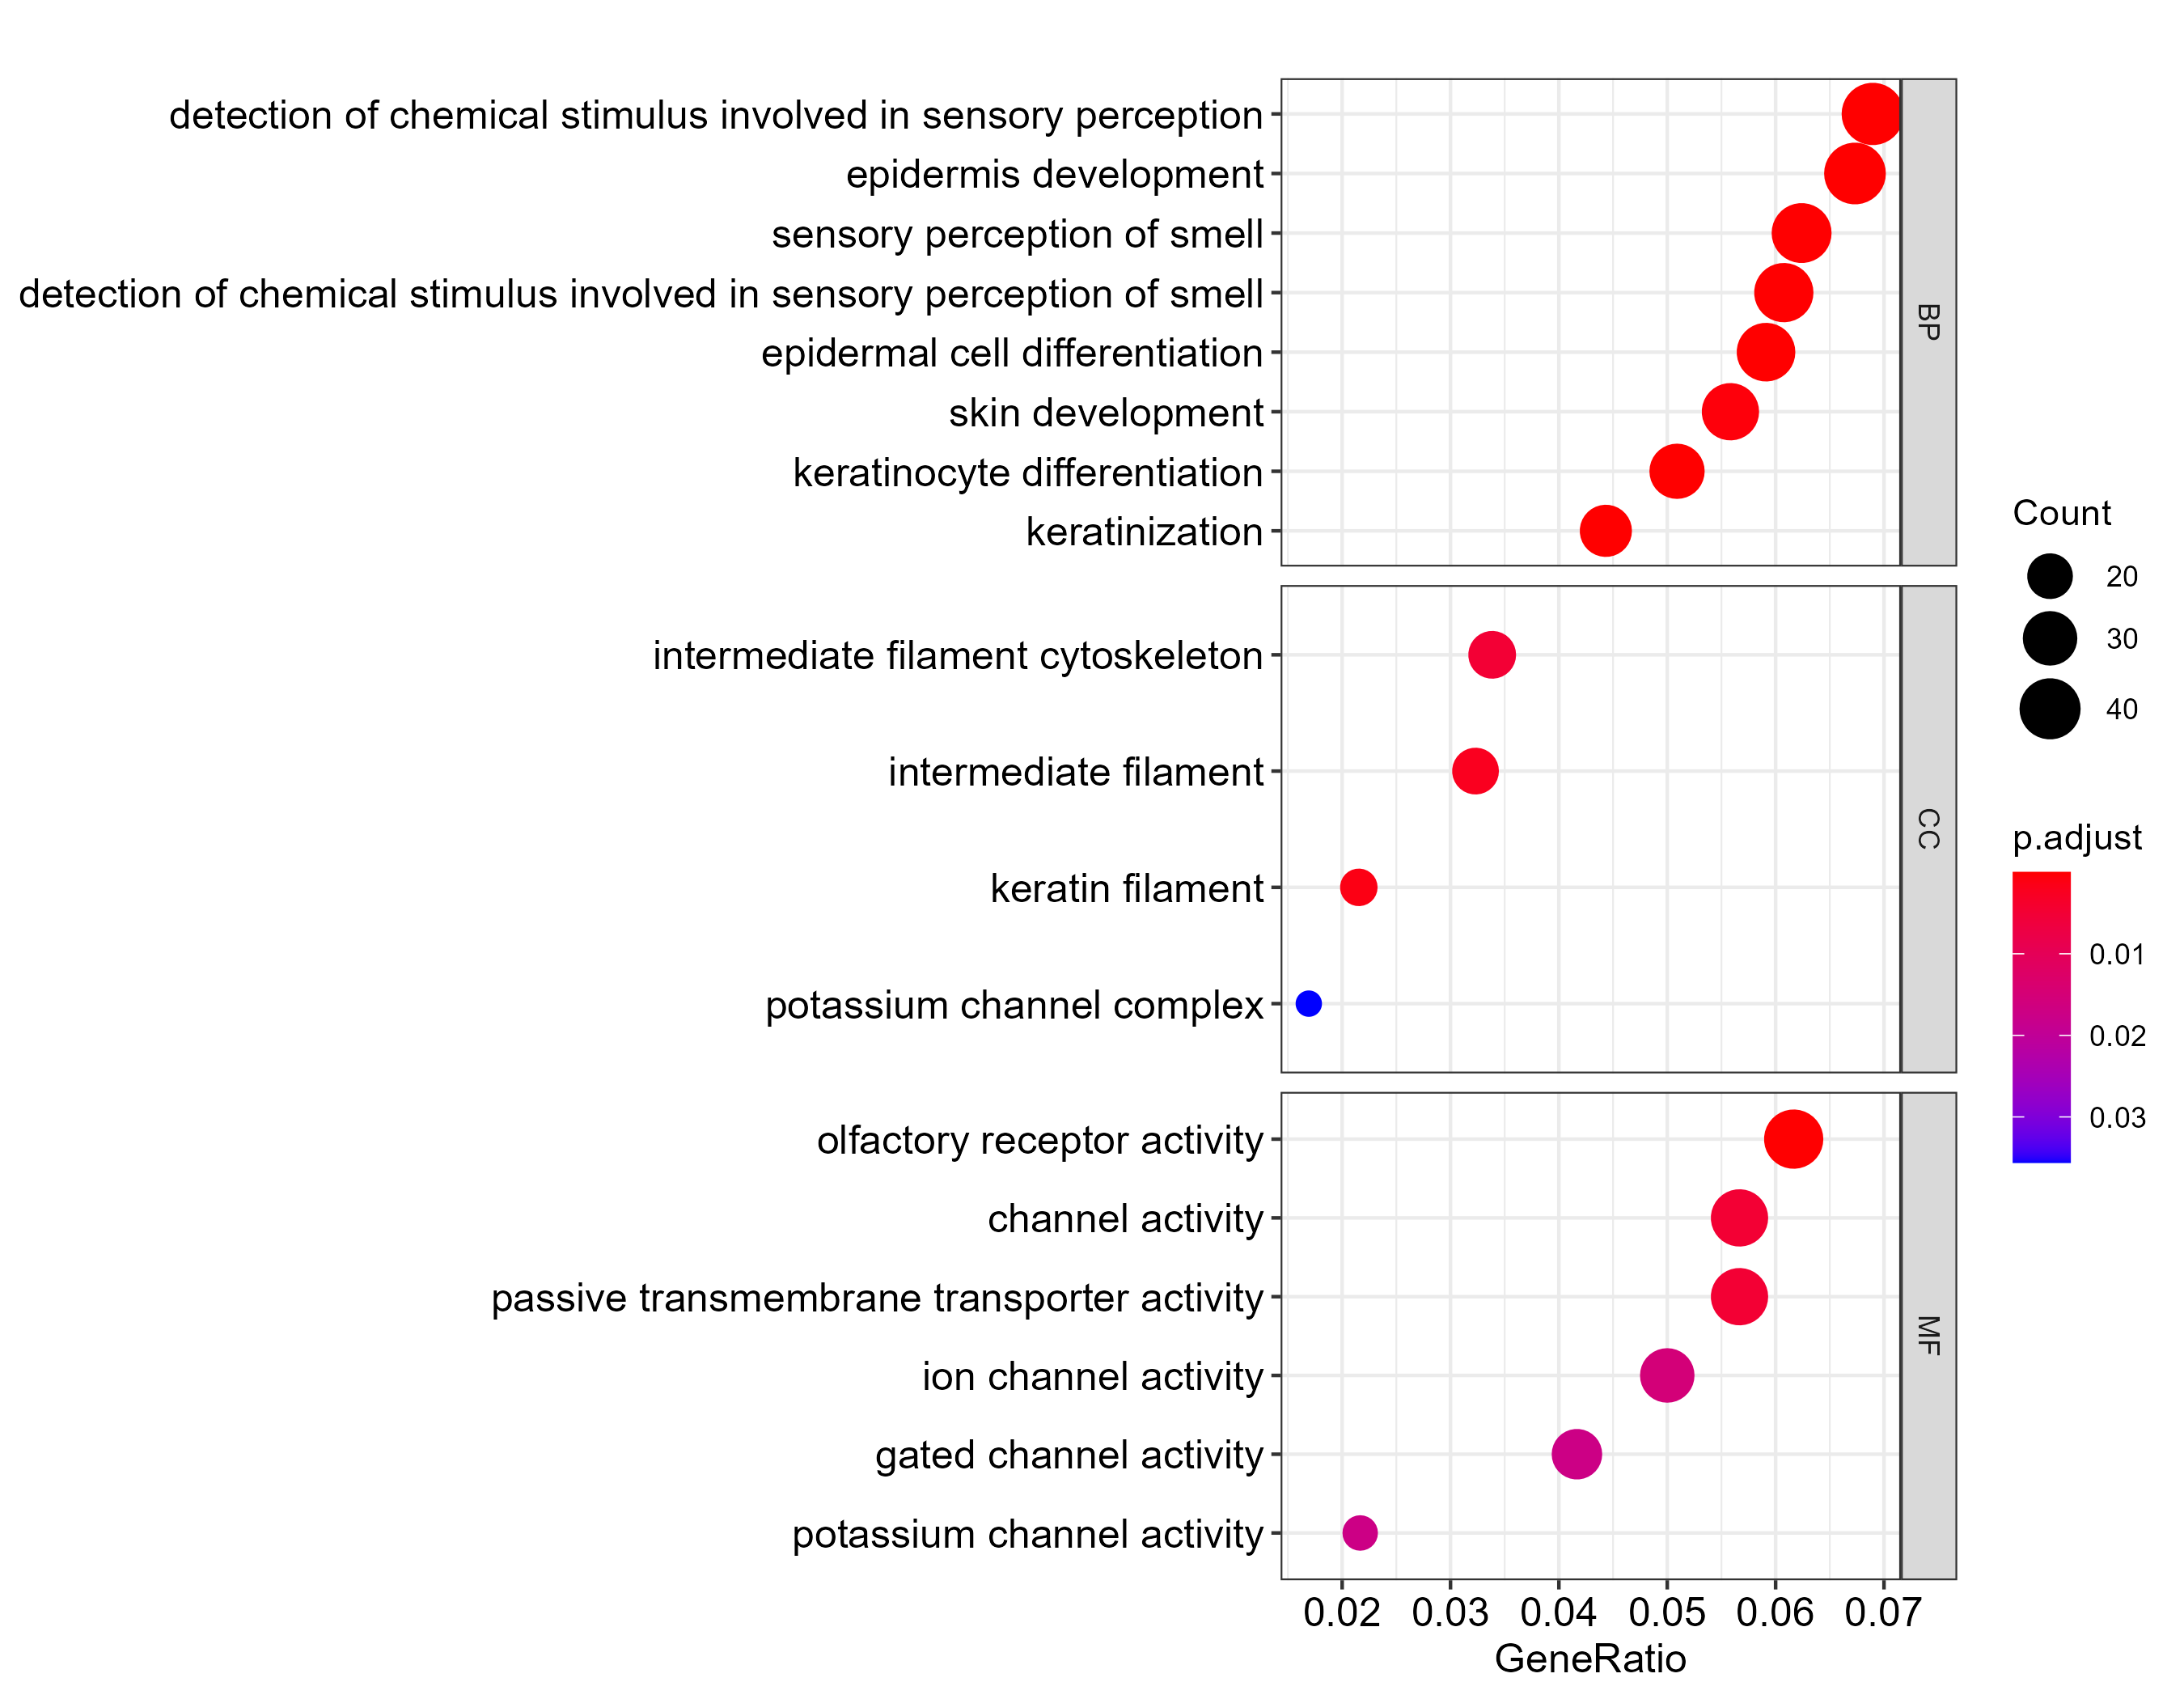
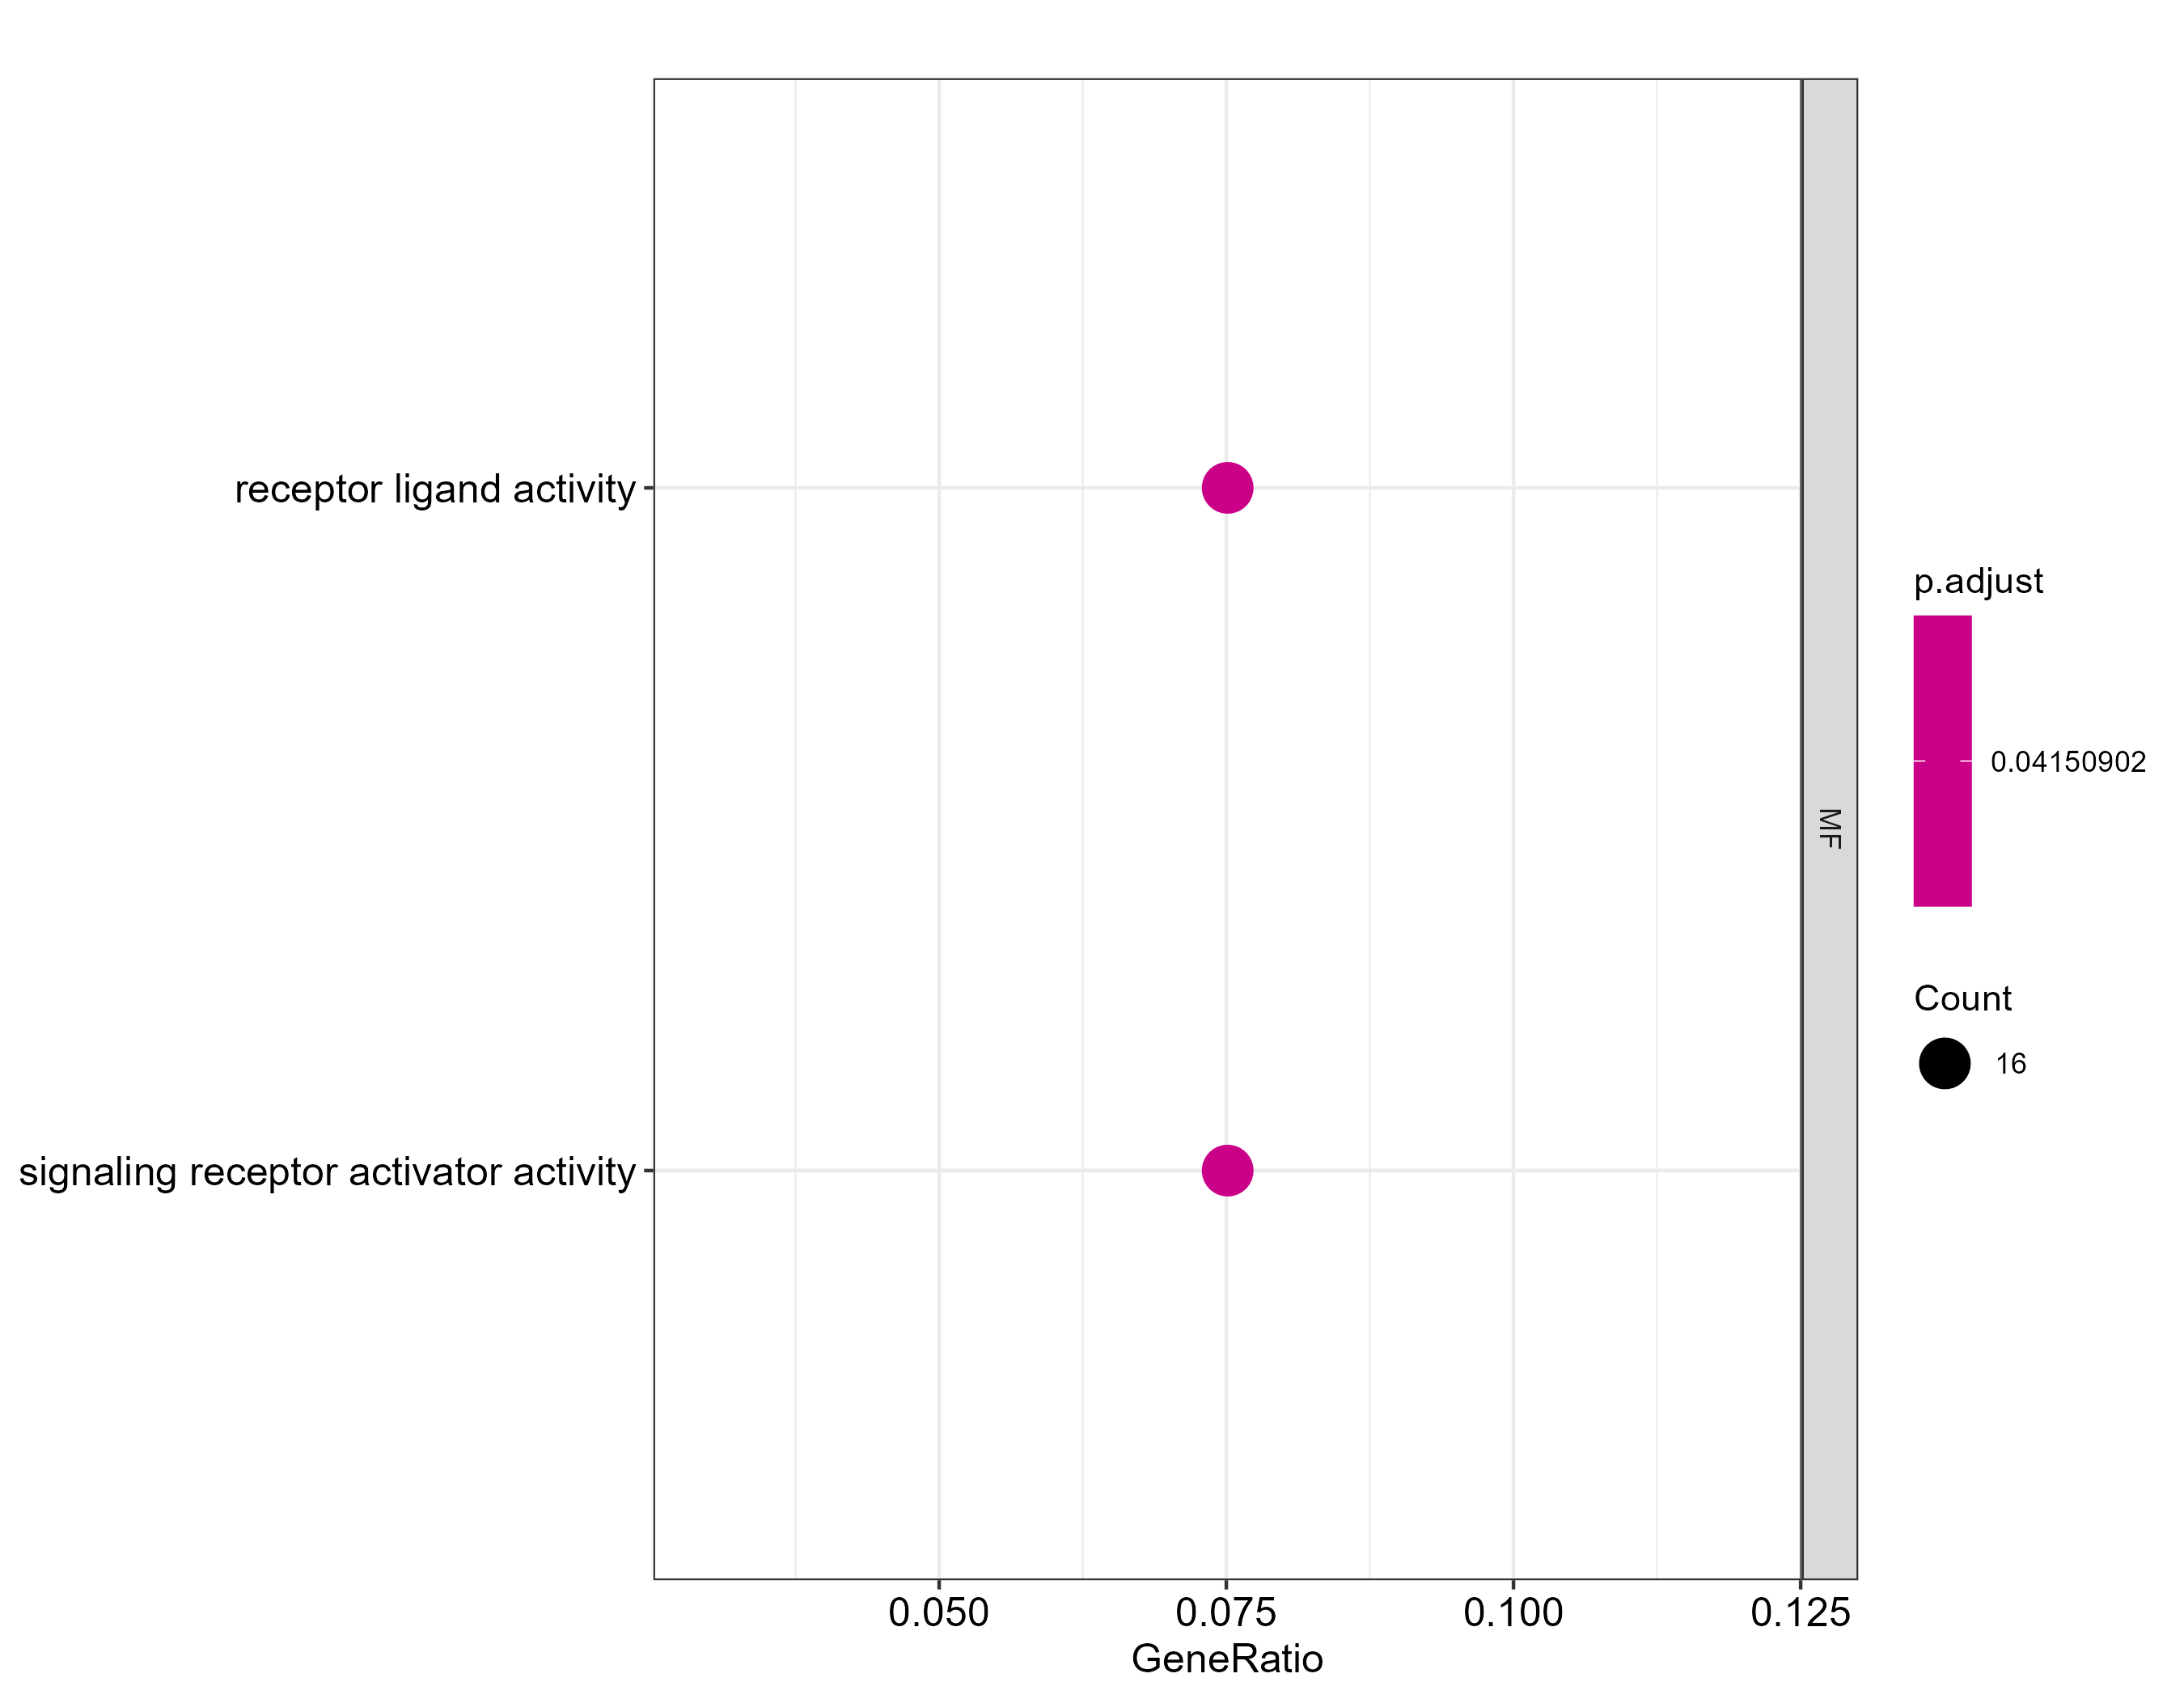
GO enrichment
Gene expression
XG


| Symbol | log2FC | P value | Adjusted P value | Group1 | Group2 |
|---|
