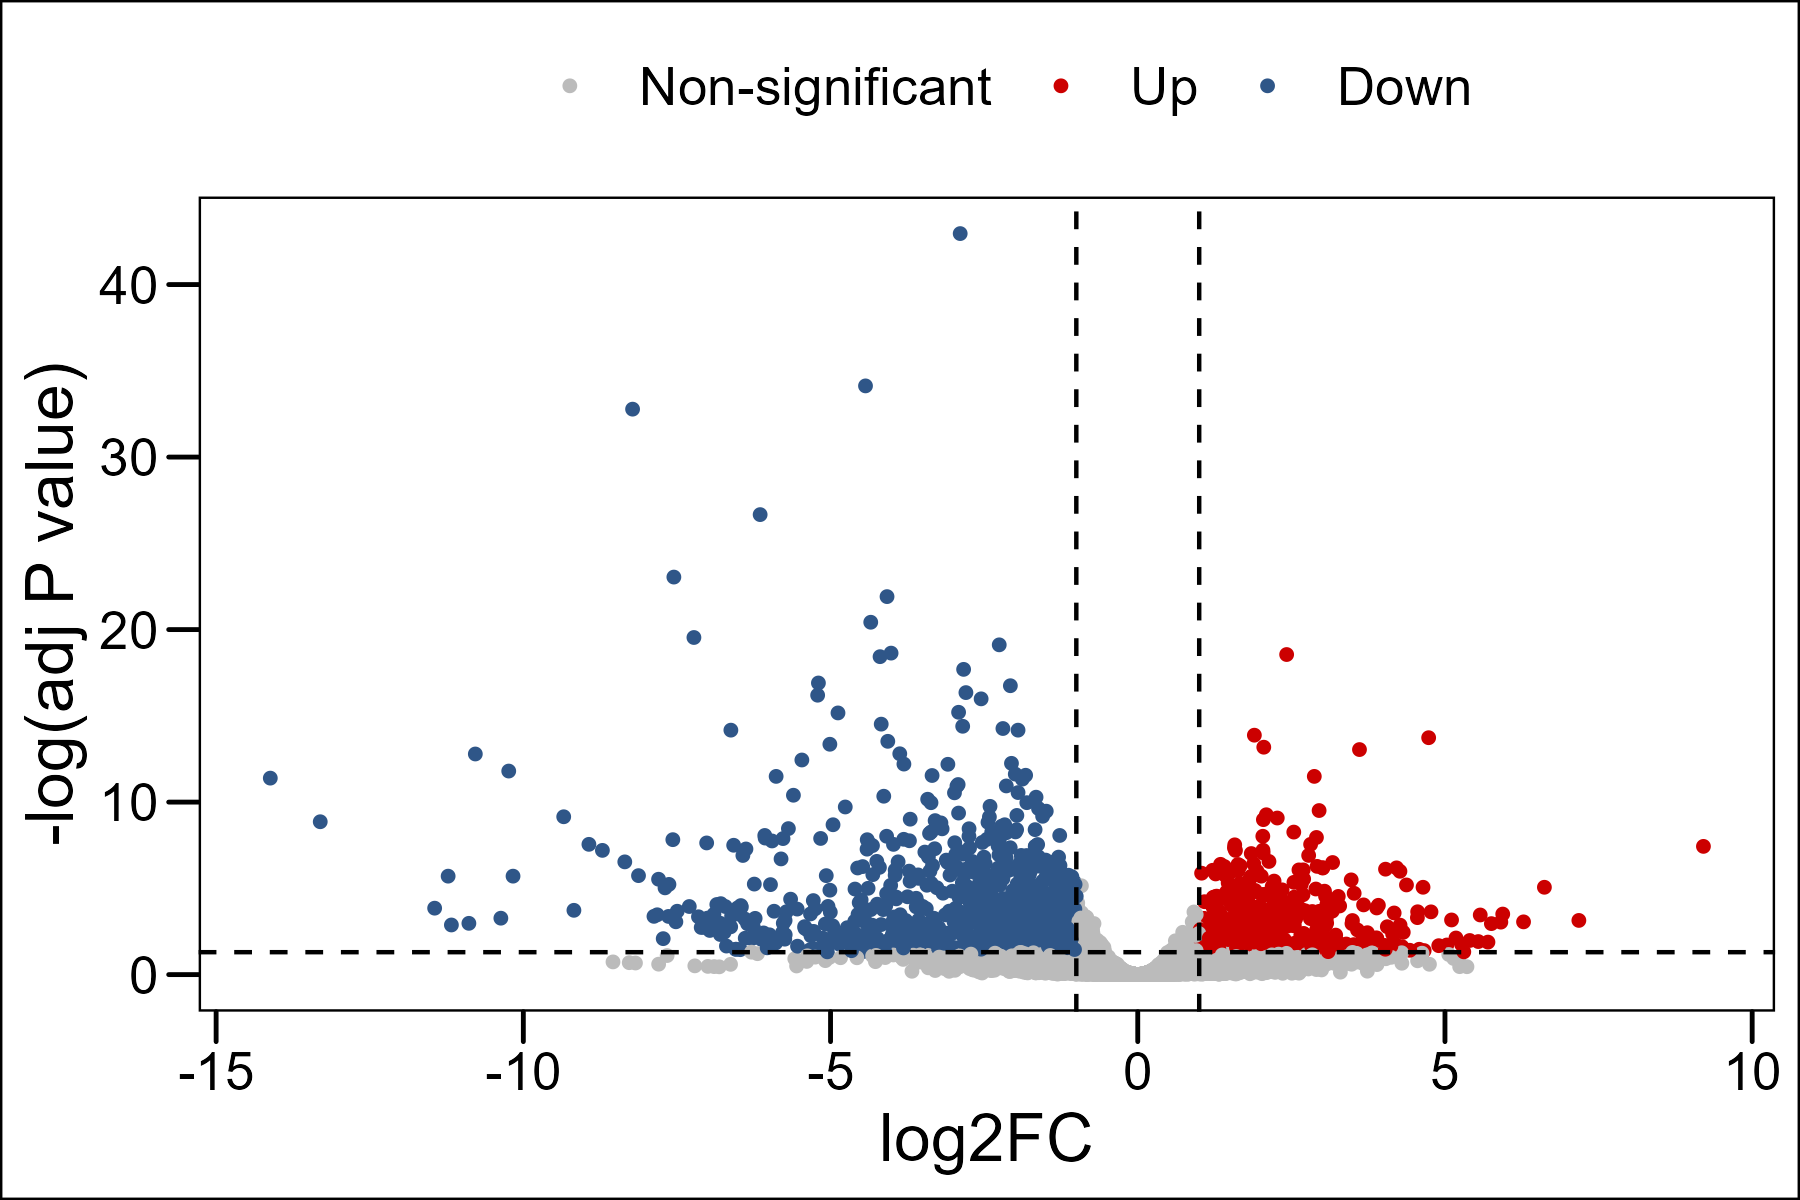
- Up: log2FC > 1 and adjusted P value <0.05
- Down: log2FC < -1 and adjusted P value <0.05
- Non-significant: -1 < log2FC < 1 or adjusted P value >0.05
| Symbol |
log2FC |
P value |
Adjusted P value |
Group1 |
Group2 |
![]()

| Ontology |
GO ID |
GO term |
GeneRatio |
BgRatio |
P value |
Adjusted P value |
Q value |
Gene count |
Regulatory trend |
ENSG00000287085
- Only top 100 pairs are retained and displayed in network plot, ordered by 'Weight'.
| Node 1 |
Node 2 |
Weight |
Detail |