Toggle navigation
Databases
Tools
Standards
Publications
About
Cardiovascular Disease Atlas
Data release 1.0
Home
Browse
Disease
Trait
Dataset
Gene
SNP
Association
Publication
Search
Knowledge graph
Disease
Trait
Gene
Tool
Enrichment analysis
Signature comparison
Download
Documentation
Home
Dataset
CVDS000073
CVDS000073
Basic information
Metadata
Differential expressed gene
GO enrichment
Gene expression
Co-expression network
Basic information
Omics
Disease
Tissue/cell type
Method
Number of samples
CVD Atlas ID
GEO link
Transcriptomics
Intracranial aneurysm
Intracranial artery
Microarray
30
CVDS000073
GSE75436
Metadata
GEO accession
Run
BioSample
Experiment
Reported condition
Mapped Condition
Tissue
Search:
GEO accession
Condition
Tissue
GSM1955147
Control
Superficial temporal artery
GSM1955148
Intracranial aneurysm
Intracranial aneurysm
GSM1955149
Control
Superficial temporal artery
GSM1955150
Intracranial aneurysm
Intracranial aneurysm
GSM1955151
Control
Superficial temporal artery
GSM1955152
Intracranial aneurysm
Intracranial aneurysm
GSM1955153
Intracranial aneurysm
Intracranial aneurysm
GSM1955154
Control
Superficial temporal artery
GSM1955155
Intracranial aneurysm
Intracranial aneurysm
GSM1955156
Control
Superficial temporal artery
Showing 1 to 10 of 30 entries
Previous
1
2
3
Next
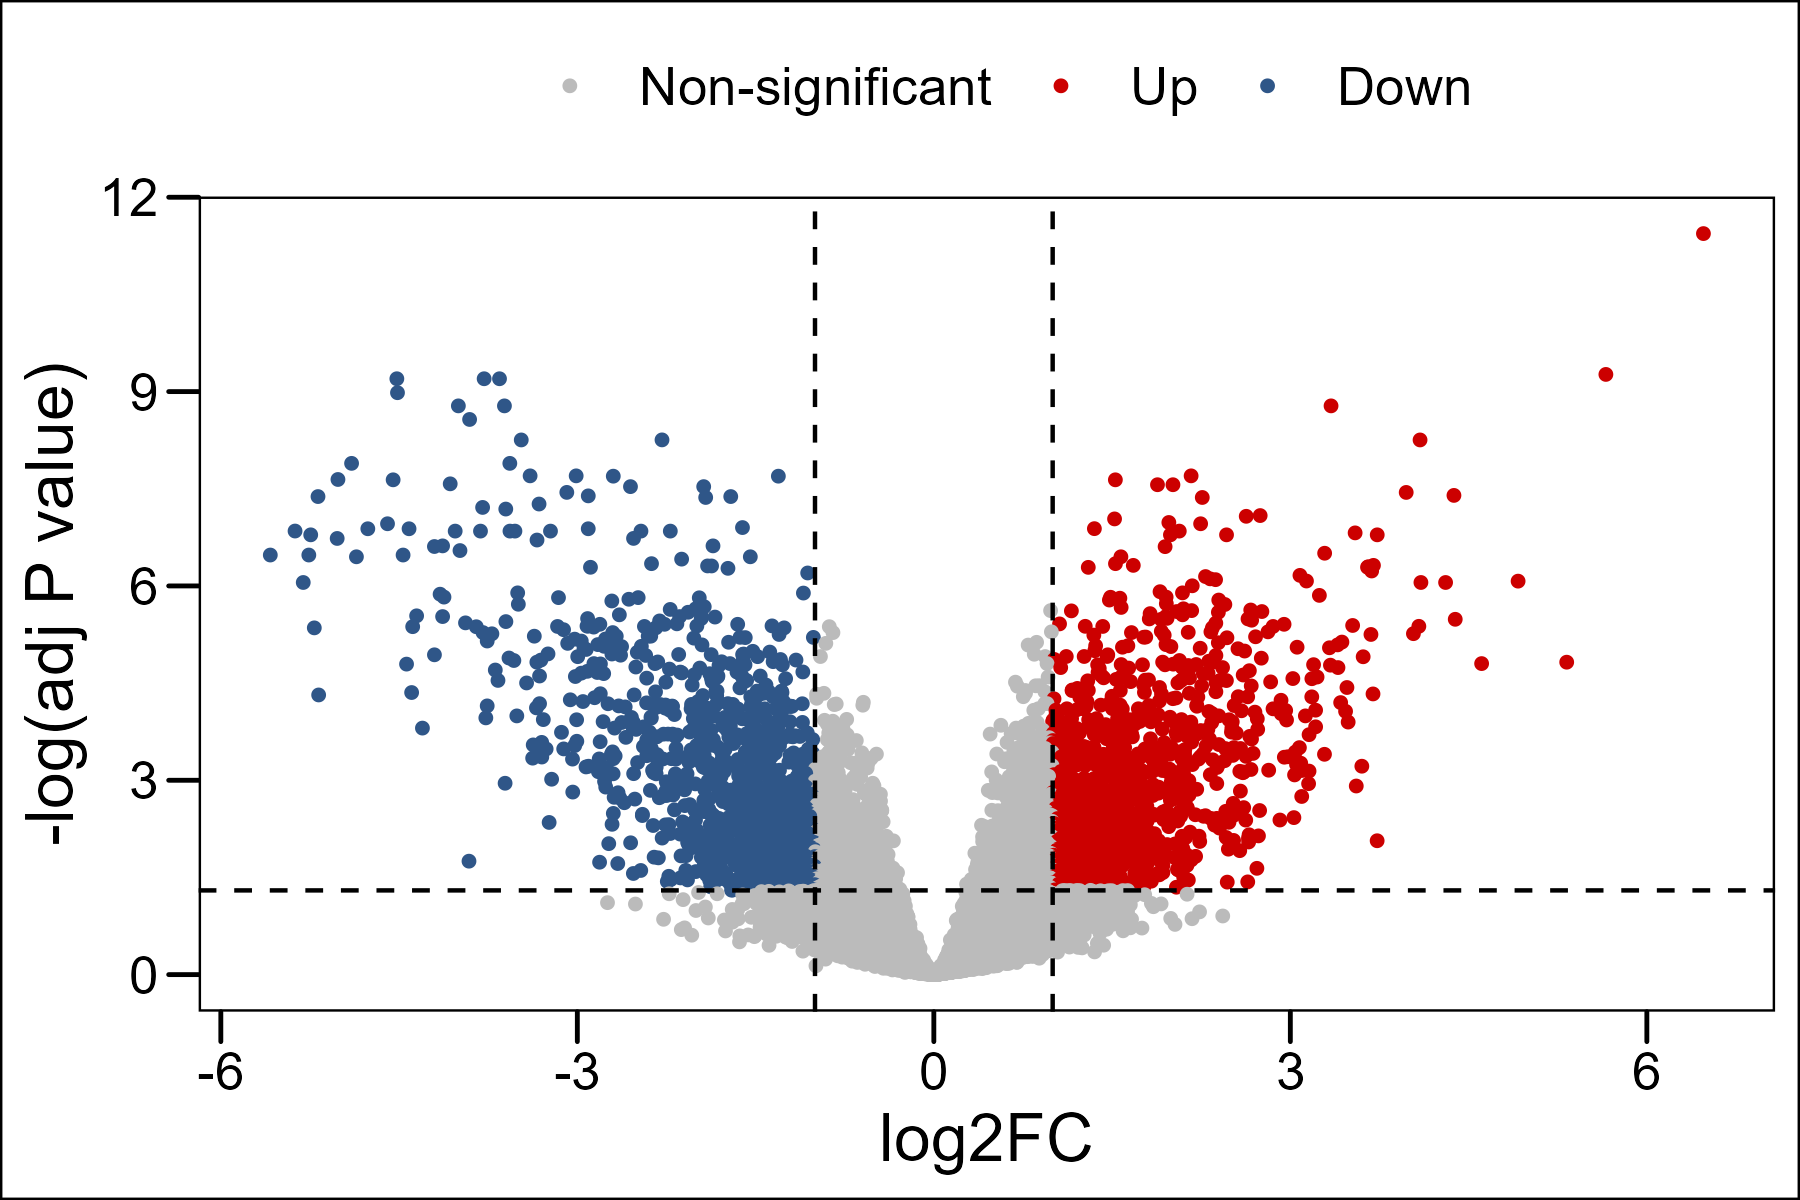
Differential analysis
Up: log2FC > 1 and adjusted P value <0.05
Down: log2FC < -1 and adjusted P value <0.05
Non-significant: -1 < log2FC < 1 or adjusted P value >0.05
Only show significant DEGs
Search:
Symbol
log2FC
P value
Adjusted P value
Group1
Group2
No data available in table
Showing 0 to 0 of 0 entries
Previous
Next
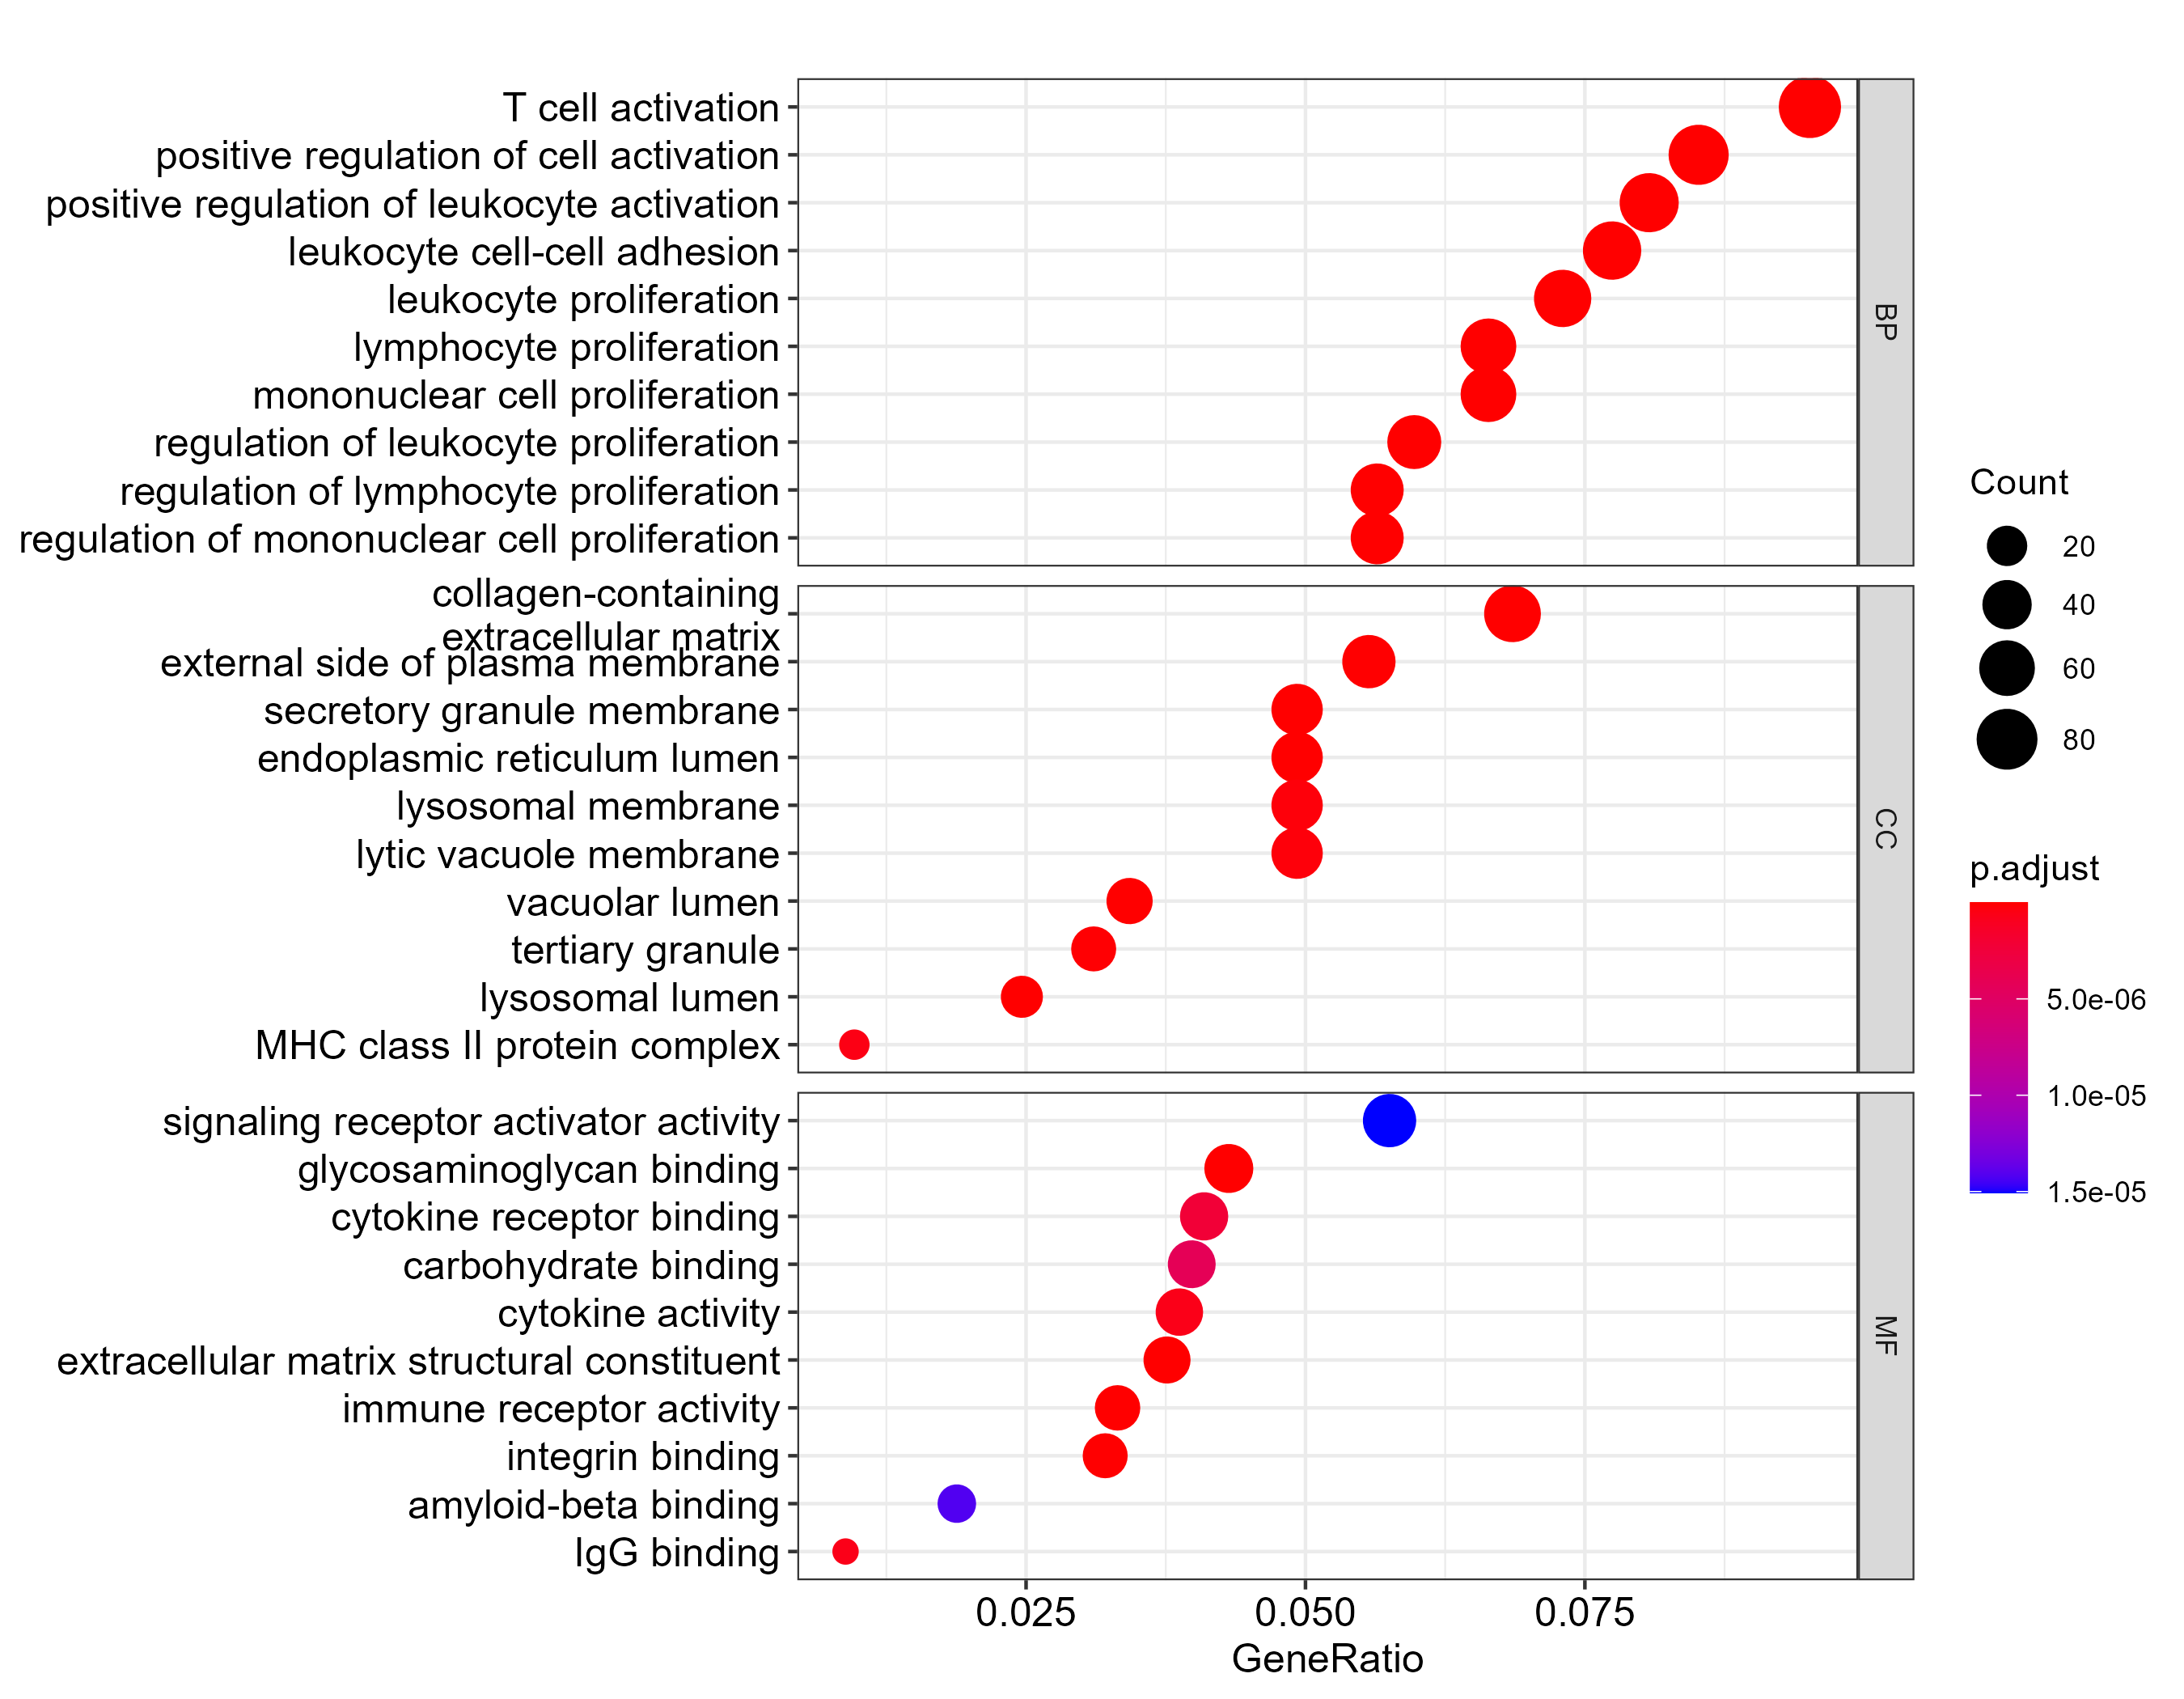
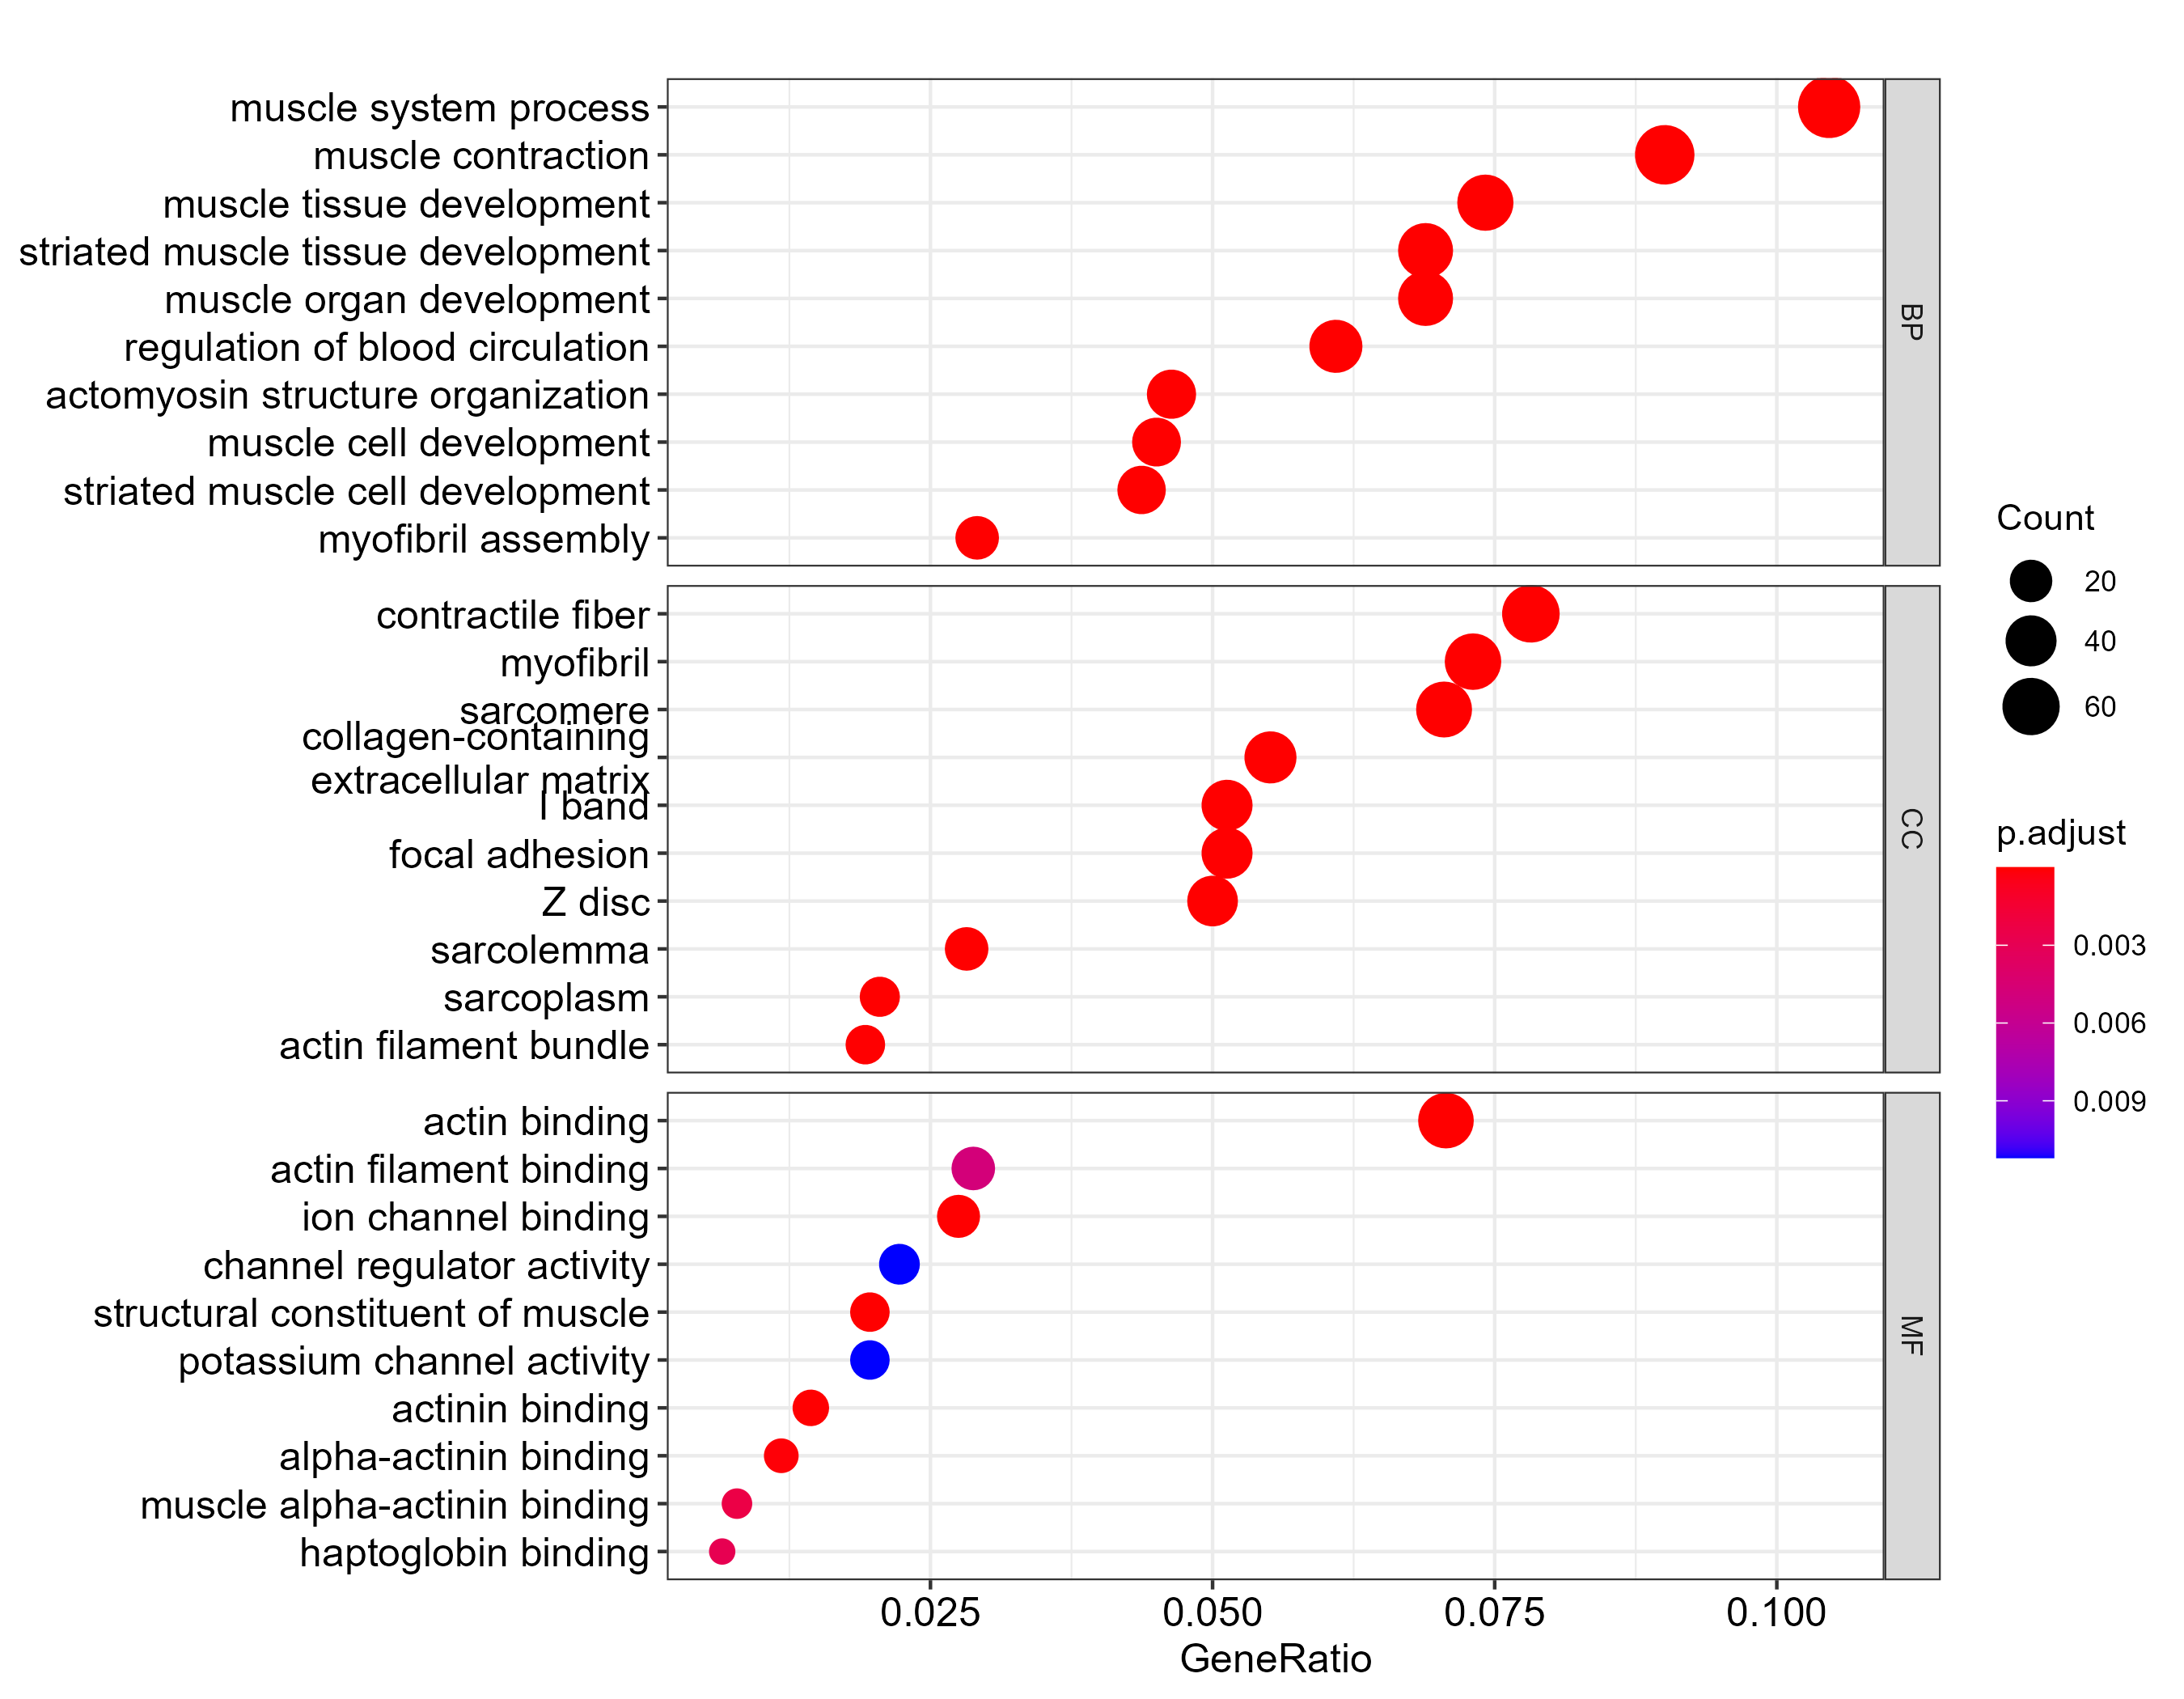
GO enrichment
Up regulated
Down regulated
Search:
Ontology
GO ID
GO term
GeneRatio
BgRatio
P value
Adjusted P value
Q value
Gene count
Regulatory trend
No data available in table
Showing 0 to 0 of 0 entries
Previous
Next
Gene expression
TH
TH
Expression level
0
1
2
3
4
5
6
7
Control
Intracranial aneurysm
Search:
Gene
Condition
Min
Q1
Median
Q3
Max
TH
Control
0.65
3.49
4.55
5.04
6.3
TH
Intracranial aneurysm
1.24
3.27
4.53
4.98
5.59
Showing 1 to 2 of 2 entries
Previous
1
Next
Co-expression network
No result.
Module
Trait
Correlation
P value
Module
Only top 100 pairs are retained and displayed in network plot, ordered by 'Weight'.
Node 1
Node 2
Weight
Detail
XXXX
Basic information
Metadata
Significant SNP
Colocalization
Basic information
CVD Atlas ID
CVDS000506
Data type
GWAS summary statistics
Disease/trait
Title
PubMed ID
GWAS Catalog link
Link
Metadata
Study
Number of cases
Number of controls
Total
Ancestry
Significant SNP
No SNP with a p value less than 5e-8.
SNP
Effect allele
Other allele
Beta
Standard error
P value
Odds ratio
Colocalization
No data available.
Gene
Tissue
#SNPs
PP.H4.abf
PP4/PP3
Coloc SNP
GWAS risk SNP
PP.H0.abf
PP.H1.abf
PP.H2.abf
PP.H3.abf
XXXX
Basic information
Differentially expressed metabolite
Basic information
CVD Atlas ID
Omics
Reported disease
Mapped disease
Tissue
Number of samples
Data source
Differential analysis
Metabolite
Reported disease
Mapped disease
VIP
Super class
Main class
Sub class
Formula
Exact mass
PubChem ID
Dataset
XXXX
Basic information
Differentially expressed protein
Basic information
CVD Atlas ID
Omics
Reported disease
Mapped disease
Tissue
Number of samples
Data source
Differential analysis
UniProt ID
Average log2FC
P value
XXXX
Basic information
Metadata
Differential methylation position
GO enrichment
Basic information
CVD Atlas ID
Disease
Omics
Tissue/cell type
Method
Number of samples
GEO link
Metadata
GEO accession
Reported condition
Mapped condition
Tissue
GO enrichment
ID
Gene
Delta beta
P value
Adjusted P value
GO enrichment
Up regulated
Down regulated
Loading