Basic information
Metadata
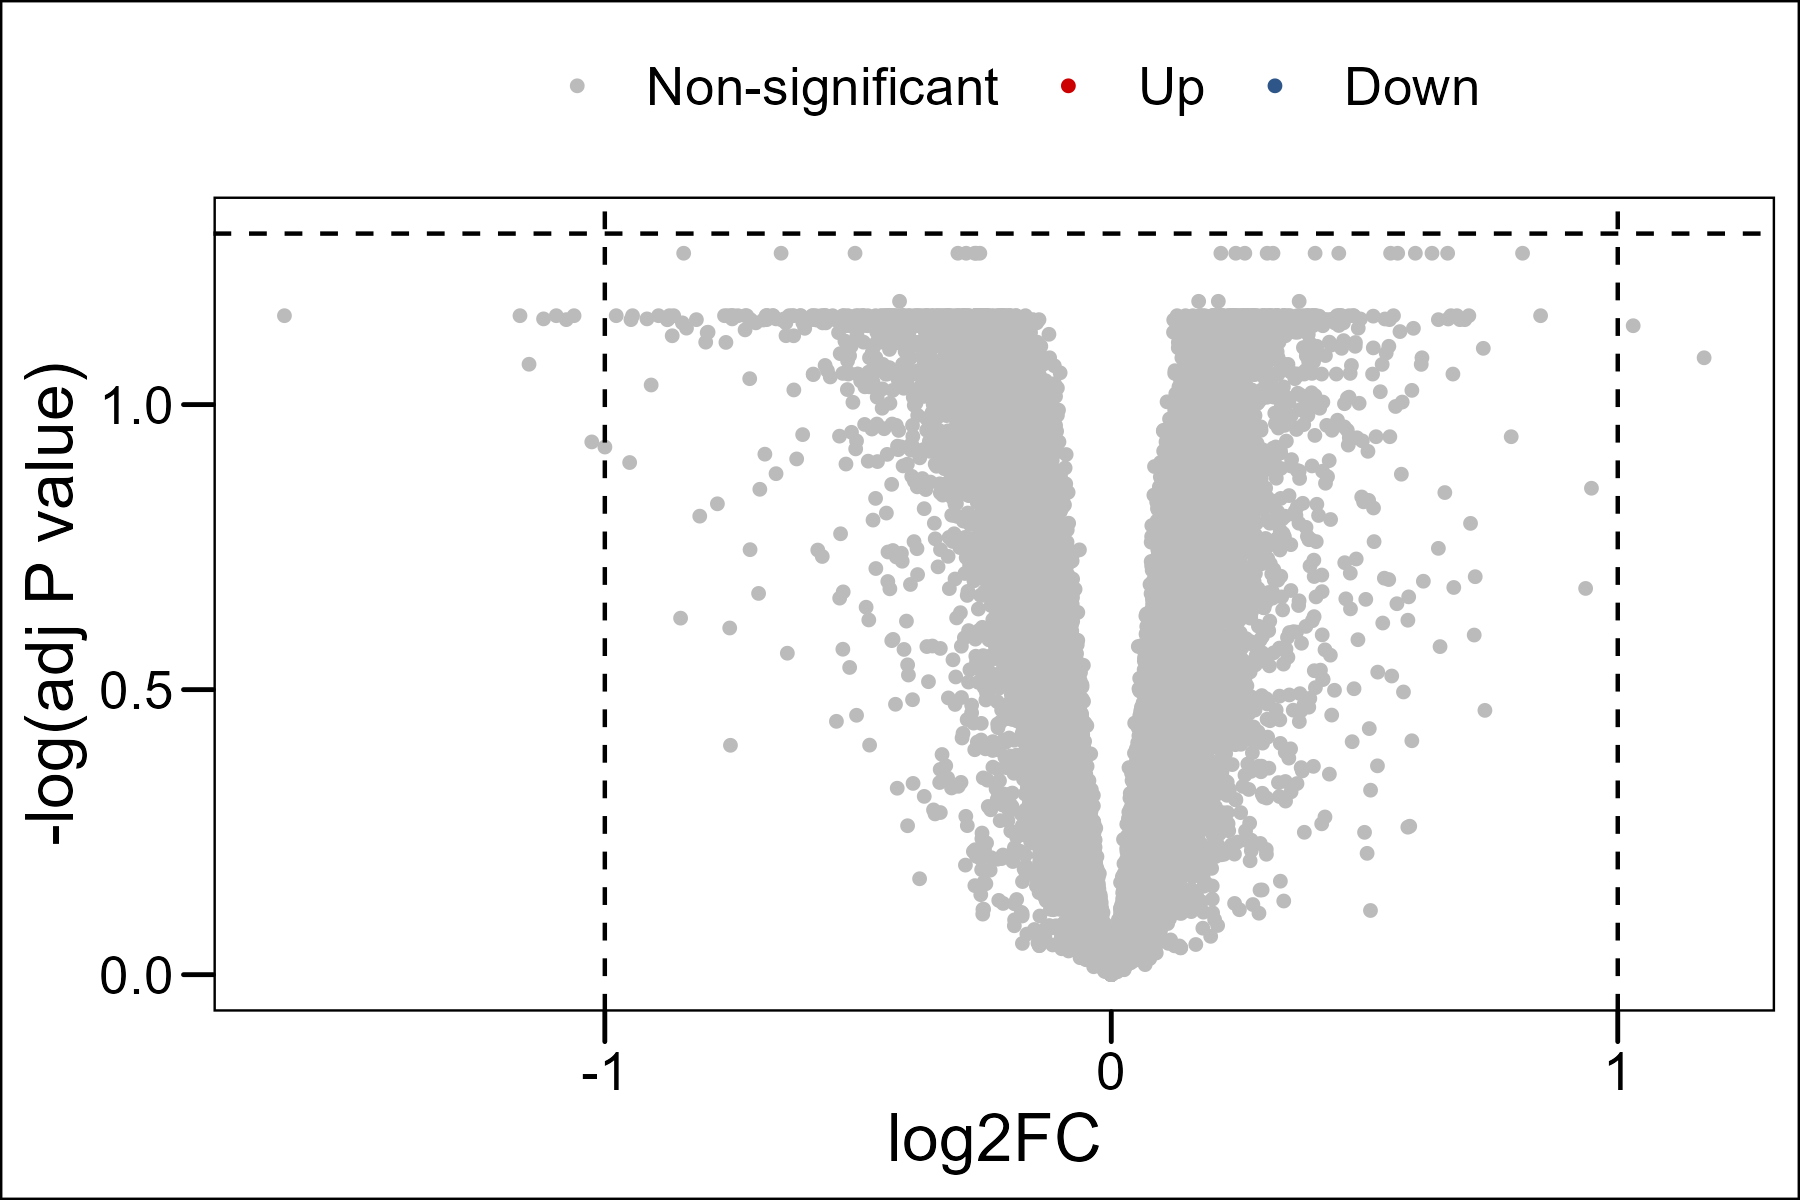
Differential analysis
GO enrichment
Gene expression
F7


| Omics | Disease | Tissue/cell type | Method | Number of samples | CVD Atlas ID | GEO link |
|---|---|---|---|---|---|---|
| Transcriptomics | Coronary artery disease | Adipose tissue | Microarray | 36 | CVDS000014 | GSE120774 |
| GEO accession | Run | BioSample | Experiment | Reported condition | Mapped Condition | Tissue |
|---|
| GEO accession | Condition | Tissue |
|---|---|---|
| GSM3415000 | Control | Subcutaneous fat |
| GSM3415001 | Control | Subcutaneous fat |
| GSM3415002 | Control | Subcutaneous fat |
| GSM3415003 | Control | Subcutaneous fat |
| GSM3415004 | Control | Subcutaneous fat |
| GSM3415005 | Control | Subcutaneous fat |
| GSM3415006 | Control | Subcutaneous fat |
| GSM3415007 | Control | Subcutaneous fat |
| GSM3415008 | Control | Subcutaneous fat |
| GSM3415009 | Coronary artery disease | Subcutaneous fat |
| Symbol | log2FC | P value | Adjusted P value | Group1 | Group2 |
|---|---|---|---|---|---|
| hsa-mir-505 | 1.26 | 0.0297 | 0.869 | Coronary artery disease | Control |
| hsa-mir-4484 | 1.15 | 0.0294 | 0.869 | Coronary artery disease | Control |
| hsa-mir-1281 | 1.10 | 0.0793 | 0.927 | Coronary artery disease | Control |
| hsa-mir-193a | 1.05 | 0.0325 | 0.869 | Coronary artery disease | Control |
| hsa-mir-3615 | 0.952 | 0.281 | 0.935 | Coronary artery disease | Control |
| hsa-mir-1228 | 0.947 | 0.0748 | 0.927 | Coronary artery disease | Control |
| hsa-mir-4298 | 0.944 | 0.0404 | 0.927 | Coronary artery disease | Control |
| hsa-mir-1301 | 0.904 | 0.0624 | 0.927 | Coronary artery disease | Control |
| hsa-mir-4530 | 0.881 | 0.0127 | 0.869 | Coronary artery disease | Control |
| hsa-mir-4668 | 0.881 | 0.164 | 0.927 | Coronary artery disease | Control |
| Ontology | GO ID | GO term | GeneRatio | BgRatio | P value | Adjusted P value | Q value | Gene count | Regulatory trend |
|---|---|---|---|---|---|---|---|---|---|
| No data available in table | |||||||||
| Gene | Condition | Min | Q1 | Median | Q3 | Max |
|---|---|---|---|---|---|---|
| F7 | Control | 6.35 | 6.55 | 6.68 | 6.8 | 6.98 |
| F7 | Coronary artery disease | 6.34 | 6.52 | 6.61 | 6.73 | 6.88 |
| Module | Trait | Correlation | P value |
|---|
| Node 1 | Node 2 | Weight | Detail |
|---|
| CVD Atlas ID | CVDS000564 |
| Data type | GWAS summary statistics |
| Disease/trait | |
| Title | |
| PubMed ID | |
| GWAS Catalog link | Link |
| Study | Number of cases | Number of controls | Total | Ancestry |
|---|
| SNP | Effect allele | Other allele | Beta | Standard error | P value | Odds ratio |
|---|
| Gene | Tissue | #SNPs | PP.H4.abf | PP4/PP3 | Coloc SNP | GWAS risk SNP | PP.H0.abf | PP.H1.abf | PP.H2.abf | PP.H3.abf |
|---|
| CVD Atlas ID | Omics | Reported disease | Mapped disease | Tissue | Number of samples | Data source |
|---|
| Metabolite | Reported disease | Mapped disease | VIP | Super class | Main class | Sub class | Formula | Exact mass | PubChem ID | Dataset |
|---|
| CVD Atlas ID | Omics | Reported disease | Mapped disease | Tissue | Number of samples | Data source |
|---|
| UniProt ID | Average log2FC | P value |
|---|
| CVD Atlas ID | Disease | Omics | Tissue/cell type | Method | Number of samples | GEO link |
|---|
| GEO accession | Reported condition | Mapped condition | Tissue |
|---|

| ID | Gene | Delta beta | P value | Adjusted P value |
|---|