File:Figure 3.png
No higher resolution available.
Figure_3.png (198 × 363 pixels, file size: 147 KB, MIME type: image/png)
Grain Number per Panicle and Yield per Plant Comparison
File history
Click on a date/time to view the file as it appeared at that time.
| Date/Time | Thumbnail | Dimensions | User | Comment | |
|---|---|---|---|---|---|
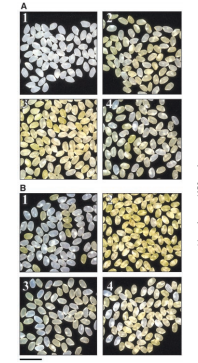
| current | 03:16, 30 May 2014 | | 198 × 363 (147 KB) | WangT (talk | contribs) | Phenotypes of transgenic rice seeds. Bar, 1cm. (A) Panel 1, untransformed control; panels 2 through 4, pB19hpc single transformants lines h11a (panel 2), h15b (panel 3), h6 (panel 4). (B) pZPsC/pZLcyH co-transformants lines z5 (panel1), z11b (panel 2), z4 |
| 10:26, 23 May 2014 |  | 335 × 452 (112 KB) | Xiaopeiwu0509 (talk | contribs) | Grain Number per Panicle and Yield per Plant Comparison |
- You cannot overwrite this file.
File usage
The following 2 pages link to this file: