IC4R013-RNA-Seq-2012-22537016
From RiceWiki
Project Title
- Comparative transcriptome analysis of transporters, phytohormone and lipid metabolism pathways in response to arsenic stress in rice (Oryza sativa)
The Background of This Project
- Arsenic (As) contamination of rice (Oryza sativa) is a worldwide concern and elucidating the molecular mechanisms of As accumulation in rice may provide promising solutions to the problem. Previous studies using microarray techniques to investigate transcriptional regulation of plant responses to As stress have identified numerous differentially expressed genes. However, little is known about the metabolic and regulatory network remodelings, or their interactions with microRNA (miRNA) in plants upon As(III) exposure. In this project, the researchers used Illumina sequencing to acquire global transcriptome alterations and miRNA regulation in rice under As(III) treatments of varying lengths of time and dosages.
Plant Culture & Treatment
- The rice cultivar Nipponbare (Oryza sativa L. ssp japonica) was used in this study because this cv genome has been well sequenced. Seeds were sterilized in 30% H2O2 and germinated for 3 d at 37℃. Seedlings were grown inhalf-strength Hoagland nutrient solution at 28℃ day ⁄ 25℃ night with a photoperiod of 16 h light (09:00–00:59 h) and 8 h night (01:00–08:59 h) in the glasshouse. Our pre-experiments had shown that the growth of rice seedlings was strongly inhibited by 100 lM sodium arsenite (As(III)) stress when the seedlings were treated with a series of As(III) concentrations from 10 to 100 lM. Therefore, for the As(III) treatments, 14-d-old rice seedlings were exposed to As(III) (20 and 80 lM) at 09:00 h, and materials were harvested at 0, 6 and 24 h after treatment. For each treatment, pooling of roots or shoots of the three individual plants in a sample was conducted as described previously. The samples were frozen in liquid nitrogen immediately and stored at -80℃ until use.
- Comparisons (Supporting Information, Fig. S1) between the untreated samples (untreated root and shoot were labeled as CKR and CKS, respectively) and As(III) treated samples (LSR and LLR refer to 20 lM As(III)-treated roots for 6 and 24 h, respectively; HSR and HLR refer to 80 lM As(III)-treated roots for 6 and 24 h, respectively; LSS and LLS refer to 20 lM As(III)-treated shoots for 6 and 24 h, respectively; HSS and HLS refer to 80 lM As(III)-treated shoots for 6 and 24 h, respectively) were performed for different time periods and dosages.
Illumina Sequencing
- Total RNA was extracted using TRIzol reagent (Invitrogen, Carlsbad, CA, USA) following the manufacturer’s instructions and was treated with RNase-free DNase I (New England Biolabs, Inc. Ipswich, MA, USA) to remove contaminated genomic DNA. mRNA was isolated from total RNA using Dynabeads oligo(dT) (Invitrogen). First- and second-strand cDNA was generated using Superscript II reverse transcriptase (Invitrogen) and random hexamer primers. Double stranded cDNA was fragmented by nebulization and used for mRNA library construction according to the Illumina paired-end sample preparation protocol, using custom multiplex-indexed Solexa adaptors and sequenced as 75x2 using the Illumina GA Genome Analyzer paired-end pipeline. The original data set was deposited in the NCBI GEO database (access no. GSE36696).
Research Findings
- After comparisons between untreated and As(III)-treated samples, two main groups with four clusters of samples were identified by their transcriptome similarity, indicating that the transcriptomes of different treatments within shoots or roots were clustered together (Fig. 1a). The effect of dosage on the root samples was more significant than that of time, whereas the situation was reversed for the shoots, which was further confirmed by the principal component analysis (PCA) analysis (Fig. 1b).
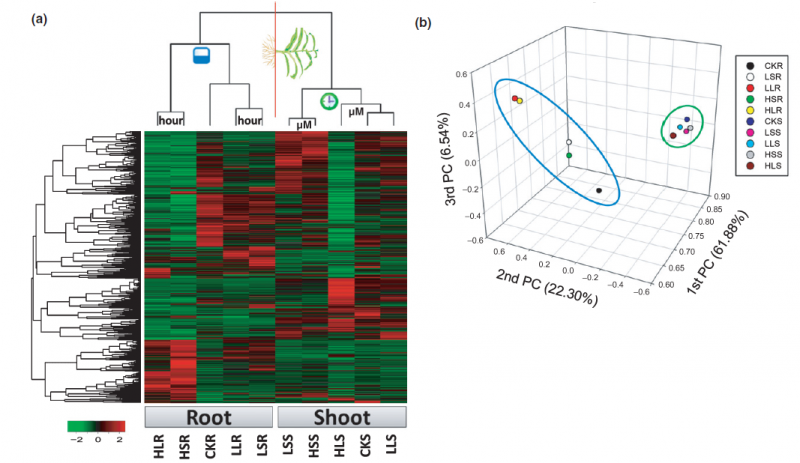
Figure 1. Global patterns of differentially expressed genes (DEGs) under As(III) stress. - To elucidate the molecular mechanisms of As(III) uptake and transportation in rice, the researchers analyzed the expression profiles of rice genes encoding various types of transporter (Fig. 2a). The hierarchical clustering showed that 273 out of 473 transporter genes were regulated upon As(III) treatment in either roots or shoots (Fig. 2b). In general, 106 As(III)-responsive transporter DEGs were deemed to be significantly different after As(III) treatments, including 62 DEGs in the roots, 21 in the shoots and 23 in both roots and shoots (Fig. 2c,d).

Figure 2. Expression profile of transporter genes under As(III) stress. - From the KEGG, the researchers observed that 3628 As(III)-responsive genes could be annotated to 228 pathways. Among them, phytohormone (specifically JA) and lipid metabolism pathways were two of the most significant pathways identified.
- From the sequencing data, the researchers identified 97–146 miRNAs belonging to 41–50 miRNA families as predicted by the miRBase database. The miRNA data were further analyzed to identify As(III)-responsive miRNAs. In general, the expression of 36 miRNAs showed significant alterations in response to As(III) treatments. Twenty-five miRNAs (22 families) were observed in the roots (Fig. 3a), whereas 30 miRNAs (23 families) were observed in the shoots (Fig. 3c). Using the computational prediction and degradome-Seq data, the researchers further computed the expression correlation between the miRNAs and their predicted mRNA targets. Among the 2467 candidate miRNA–mRNA pairs identified, only 237 and 128 pairs in the roots and shoots, respectively, were found to be biologically relevant. In particular, the correlation coefficients of two transporter–miRNA pairs, two lipid–miRNA pairs and three JA–miRNA pairs in the roots (Fig. 3b), and five transporter– miRNA pairs, one lipid–miRNA pair and one JA–miRNA pair in the shoots (Fig. 3d) ranged from -1 to -0.5.

Figure 3. Differential expression of rice microRNAs (miRNAs) and their target mRNAs under As(III) stress. - In the mRNA-seq data, 1477 (60.9%) TF genes were detected and 468 (19.3%) TFs were differentially expressed. Consistent with the whole genome gene expression patterns, HSR and HLS expressed the lowest number of TF genes (1005 and 955), but with the highest super-high expression gene numbers (65 and 44). Of the 468 (42 subfamilies) differentially expressed TFs, 230 (36 subfamilies) were in the roots, 103 (31 subfamilies) were in the shoots and 135 (22 subfamilies) were in both the roots and shoots.Clustering analyses were performed to further explore the relationship between the As(III)-responsive TFs and DEGs. Results showed that the differentially expressed TF genes were grouped into two clusters, and that four groups were well correlated with the same topology of DEGs. Therefore, the dynamics of accumulation of TFs after As(III) stress were particularly well resolved in the mRNA-seq data, and specific subfamilies of TFs were preferentially expressed after As(III) treatment.
Labs working on this Project
- State Key Laboratory of Biocontrol and Guangdong Key Laboratory of Plant Resources, School of Life Sciences, Sun Yat-sen University, Guangzhou 510275, China
- Key Laboratory of Genome Sciences and Information, Beijing Institute of Genomics, Chinese Academy of Sciences, Beijing 100029, China
Corresponding Author
- Wen-sheng Shu: shuws@mail.sysu.edu.cn; & Song-nian Hu: husn@big.ac.cn


