File list
This special page shows all uploaded files.
| Date | Name | Thumbnail | Size | Description | Versions |
|---|---|---|---|---|---|
| 13:45, 10 June 2014 | 图片OS11.png (file) |  |
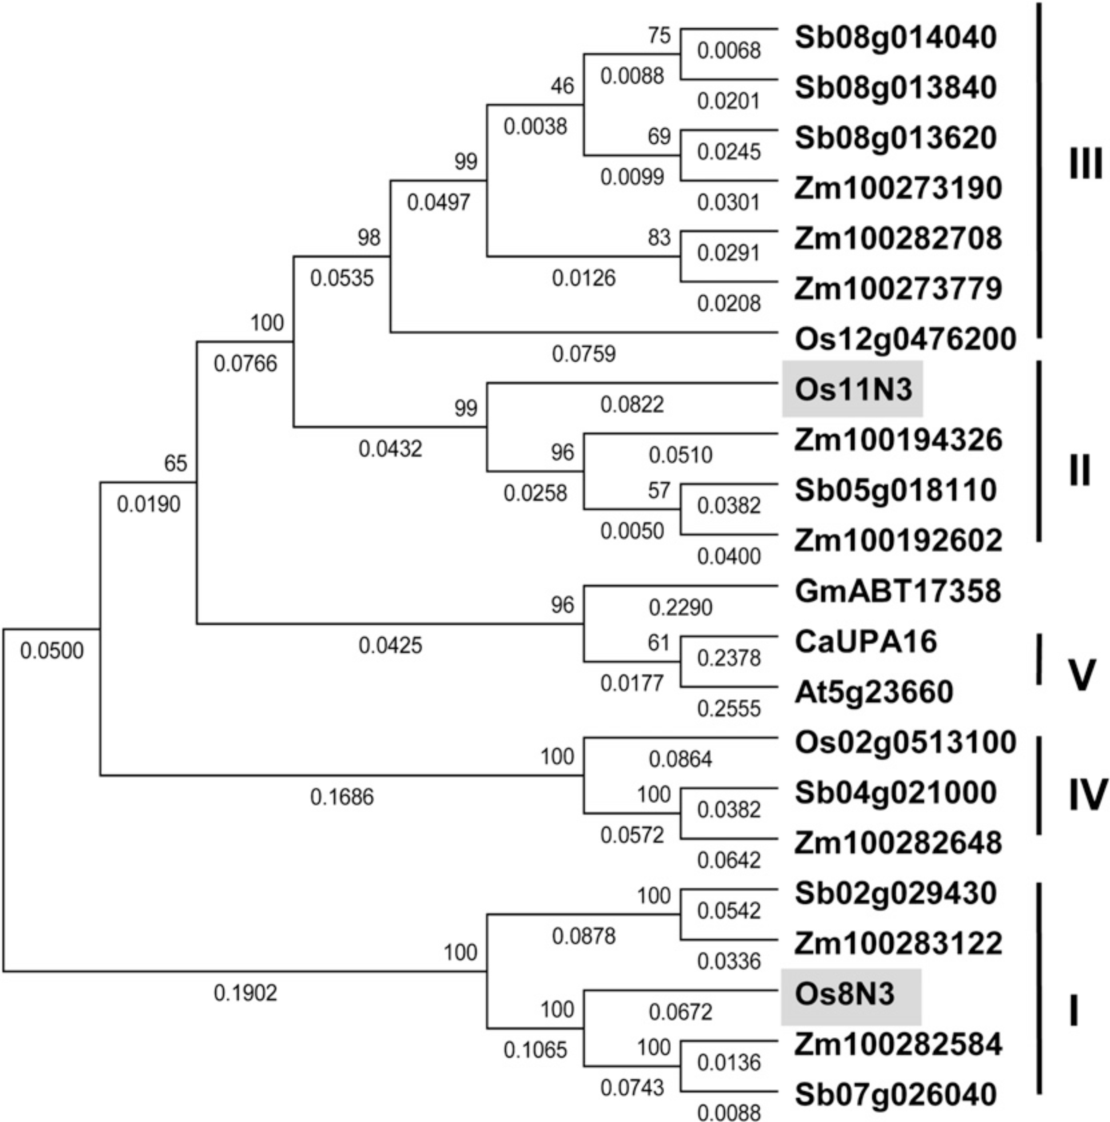
444 KB | Rice Os-11N3 Represents a Distinct Clade of the N3 Family | 1 |
| 13:31, 10 June 2014 | 图片8n3.png (file) |  |
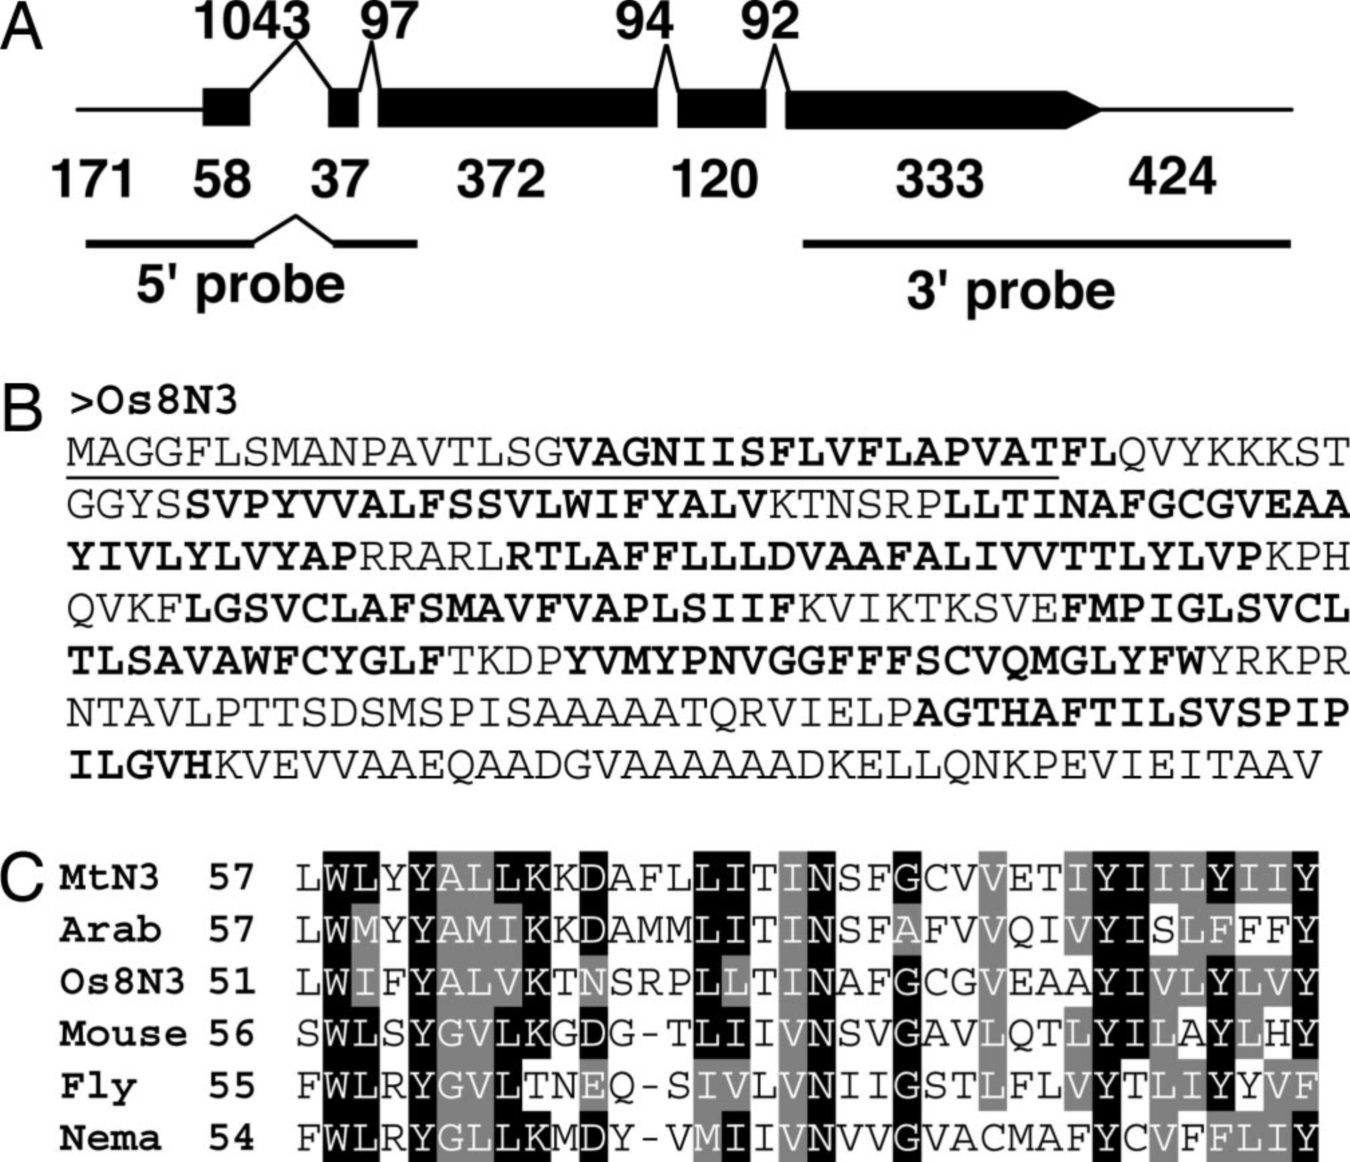
868 KB | Os8N3is amemberof theMtN3family. (A)Os8N3is expressed as a 1.6-kb messenger RNA. Os8N3 is shown as represented by the full-length cDNA AK070510. Exons are represented by the solid black bars, and introns are indicated above the bars. Numbers indicate the | 1 |
| 14:42, 9 June 2014 | 图片14.8.png (file) |  |
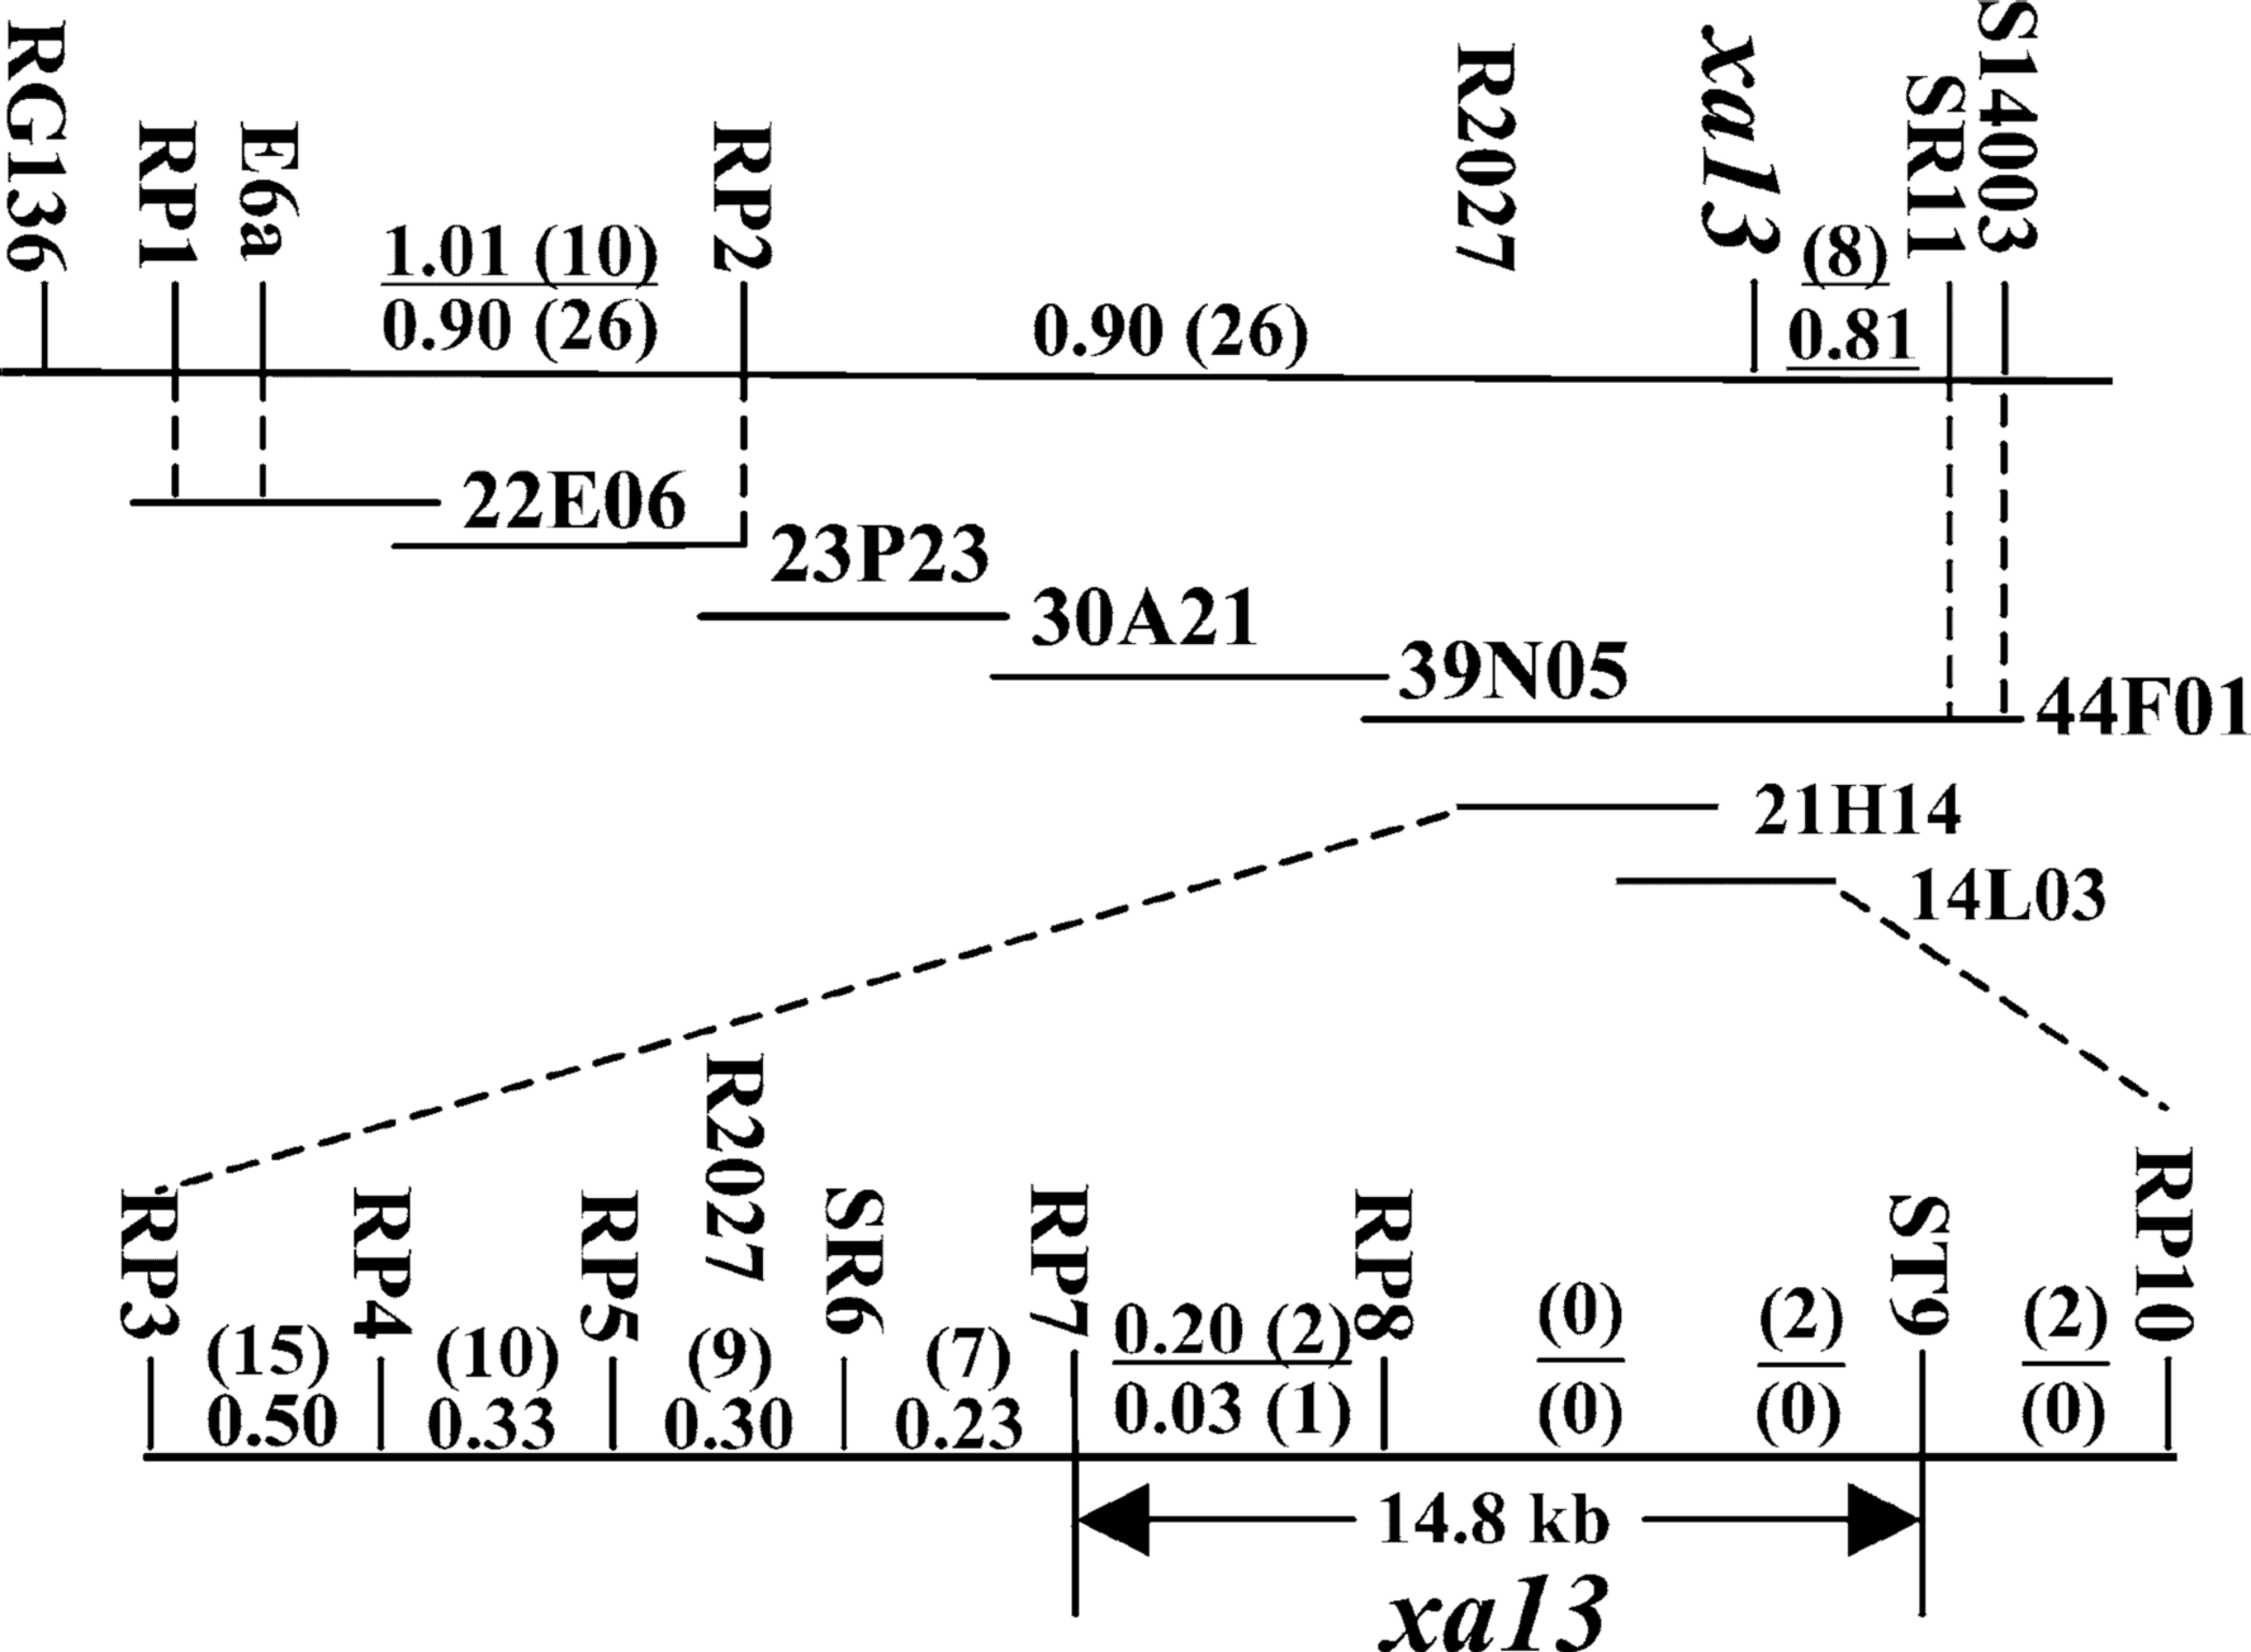
601 KB | A contig map covering the xa13 region. The long horizontal lines indicate the region containing the xa13 locus. | 1 |
| 07:11, 9 June 2014 | 图片gus.png (file) |  |
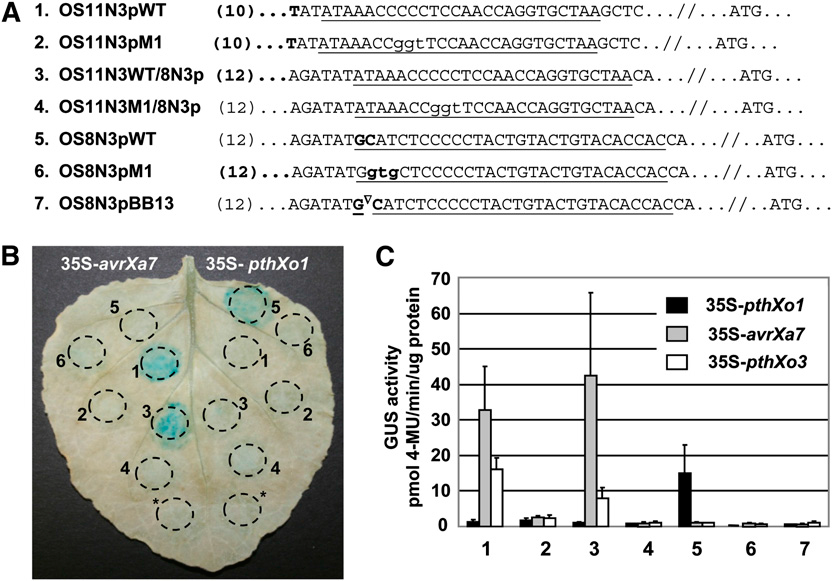
370 KB | AvrXa7 Drives TAL Effector-Specific Host Gene Induction. (A) Promoter fragments used in the transient expression assay. The consensus effector binding elements are underlined. The nonconsensus changes introduced in the mutant versions are in lowercase let | 1 |
| 07:06, 9 June 2014 | 图片deletion.png (file) |  |
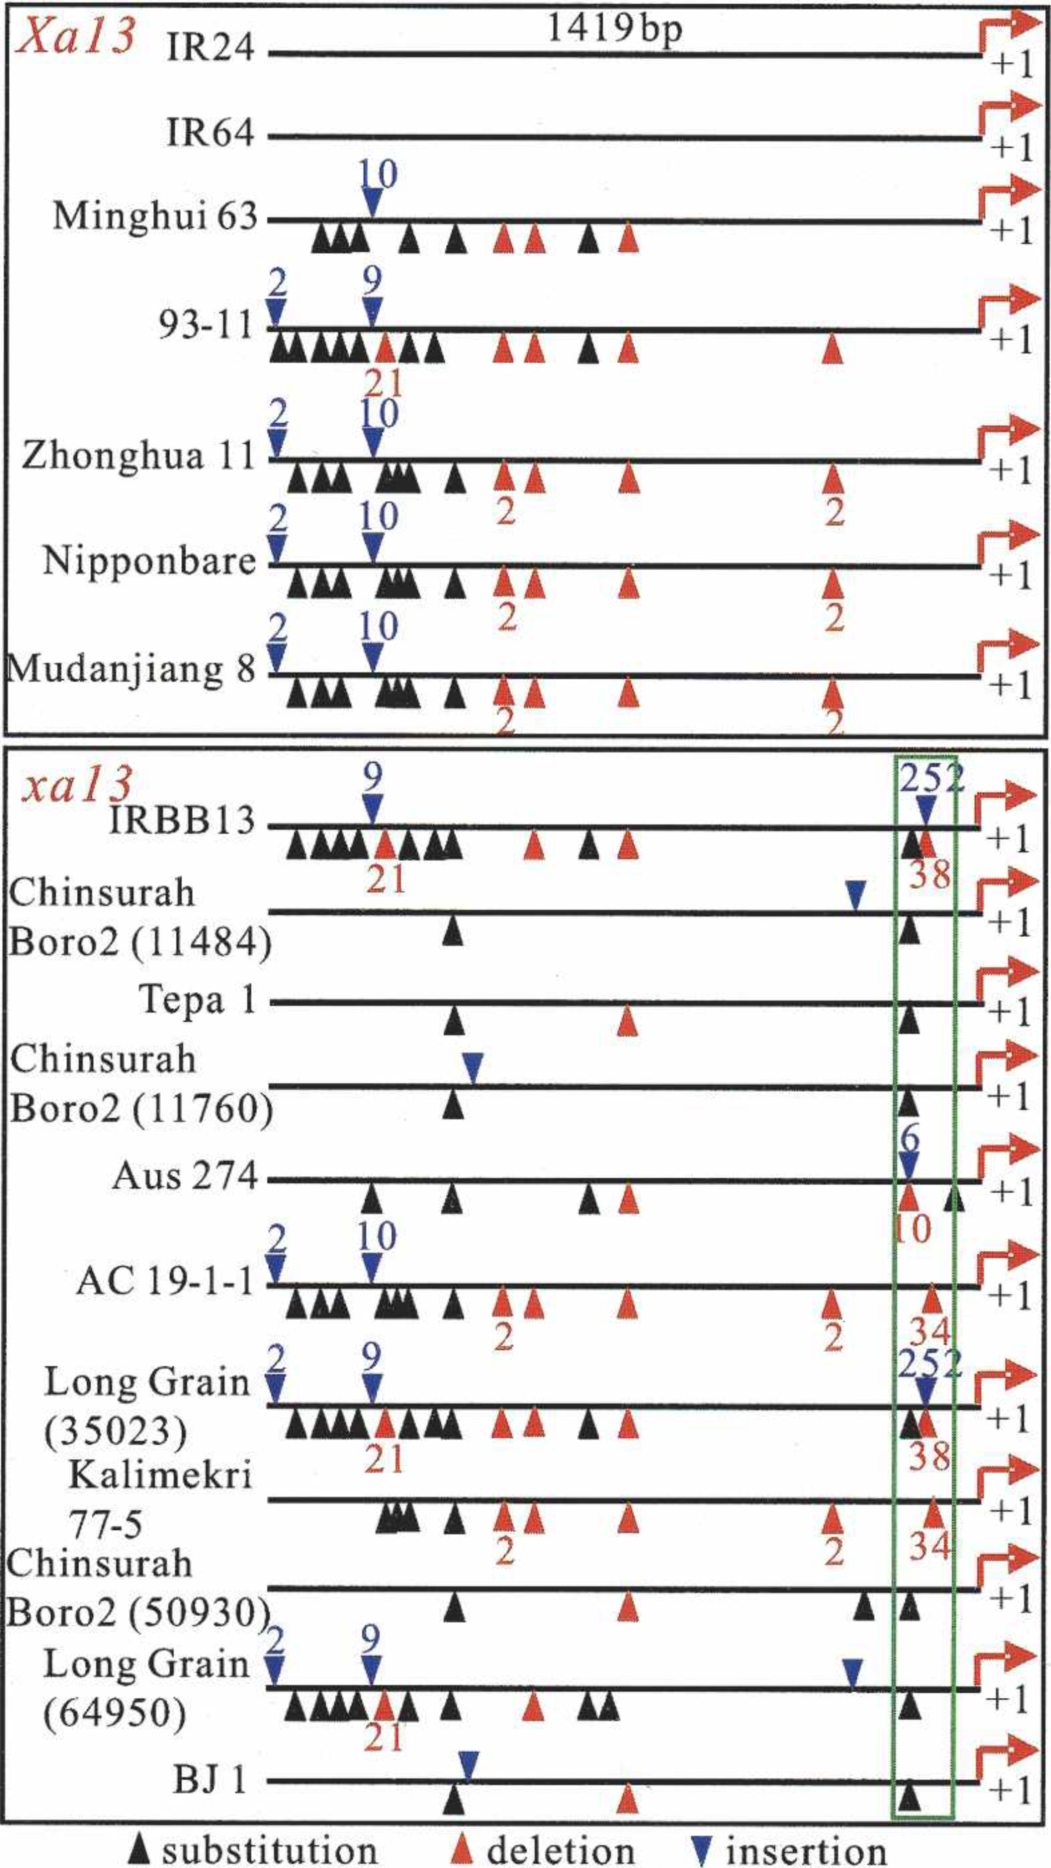
1.11 MB | Sequence comparison of the promoter regions of xa13 and Xa13 from different rice lines. Nucleotide substitution, deletion, or insertion are identified in different rice lines with reference to the sequence of IR24. The triangles with a figure indicate the | 1 |
| 07:00, 9 June 2014 | 图片rice.png (file) |  |
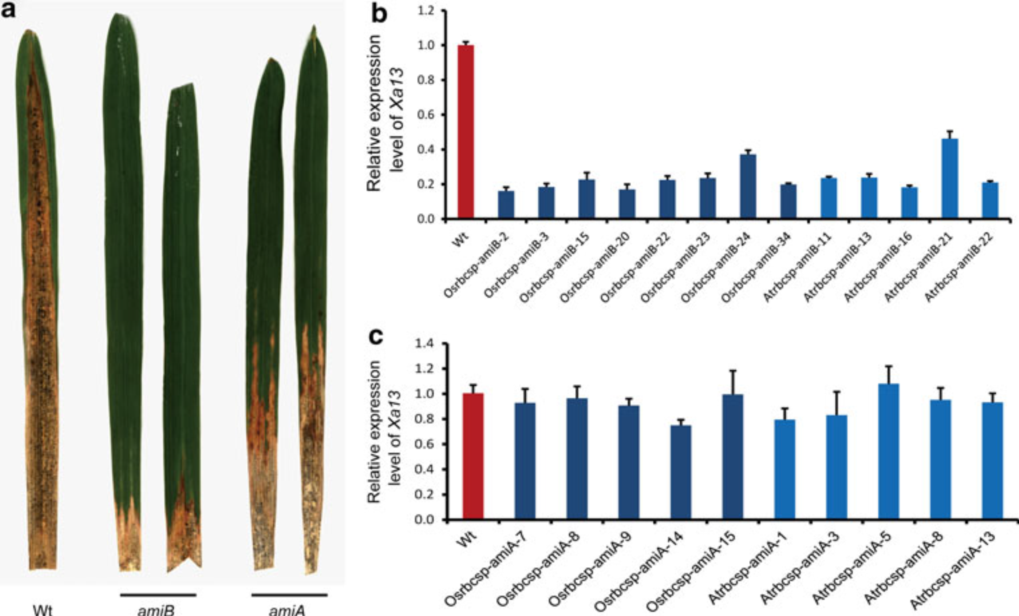
361 KB | Leaf lesions and expression of Xa13 in the leaves of selected transgenic lines. a Lesion length of wild type and transgenic plants 14 days after inoculation. The resistance of transgenic plants expressing amiB is much higher than those expressing amiA. | 1 |
| 04:06, 9 June 2014 | 图片pollen.png (file) |  |
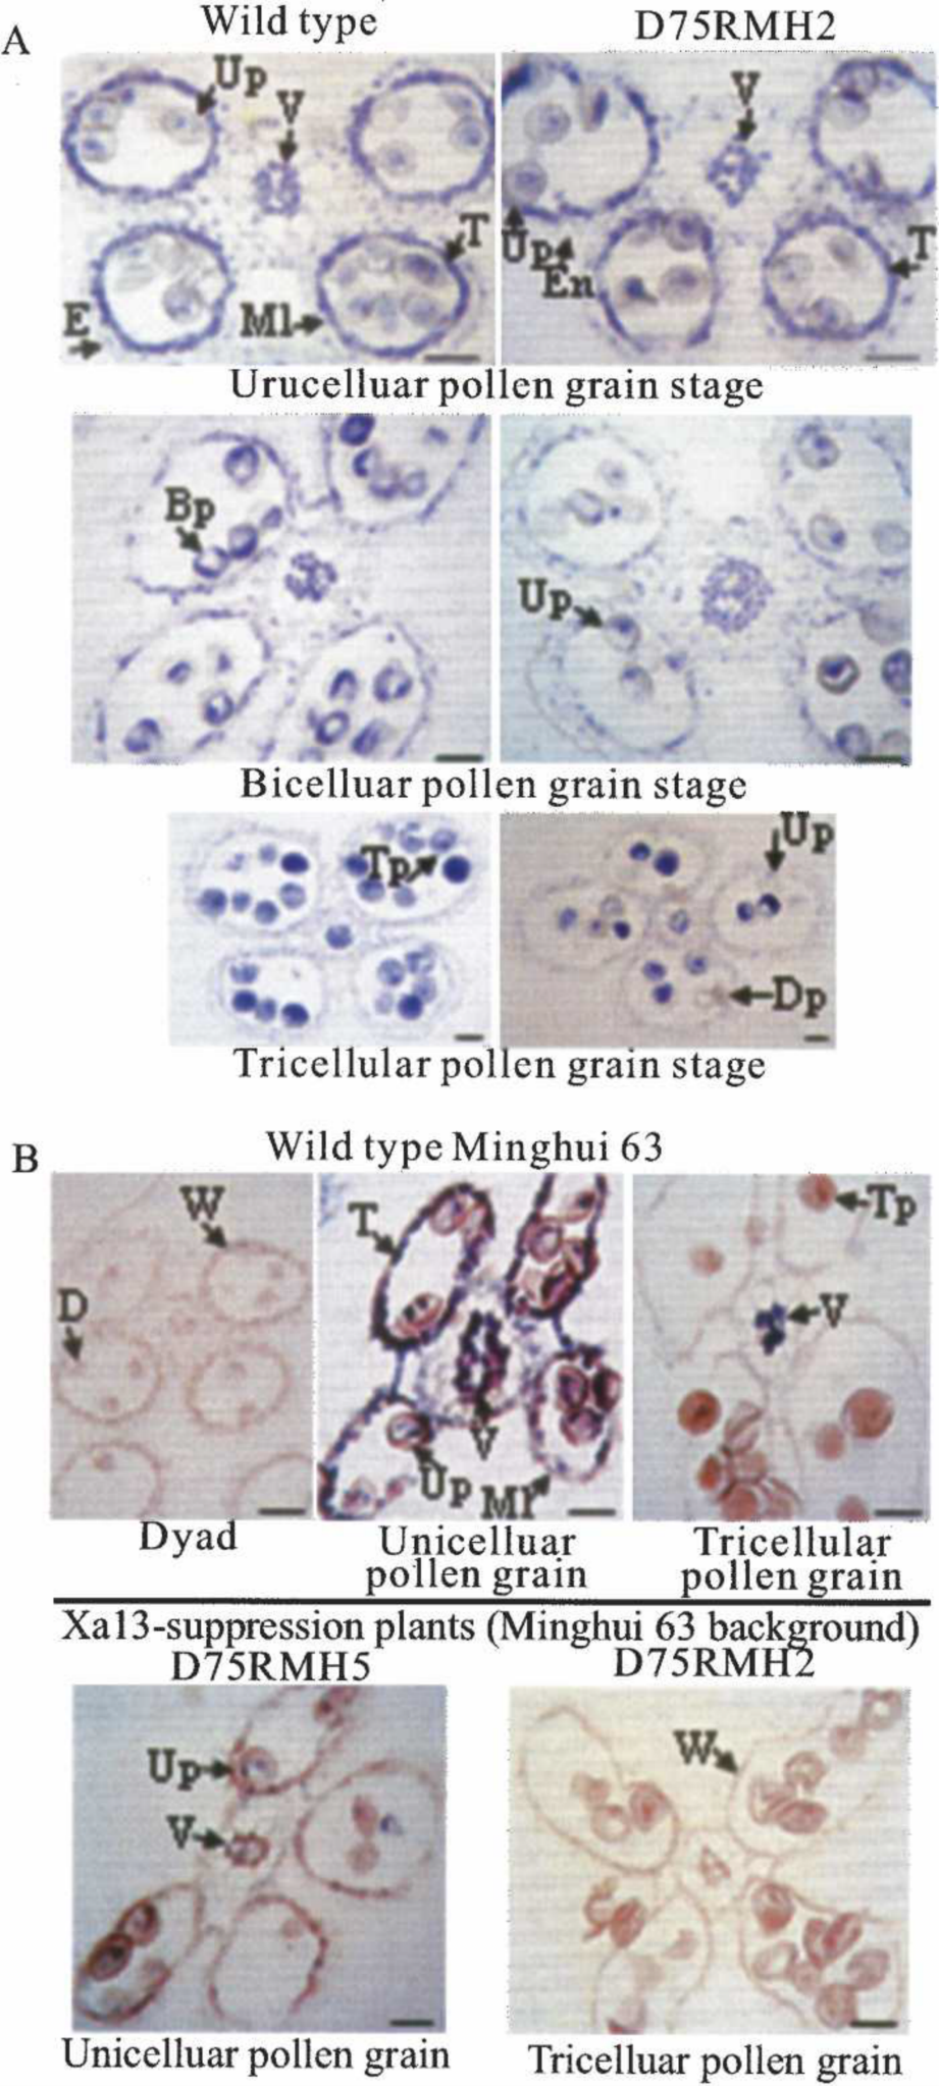
1.77 MB | Association of Xa13 expression and pollen development.Bars, 30 μm. (Bp) Bicellular pollen grain; (D) dyad; (Dp) degenerated pollen grain; (E) epidermis; (En) endothecium; (Ml) middle layer; (Up) unicellular pollen grain; (T) tapetum; (Tp) tricellular pol | 1 |
| 04:03, 9 June 2014 | 图片cop.png (file) |  |
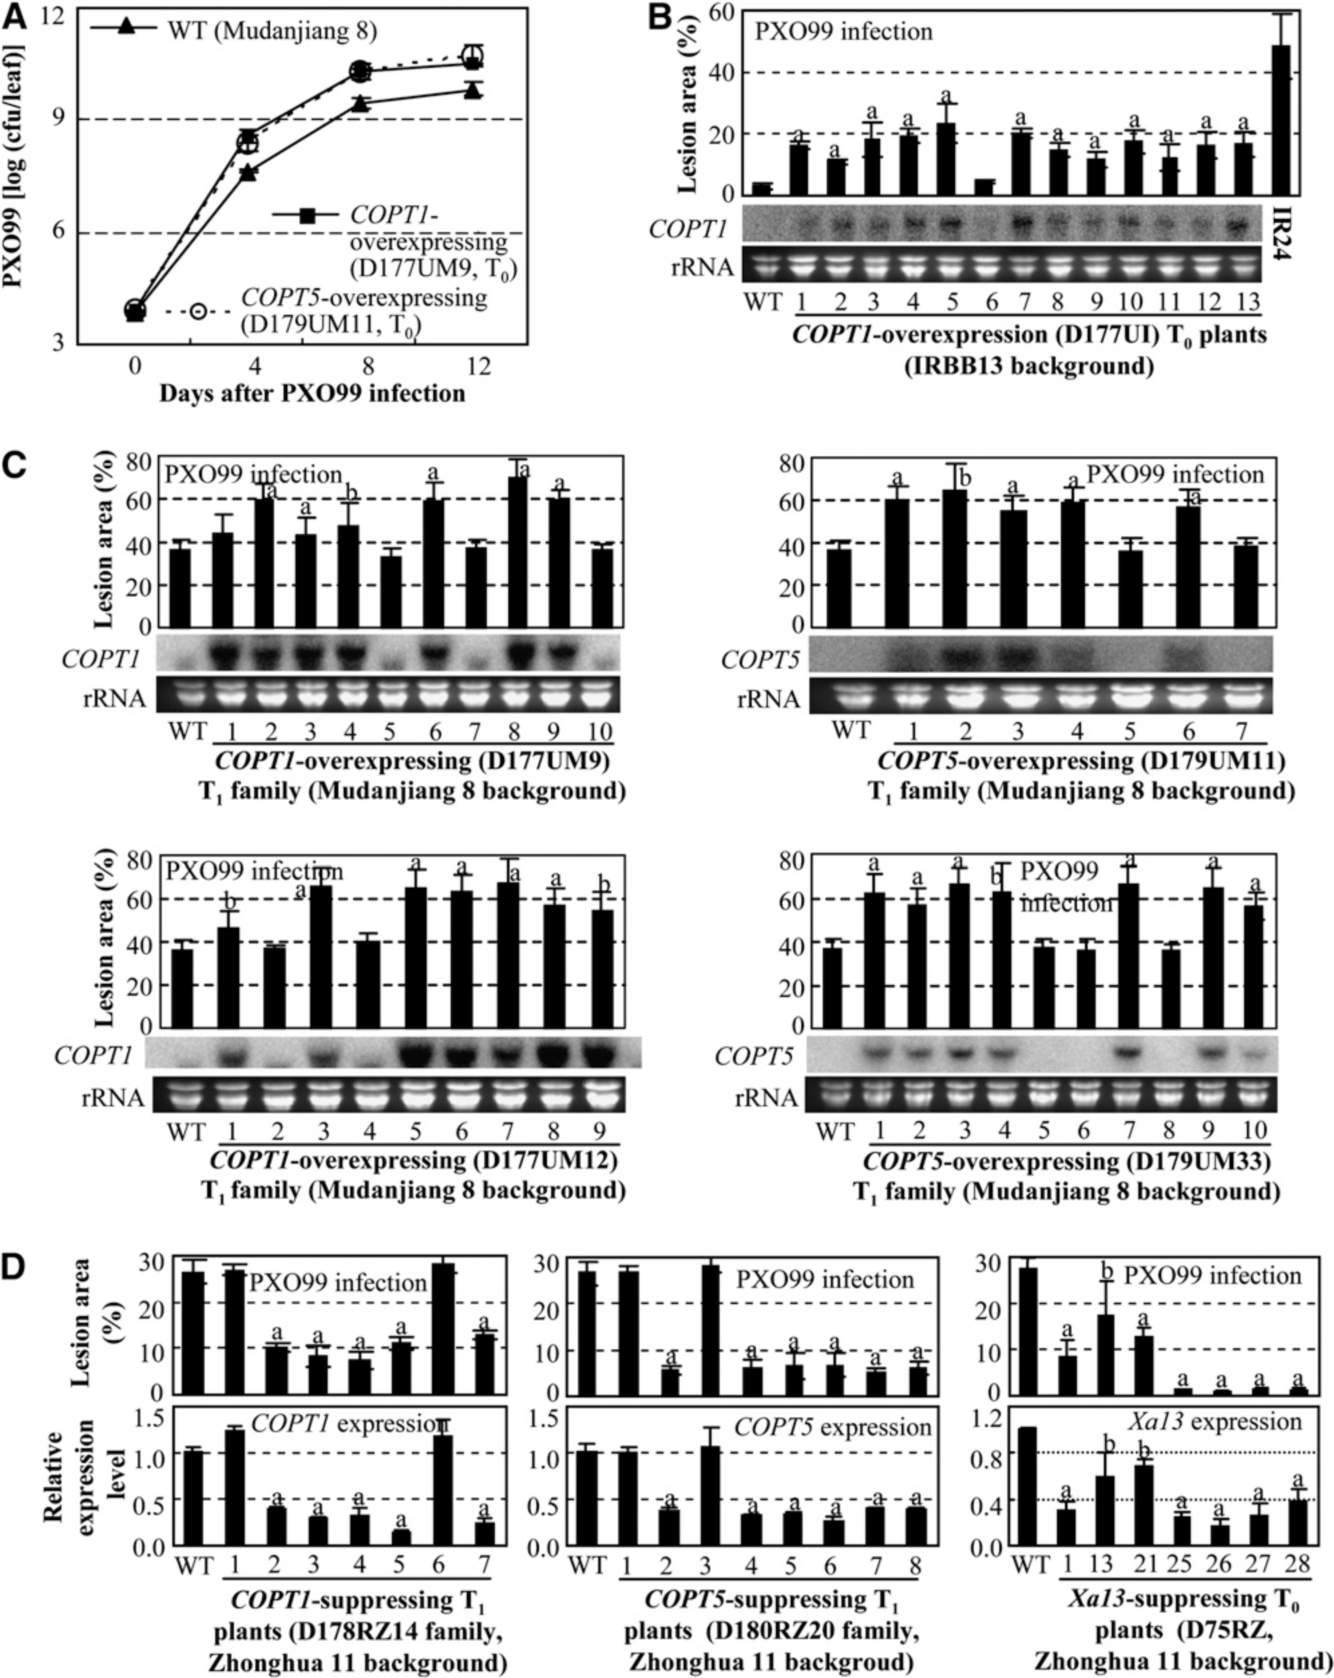
1.08 MB | Modulating COPT1, COPT5, or Xa13 Expression Influenced Rice Responses to Xoo Infection. Each data point representsmean (five replicates for lesion and three replicates for others) 6 SD. Gene expression was analyzed by RNA gel blot analysis ([B] and [C]) | 1 |
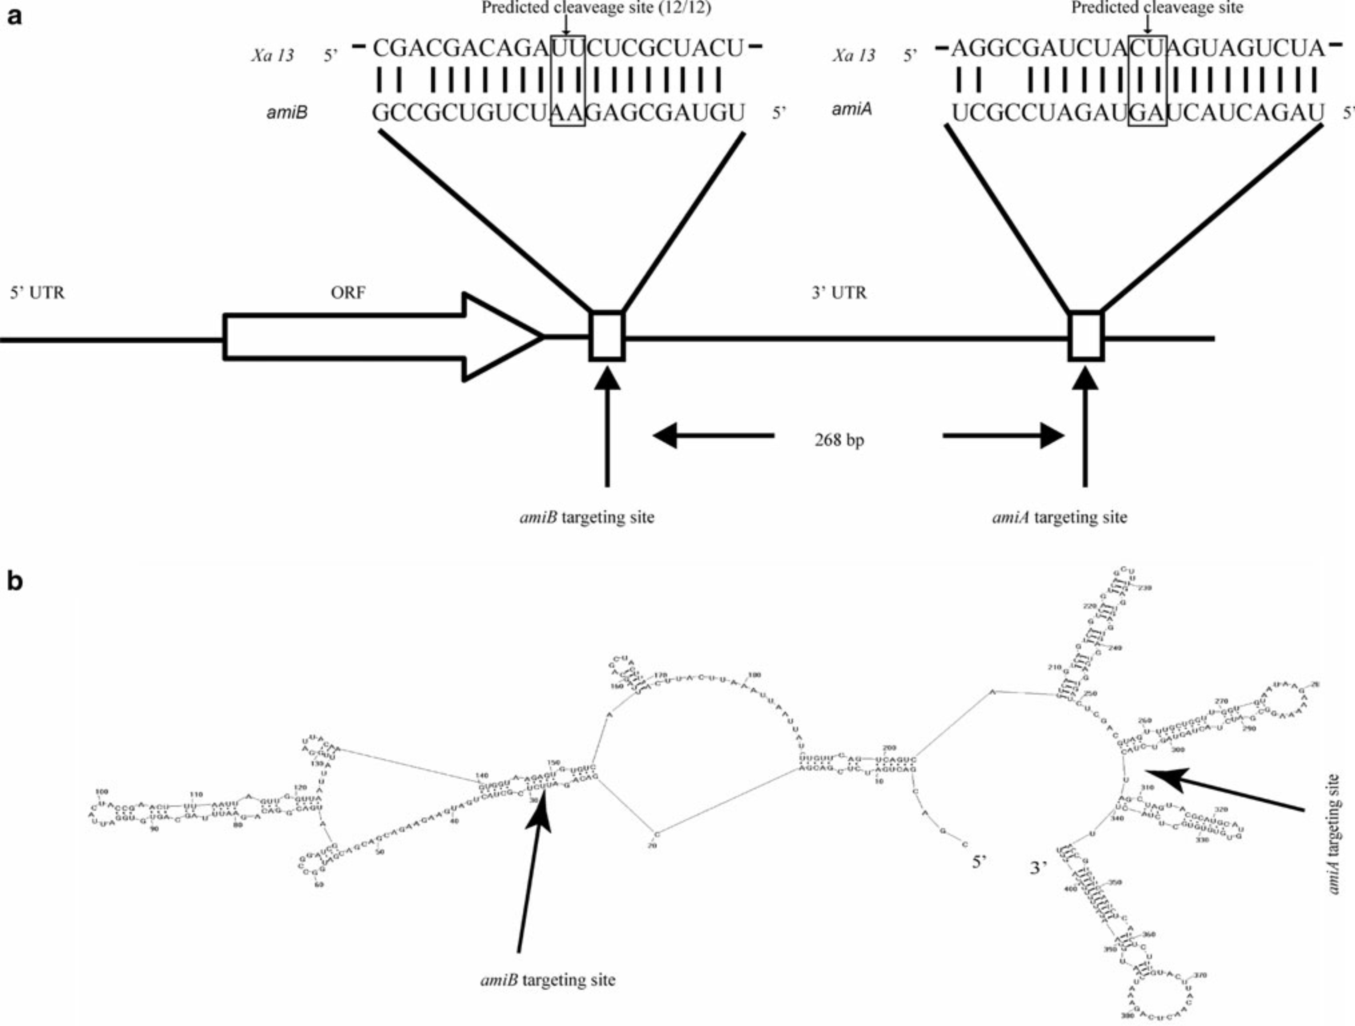
| 03:25, 9 June 2014 | Xa13 mRNA.png (file) |  |
324 KB | Target sites of amiA and amiB and predicted secondary structure of 30-UTR of Xa13 mRNA. a Target sites of amiA and amiB.12/12 means 12 cleavages from a total of 12 sequenced clones occurred at the predicted amiRNA targeting site between base pairs10 and | 1 |