File list
This special page shows all uploaded files.
| Date | Name | Thumbnail | Size | Description | Versions |
|---|---|---|---|---|---|
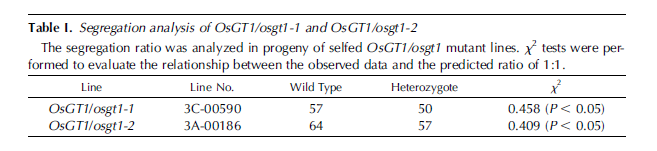
| 05:16, 4 June 2014 | Table2.png (file) |  |
23 KB | 1 | |
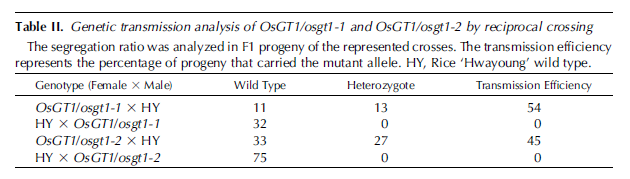
| 05:16, 4 June 2014 | Table1.png (file) |  |
24 KB | 2 | |
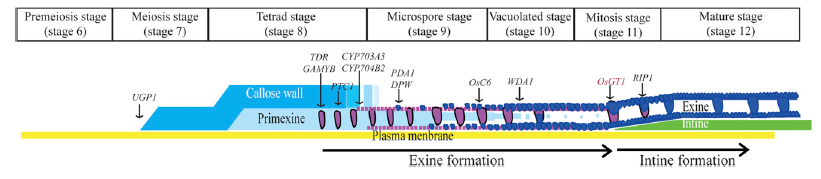
| 05:15, 4 June 2014 | Image8.png (file) |  |
81 KB | Figure 8. Schematic diagram of rice pollen wall development based on stages described by Li et al. (2010). Genes involved in this process are represented. Arrows indicate times when mutant phenotypes become visible. | 1 |
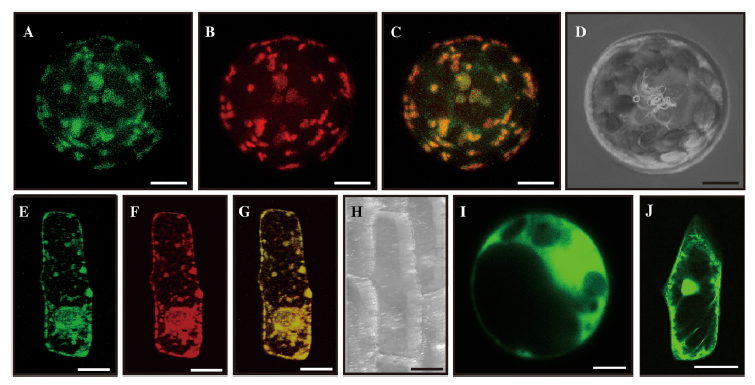
| 05:14, 4 June 2014 | Image7.png (file) |  |
302 KB | Figure 7. Subcellular localization. A to D, Mesophyll protoplasts prepared from young seedlings were cotransformed with fusion constructs Pubi::OsGT1-GFP and P35S::ManI-RFP. Images observed under GFP channel (A) and RFP channel (B) were merged (C); D is a | 1 |
| 05:13, 4 June 2014 | Image6.png (file) |  |
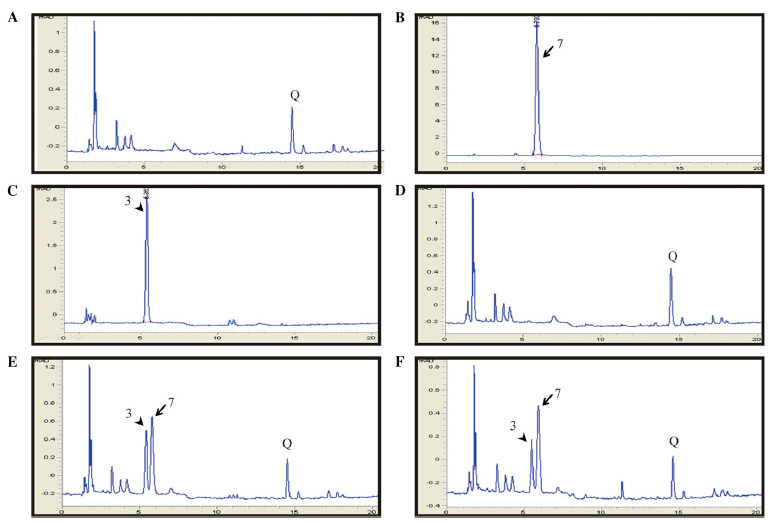
108 KB | Figure 6. Glycosyltransferase assay. A to C, Quercetin (A) and its glucosides, quercetin-3-O-glucoside (B) and quercetin-7-Oglucoside (C), were separated by HPLC. D and E, Chromatograms of assay products using GST protein as a negative control (D) and AtG | 1 |
| 05:12, 4 June 2014 | Image5.png (file) |  |
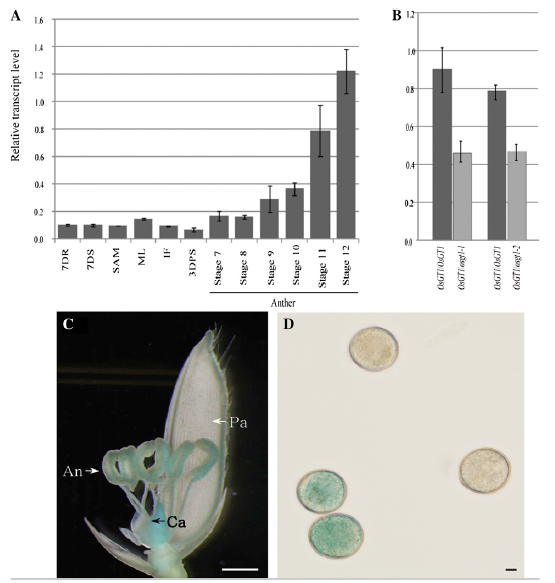
166 KB | Figure 5. Expression pattern of OsGT1. A, Quantitative RT-PCR analyses in various organs. Transcript levels were normalized to UBIQUITIN and calculated by the comparative cycle threshold method. Error bars indicate SD. 7DR, Seven-day-old seedling roots; 7 | 1 |
| 05:11, 4 June 2014 | Image4.png (file) |  |
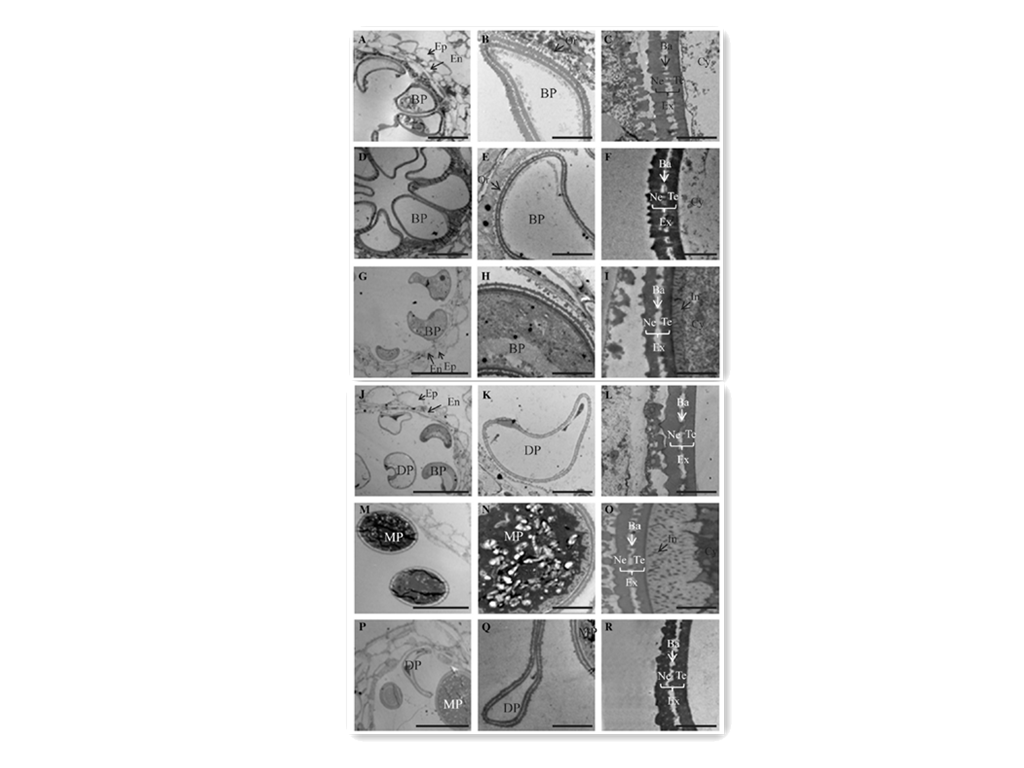
355 KB | Figure 4. TEM analyses of developing anthers from wild-type (A–C, G–I, and M–O) and OsGT1/osgt1-1 (D–F, J–L, and P–R) plants at stage 11a (A–F), stage 11b (G–L), and stage 12 (M–R). Ba, Bacula; BP, binuclear pollen; Cy, cytosol; DP, defe | 1 |
| 05:10, 4 June 2014 | Image3-.png (file) |  |
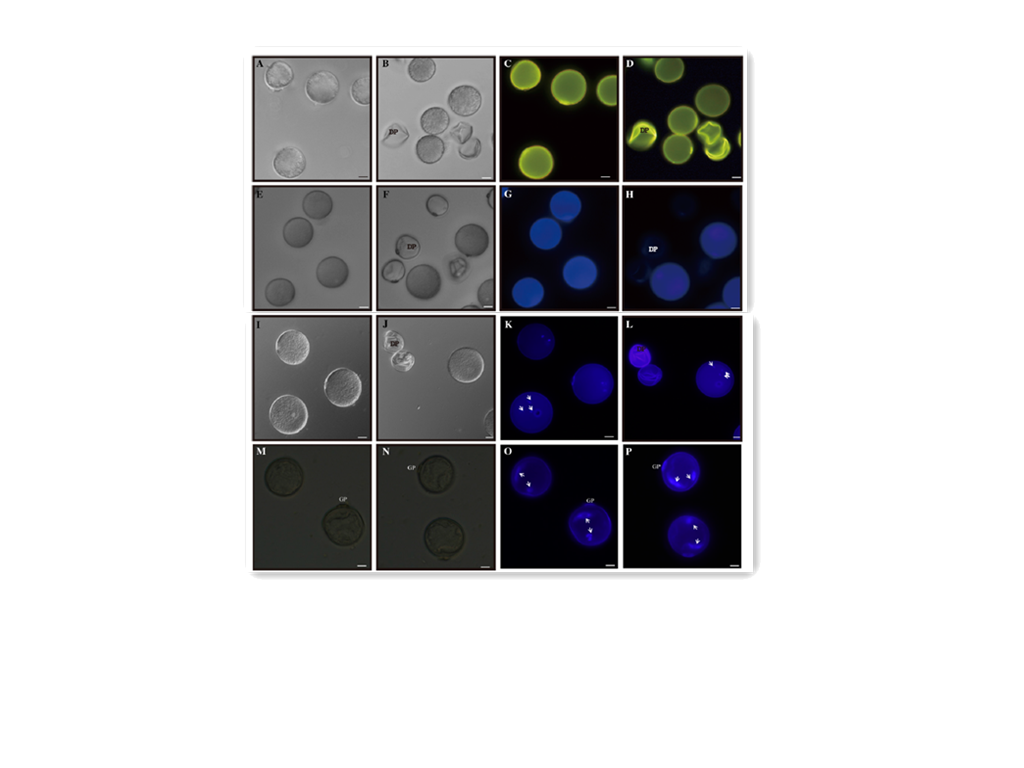
343 KB | Figure 3. Phenotypes of pollen grains. A to D, Auramine O staining of grains from segregating wild-type (A and C) and OsGT1/ osgt1-1 (B and D) plants at stage 12 observed under bright-field (A and B) and fluorescence (C and D) microscopy. E to H, Calcoflu | 1 |
| 05:02, 4 June 2014 | Image2.png (file) |  |
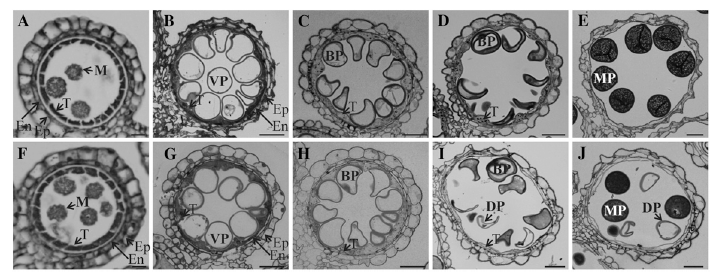
238 KB | Figure 2. Light microscopy observation of anthers at different developmental stages. Cross sections are shown from segregating wild type (A–E) and OsGT1/osgt1-1 (F–J) at early microspore stage (A and F), vacuolated stage (B and G), mitotic division st | 1 |
| 04:43, 4 June 2014 | Rice1.png (file) |  |
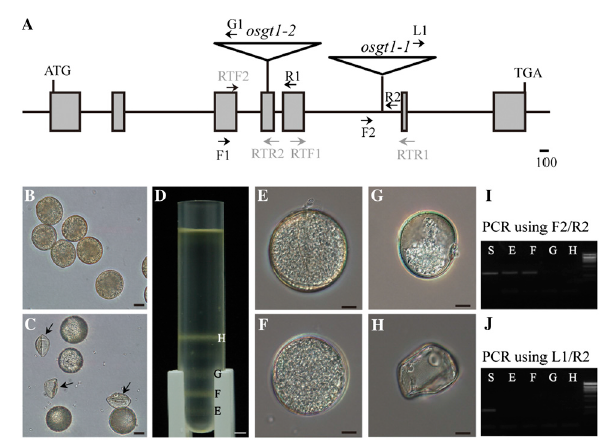
208 KB | Figure 1. Schematic diagrams of OsGT1 and aberrant pollen phenotype in osgt1 mutant. A, T-DNA insertion positions. Start and stop codons are represented as ATG and TGA, respectively; positions of insertion are shown with triangles. Shaded boxes indicate e | 1 |