File list
This special page shows all uploaded files.
| Date | Name | Thumbnail | Size | Description | Versions |
|---|---|---|---|---|---|
| 09:37, 31 May 2014 | Figure S2.jpg (file) |  |
2.71 MB | Black boxes indicate identical amino acids, and gray boxes indicate similar amino acids. | 1 |
| 09:26, 31 May 2014 | FigureS5.jpg (file) |  |
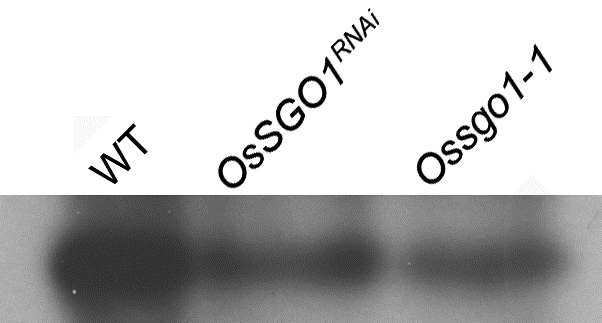
68 KB | Lane 1, young panicles of wild type; Lane 2, young panicles of OsSGO1RNAi; Lane 3, young panicles of Ossgo1-1. | 1 |
| 02:53, 31 May 2014 | FigureS4.jpg (file) |  |
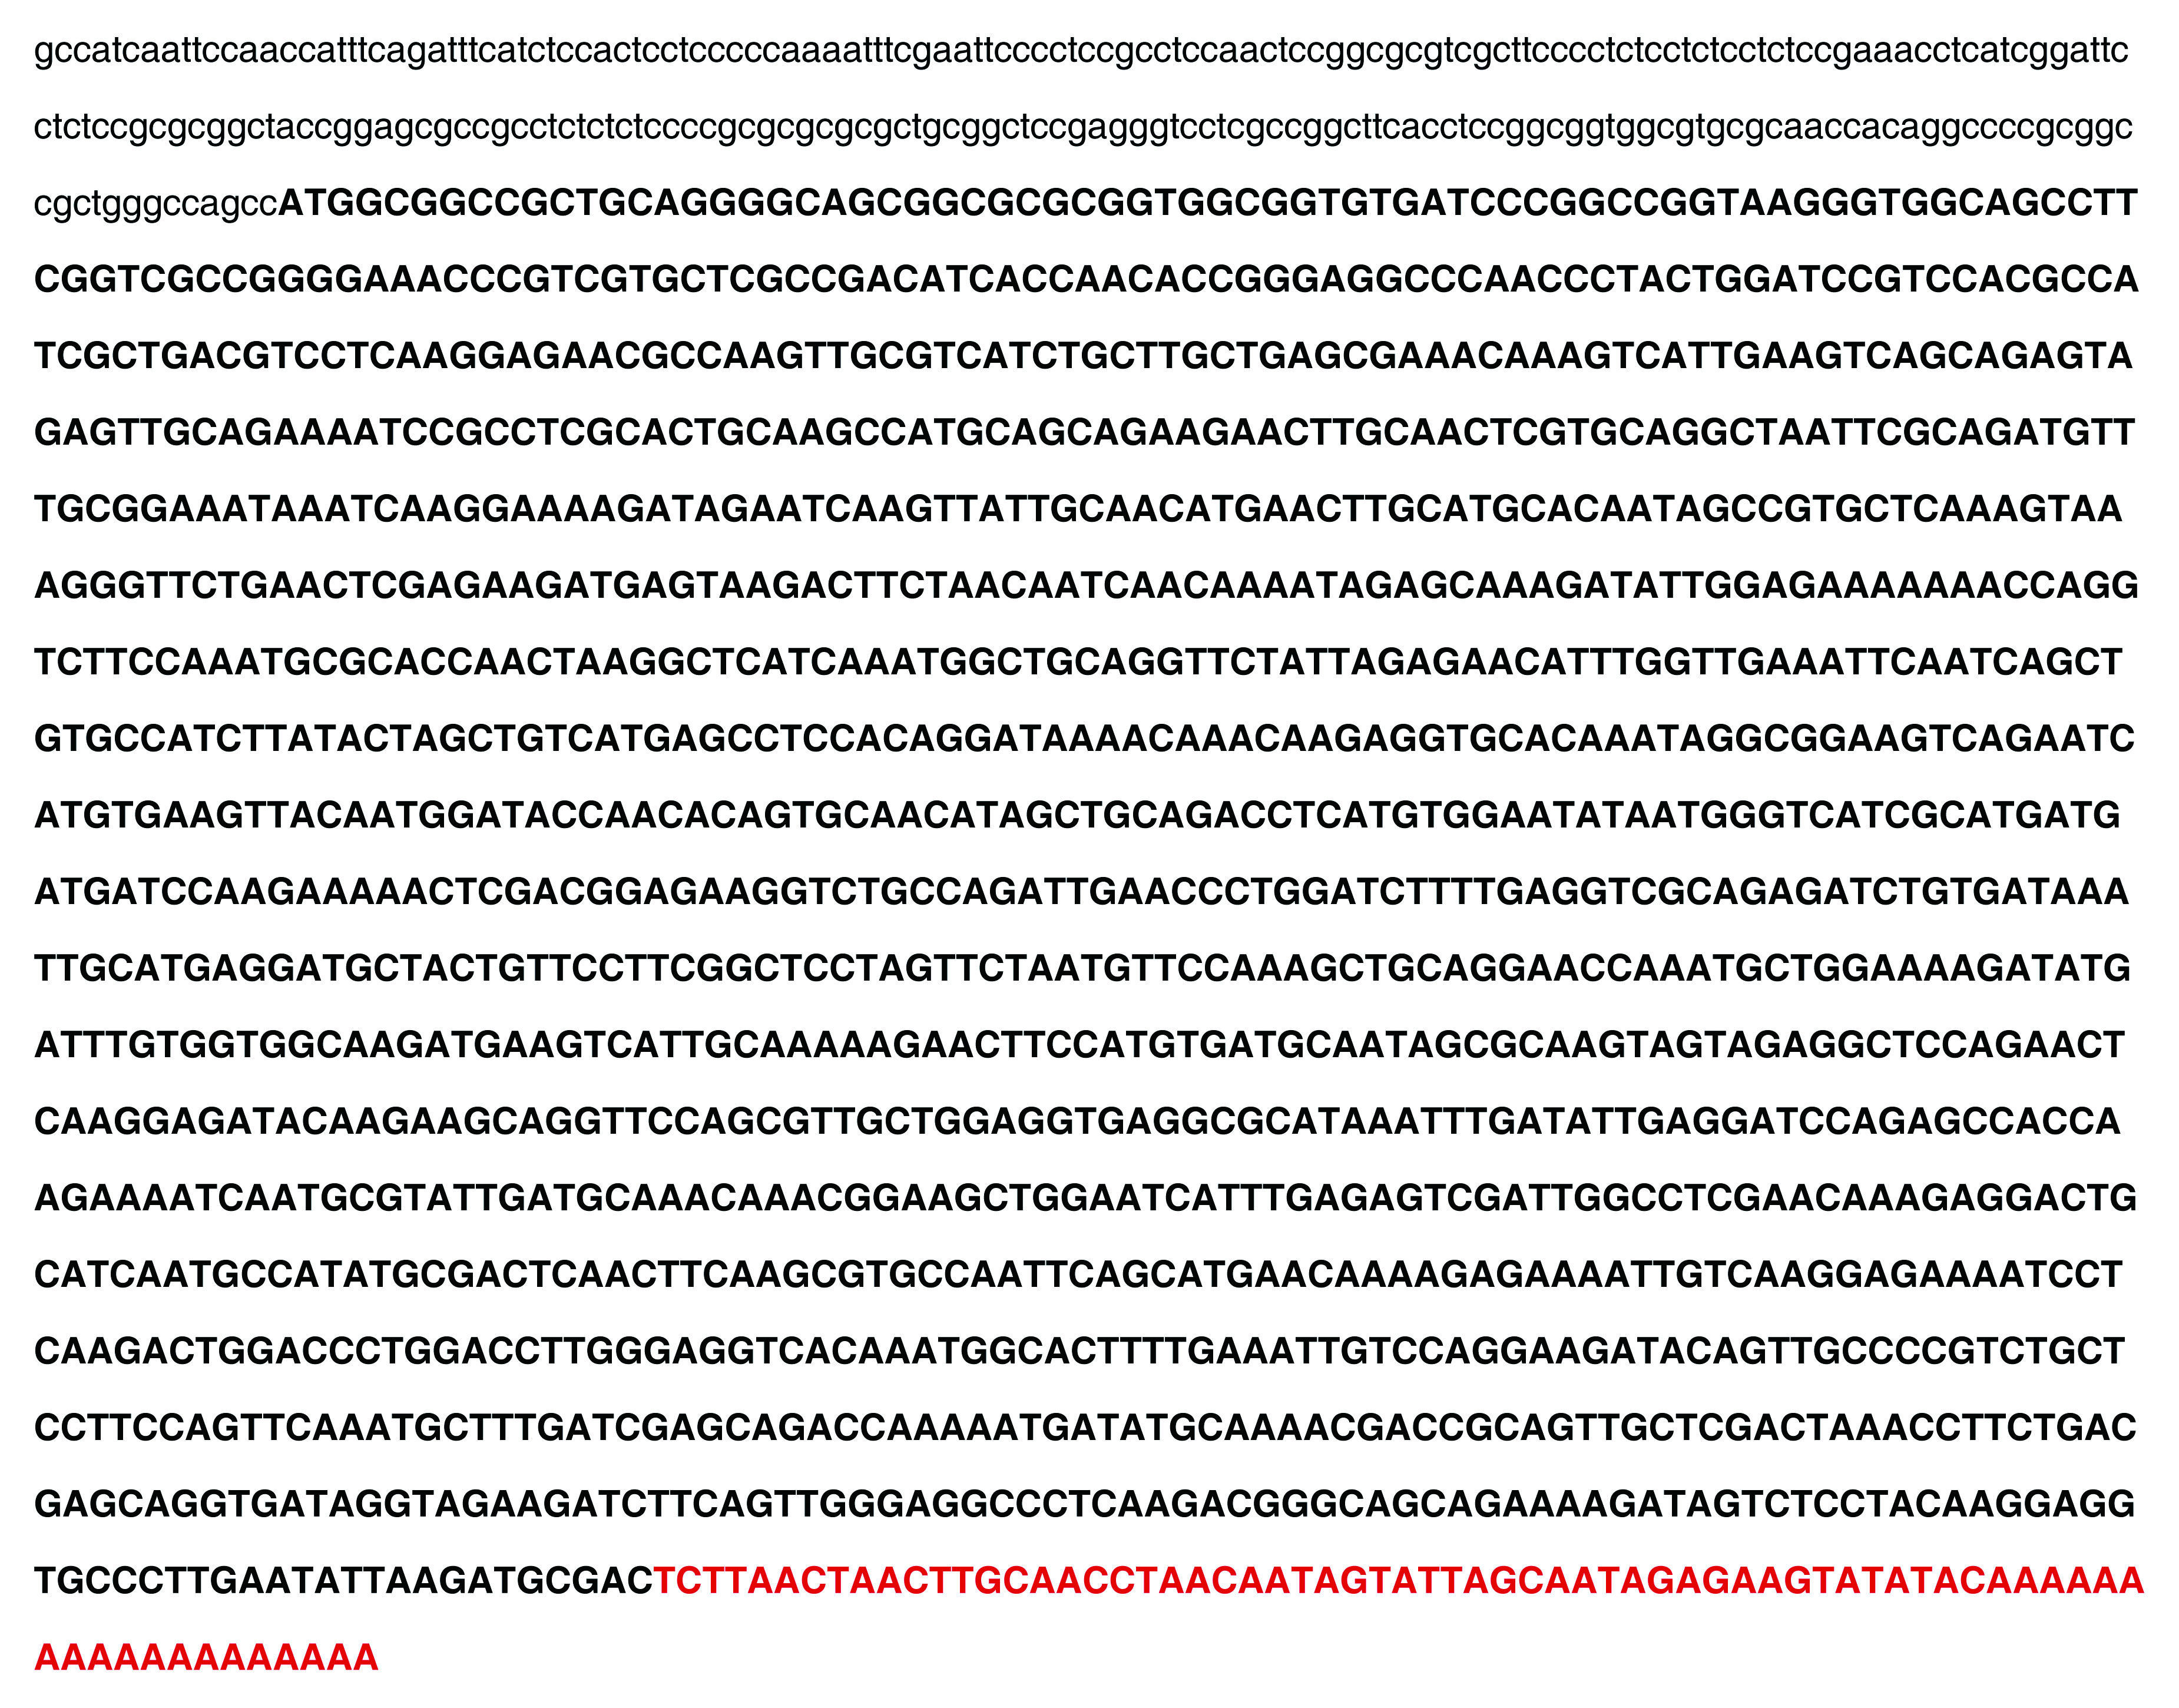
1.93 MB | The adding nucleotides at the downstream of Tos17-insertion position are indicated by red color | 1 |
| 02:52, 31 May 2014 | FigureS3.jpg (file) |  |
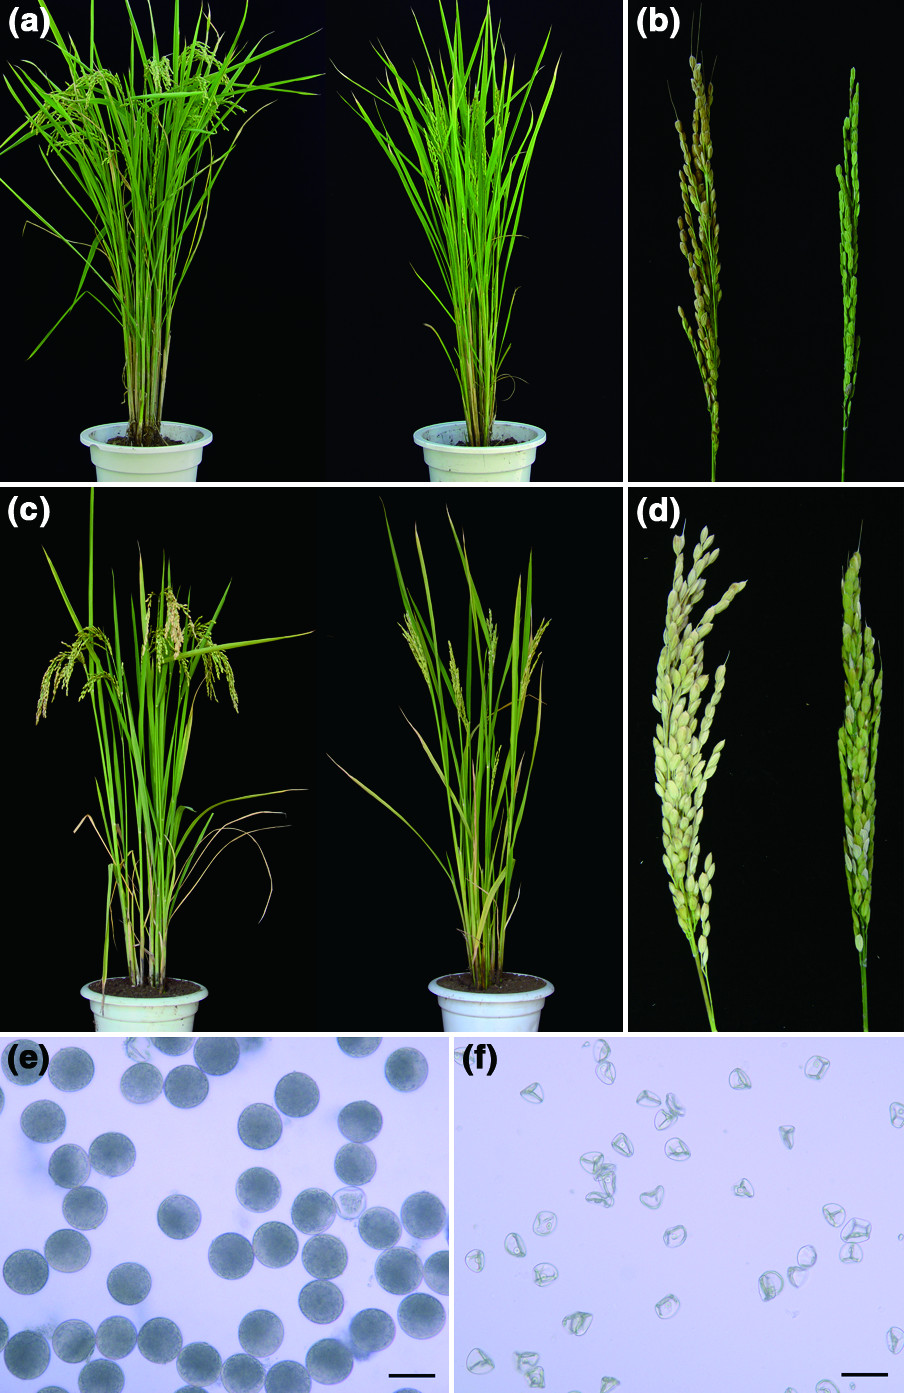
329 KB | (a) Comparison of the wild-type plant (left, Nipponbare) and the Ossgo1-1 mutant plant (right). (b) Comparison of the wild-type panicle (left, Nipponbare) and the Ossgo1-1 panicle (right). (c) Comparison of the wild-type plant (left, Yandao 8) and the Oss | 1 |
| 02:50, 31 May 2014 | FigureS2.jpg (file) |  |
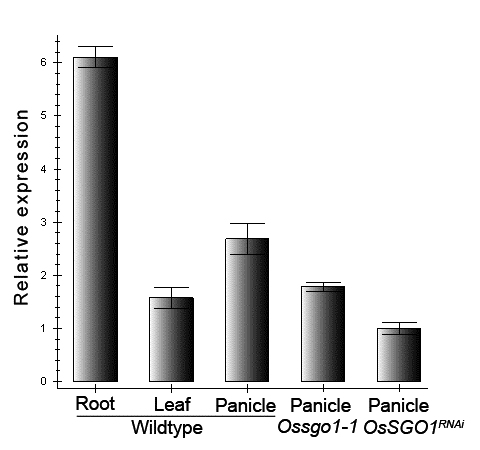
52 KB | Transcription levels of OsSGO1 in various tissues by Real-Time RT-PCR. Ubiquitin is used as endogenous control. Error bars represent SD (n=3). | 1 |
| 02:46, 31 May 2014 | Figure S1.jpg (file) |  |
108 KB | Exons are represented by black boxes and untranslated regions are shown in white. The triangles indicate mutation positions in the two alleles. | 1 |
| 02:35, 31 May 2014 | FigureS4.tiff (file) |  |
3.06 MB | (a) Comparison of the wild-type plant (left, Nipponbare) and the Ossgo1-1 mutant plant (right). (b) Comparison of the wild-type panicle (left, Nipponbare) and the Ossgo1-1 panicle (right). (c) Comparison of the wild-type plant (left, Yandao 8) and the Oss | 1 |
| 02:31, 31 May 2014 | Figure 1.tiff (file) | |
46 KB | Exons are represented by black boxes and untranslated regions are shown in white. The triangles indicate mutation positions in the two alleles. | 1 |
| 02:25, 31 May 2014 | FigureS3.tiff (file) | |
233 KB | Transcription levels of OsSGO1 in various tissues by Real-Time RT-PCR. Ubiquitin is used as endogenous control. Error bars represent SD (n=3) | 1 |
| 02:22, 31 May 2014 | Figure S3.tiff (file) | |
233 KB | Transcription levels of OsSGO1 in various tissues by Real-Time RT-PCR. Ubiquitin is used as endogenous control. Error bars represent SD (n=3) | 1 |
| 02:13, 31 May 2014 | Figure S1.tiff (file) | |
46 KB | Exons are represented by black boxes and untranslated regions are shown in white. The triangles indicate mutation positions in the two alleles | 2 |
| 02:05, 31 May 2014 | FigureS1.tiff (file) | |
46 KB | Exons are represented by black boxes and untranslated regions are shown in white. The triangles indicate mutation positions in the two alleles | 1 |
| 02:01, 31 May 2014 | Figure S1. Schematic representation of OsSGO1 gene.tiff (file) | |
46 KB | Exons are represented by black boxes and untranslated regions are shown in white. The triangles indicate mutation positions in the two alleles | 1 |