Toggle navigation
Databases
Tools
Standards
Publications
About
Cardiovascular Disease Atlas
Data release 1.0
Home
Browse
Disease
Trait
Dataset
Gene
SNP
Association
Publication
Search
Knowledge graph
Disease
Trait
Gene
Tool
Enrichment analysis
Signature comparison
Download
Documentation
Home
Dataset
CVDS000004
CVDS000004
Basic information
Metadata
Differential expressed gene
GO enrichment
Gene expression
Co-expression network
Basic information
Omics
Disease
Tissue/cell type
Method
Number of samples
CVD Atlas ID
GEO link
Transcriptomics
Intracranial aneurysm
Neutrophil
RNA-seq
32
CVDS000004
GSE106520
Metadata
Search:
GEO accession
Run
BioSample
Experiment
Reported condition
Mapped Condition
Tissue
GSM2839721
SRR6255415
SAMN07977096
SRX3361930
Control
Control
neutrophils
GSM2839722
SRR6255416
SAMN07977097
SRX3361931
Control
Control
neutrophils
GSM2839723
SRR6255417
SAMN07977098
SRX3361932
Control
Control
neutrophils
GSM2839724
SRR6255418
SAMN07977099
SRX3361933
Control
Control
neutrophils
GSM2839725
SRR6255419
SAMN07977100
SRX3361934
Control
Control
neutrophils
GSM2839726
SRR6255420
SAMN07977087
SRX3361935
Control
Control
neutrophils
GSM2839727
SRR6255421
SAMN07977088
SRX3361936
Control
Control
neutrophils
GSM2839728
SRR6255422
SAMN07977089
SRX3361937
Control
Control
neutrophils
GSM2839729
SRR6255423
SAMN07977090
SRX3361938
Control
Control
neutrophils
GSM2839730
SRR6255424
SAMN07977091
SRX3361939
Control
Control
neutrophils
Showing 1 to 10 of 32 entries
Previous
1
2
3
4
Next
GEO accession
Condition
Tissue
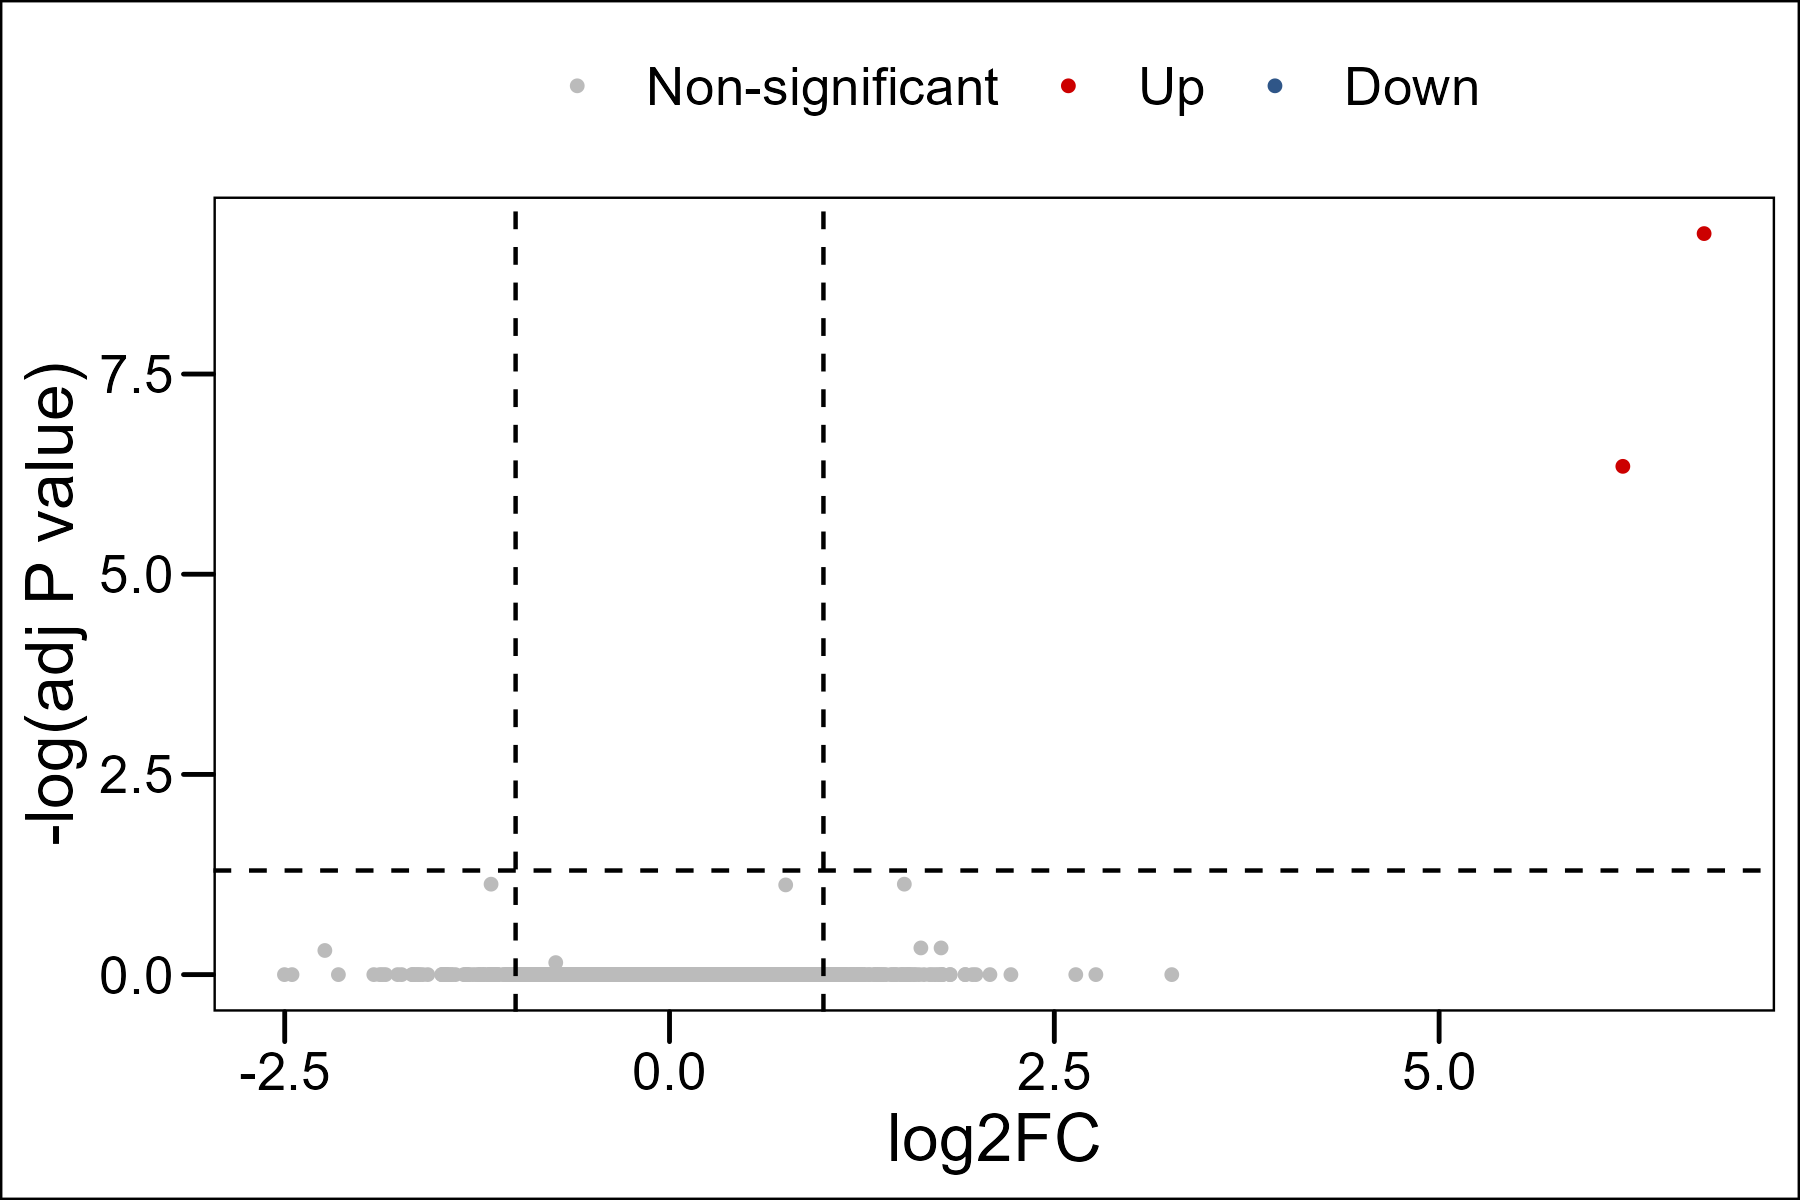
Differential analysis
Up: log2FC > 1 and adjusted P value <0.05
Down: log2FC < -1 and adjusted P value <0.05
Non-significant: -1 < log2FC < 1 or adjusted P value >0.05
Only show significant DEGs
Search:
Symbol
log2FC
P value
Adjusted P value
Group1
Group2
ENSG00000289474
6.72
2.56e-14
5.57e-10
Intracranial aneurysm
Control
MTRNR2L1
6.19
4.13e-11
4.49e-7
Intracranial aneurysm
Control
TBC1D3C
2.77
0.0526
1.00
Intracranial aneurysm
Control
ENSG00000258465
2.22
0.0190
1.00
Intracranial aneurysm
Control
ENSG00000287856
1.99
0.350
1.00
Intracranial aneurysm
Control
PCDH8
1.92
0.0754
1.00
Intracranial aneurysm
Control
MKKS
1.92
0.292
1.00
Intracranial aneurysm
Control
ENSG00000273262
1.82
0.0610
1.00
Intracranial aneurysm
Control
ENSG00000274177
1.77
0.287
1.00
Intracranial aneurysm
Control
CYP1B1
1.76
0.000130
0.464
Intracranial aneurysm
Control
Showing 1 to 10 of 18,137 entries
Previous
1
2
3
…
1814
Next
GO enrichment
Up regulated
Down regulated
Search:
Ontology
GO ID
GO term
GeneRatio
BgRatio
P value
Adjusted P value
Q value
Gene count
Regulatory trend
BP
GO:1900118
negative regulation of execution phase of apoptosis
1/1
24/18866
1.27e-3
5.12e-3
NaN
1
Up
BP
GO:1900117
regulation of execution phase of apoptosis
1/1
41/18866
2.17e-3
5.12e-3
NaN
1
Up
BP
GO:2000272
negative regulation of signaling receptor activity
1/1
58/18866
3.07e-3
5.12e-3
NaN
1
Up
BP
GO:0097194
execution phase of apoptosis
1/1
95/18866
5.04e-3
6.29e-3
NaN
1
Up
BP
GO:0010469
regulation of signaling receptor activity
1/1
174/18866
9.22e-3
9.22e-3
NaN
1
Up
MF
GO:0048019
receptor antagonist activity
1/1
32/18352
1.74e-3
2.23e-3
NaN
1
Up
MF
GO:0030547
receptor inhibitor activity
1/1
41/18352
2.23e-3
2.23e-3
NaN
1
Up
Showing 1 to 7 of 7 entries
Previous
1
Next
Gene expression
ENSG00000276663
ENSG00000276663
Expression level
0
0.2
0.4
0.6
0.8
Intracranial aneurysm
Control
Search:
Gene
Condition
Min
Q1
Median
Q3
Max
ENSG00000276663
Control
0
0.16
0.3
0.48
0.57
ENSG00000276663
Intracranial aneurysm
0.07
0.14
0.31
0.45
0.77
Showing 1 to 2 of 2 entries
Previous
1
Next
Co-expression network
No result.
Control
Intracranial aneurysm
magenta
greenyellow
royalblue
yellow
darkred
0.25
0.24
-0.21
0.19
0.19
-0.25
-0.24
0.21
-0.19
-0.19
1.63e-1
3.06e-1
Module-trait relationships in CVDS000004
Module
Trait
Correlation
P value
magenta
Control
0.25
1.63e-1
greenyellow
Control
0.24
1.84e-1
royalblue
Intracranial aneurysm
0.21
2.51e-1
yellow
Control
0.19
2.94e-1
darkred
Control
0.19
3.06e-1
Showing 1 to 5 of 10 entries
Previous
1
2
Next
Module
darkred
greenyellow
magenta
royalblue
yellow
darkred
darkred
greenyellow
magenta
royalblue
yellow
Only top 100 pairs are retained and displayed in network plot, ordered by 'Weight'.
ENSG00000269937
ENSG00000289091
ENSG00000250031
RPL11P3
ENSG00000251288
ENSG00000289504
ENSG00000287680
ENSG00000282980
GAPDHP43
ENSG00000289071
ENSG00000264937
ENSG00000258101
ENSG00000273076
MRPL51
ENSG00000279568
TACO1
ENSG00000280138
H3Y2
ENSG00000269487
ENSG00000286864
ENSG00000289457
TPRKBP2
PXN-AS1
ENSG00000243402
PLEKHG6
ENSG00000257258
ENSG00000231616
ENSG00000273680
C12orf76
RN7SL600P
ENSG00000287917
ENSG00000277595
XPC-AS1
C4orf19
ENSG00000285730
ENSG00000267632
ENSG00000258302
ENSG00000274765
RHOA-IT1
D2HGDH
SLED1
ENSG00000288393
ENSG00000262766
LINC01890
ENSG00000271454
LINC00877
TP53BP1
ENSG00000289463
RN7SL473P
ENSG00000278231
PDXP
PPM1F-AS1
ENSG00000289170
ENSG00000268583
ENSG00000287920
BLZF2P
ACAT2
ENSG00000254019
ENSG00000215154
SH2B3
ENSG00000260059
INTS9
ARFRP1
ENSG00000261172
RSPH3
RNU6-595P
OR10AA1P
ENSG00000288900
ENSG00000218809
ENSG00000284669
CNTNAP3B
ZNF394
PTP4A2P1
FAM41C
ENSG00000285653
RPS12P20
PP2D1
TRIB1
LINC00216
Search:
Node 1
Node 2
Weight
Detail
ENSG00000269937
ENSG00000289091
0.143
Detail
ENSG00000250031
ENSG00000289091
0.136
Detail
RPL11P3
ENSG00000289091
0.132
Detail
ENSG00000251288
ENSG00000289091
0.131
Detail
ENSG00000289091
ENSG00000289504
0.130
Detail
Showing 1 to 5 of 100 entries
Previous
1
2
3
…
20
Next
XXXX
Basic information
Metadata
Significant SNP
Colocalization
Basic information
CVD Atlas ID
CVDS000004
Data type
GWAS summary statistics
Disease/trait
Title
PubMed ID
GWAS Catalog link
Link
Metadata
Study
Number of cases
Number of controls
Total
Ancestry
Significant SNP
No SNP with a p value less than 5e-8.
SNP
Effect allele
Other allele
Beta
Standard error
P value
Odds ratio
Colocalization
No data available.
Gene
Tissue
#SNPs
PP.H4.abf
PP4/PP3
Coloc SNP
GWAS risk SNP
PP.H0.abf
PP.H1.abf
PP.H2.abf
PP.H3.abf
XXXX
Basic information
Differentially expressed metabolite
Basic information
CVD Atlas ID
Omics
Reported disease
Mapped disease
Tissue
Number of samples
Data source
Differential analysis
Metabolite
Reported disease
Mapped disease
VIP
Super class
Main class
Sub class
Formula
Exact mass
PubChem ID
Dataset
XXXX
Basic information
Differentially expressed protein
Basic information
CVD Atlas ID
Omics
Reported disease
Mapped disease
Tissue
Number of samples
Data source
Differential analysis
UniProt ID
Average log2FC
P value
XXXX
Basic information
Metadata
Differential methylation position
GO enrichment
Basic information
CVD Atlas ID
Disease
Omics
Tissue/cell type
Method
Number of samples
GEO link
Metadata
GEO accession
Reported condition
Mapped condition
Tissue
GO enrichment
ID
Gene
Delta beta
P value
Adjusted P value
GO enrichment
Up regulated
Down regulated
Loading