Toggle navigation
Databases
Tools
Standards
Publications
About
Cardiovascular Disease Atlas
Data release 1.0
Home
Browse
Disease
Trait
Dataset
Gene
SNP
Association
Publication
Search
Knowledge graph
Disease
Trait
Gene
Tool
Enrichment analysis
Signature comparison
Download
Documentation
Home
Dataset
CVDS000592
CVDS000592
Basic information
Metadata
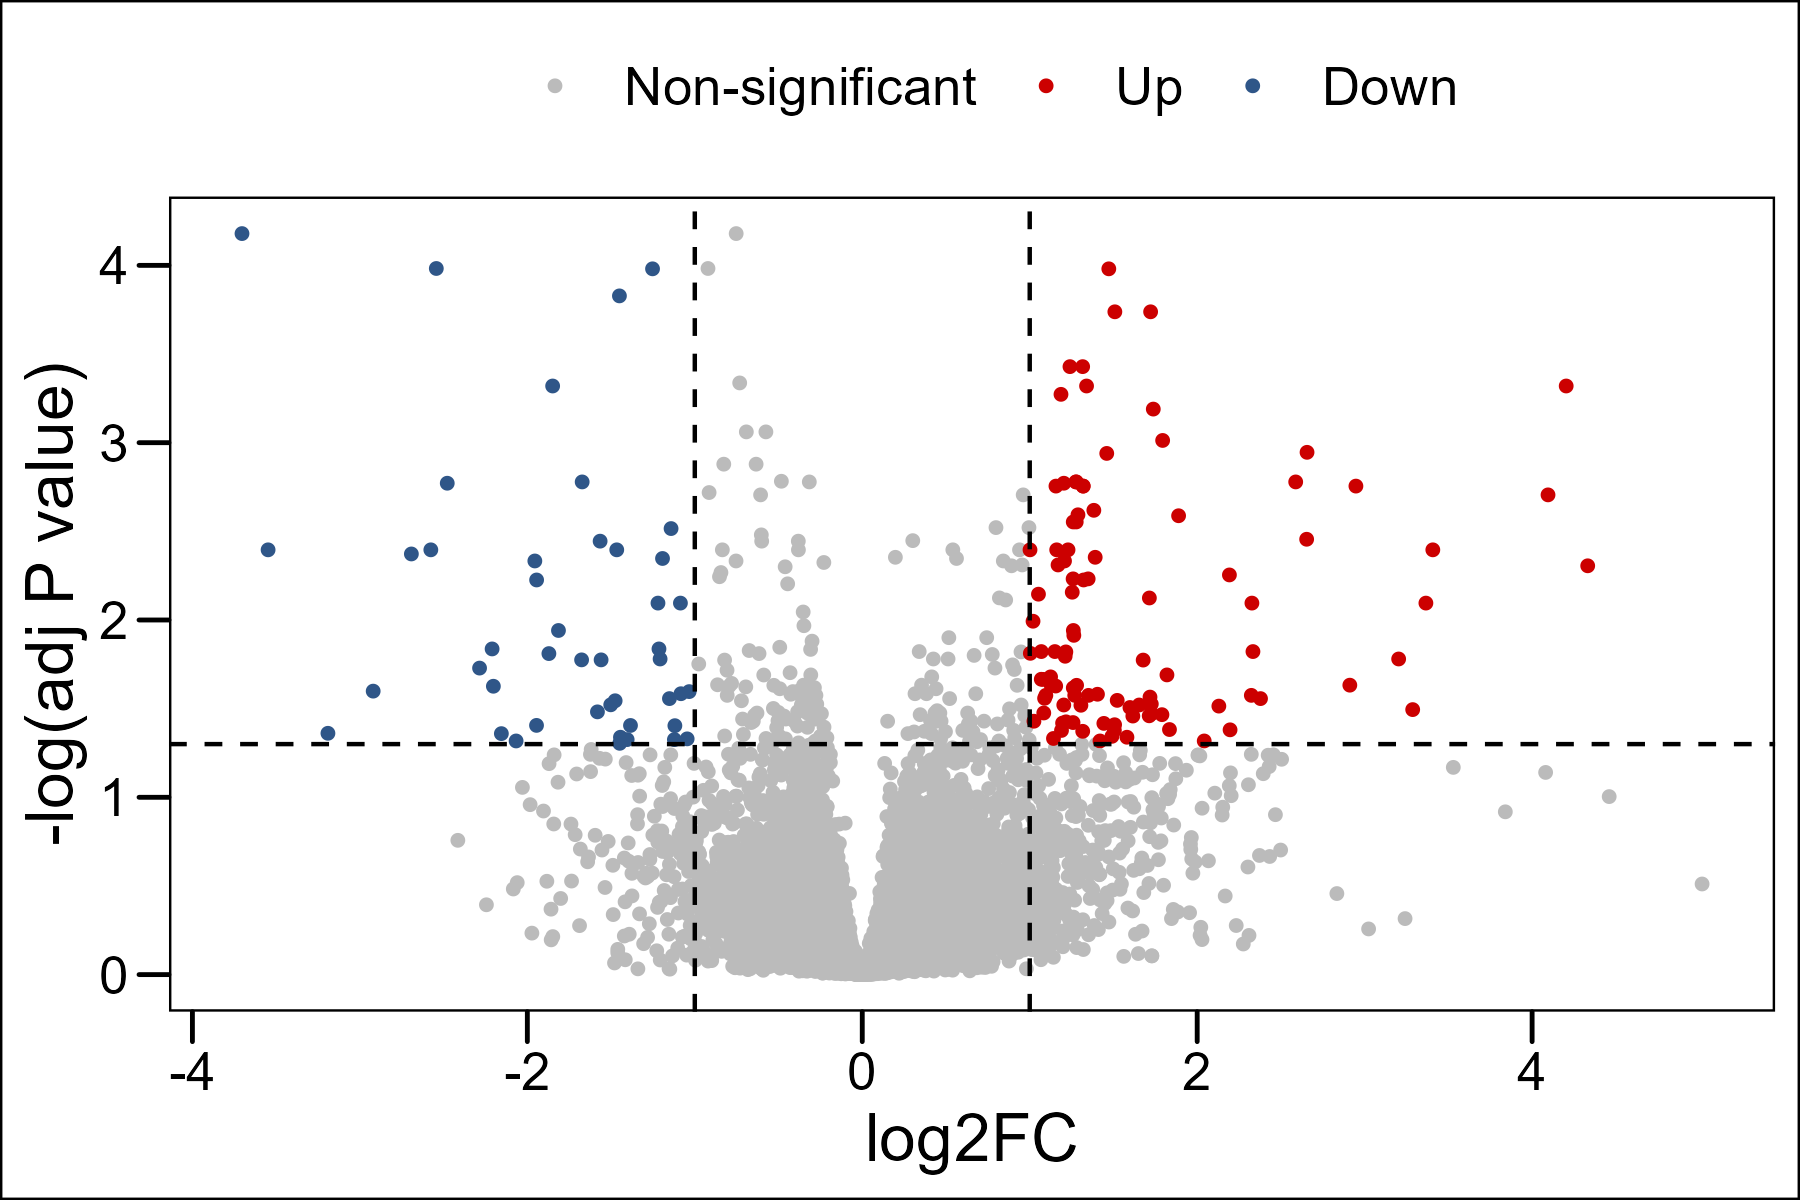
Differential expressed gene
GO enrichment
Gene expression
Co-expression network
Basic information
Omics
Disease
Tissue/cell type
Method
Number of samples
CVD Atlas ID
GEO link
Transcriptomics
Stroke
Blood
RNA-seq
24
CVDS000592
GSE158312
Metadata
Search:
GEO accession
Run
BioSample
Experiment
Reported condition
Mapped Condition
Tissue
GSM4797295
SRR12683357
SAMN16233452
SRX9163341
ischemic stroke
Ischemic stroke
whole blood
GSM4797296
SRR12683358
SAMN16233451
SRX9163342
ischemic stroke
Ischemic stroke
whole blood
GSM4797297
SRR12683359
SAMN16233450
SRX9163343
ischemic stroke
Ischemic stroke
whole blood
GSM4797298
SRR12683360
SAMN16233449
SRX9163344
ischemic stroke
Ischemic stroke
whole blood
GSM4797299
SRR12683361
SAMN16233432
SRX9163345
Control
Control
whole blood
GSM4797300
SRR12683362
SAMN16233431
SRX9163346
ischemic stroke
Ischemic stroke
whole blood
GSM4797301
SRR12683363
SAMN16233430
SRX9163347
ischemic stroke
Ischemic stroke
whole blood
GSM4797302
SRR12683364
SAMN16233429
SRX9163348
ischemic stroke
Ischemic stroke
whole blood
GSM4797303
SRR12683365
SAMN16233448
SRX9163349
ischemic stroke
Ischemic stroke
whole blood
GSM4797304
SRR12683366
SAMN16233447
SRX9163350
Control
Control
whole blood
Showing 1 to 10 of 24 entries
Previous
1
2
3
Next
GEO accession
Condition
Tissue
Differential analysis
Up: log2FC > 1 and adjusted P value <0.05
Down: log2FC < -1 and adjusted P value <0.05
Non-significant: -1 < log2FC < 1 or adjusted P value >0.05
Only show significant DEGs
Search:
Symbol
log2FC
P value
Adjusted P value
Group1
Group2
No data available in table
Showing 0 to 0 of 0 entries
Previous
Next
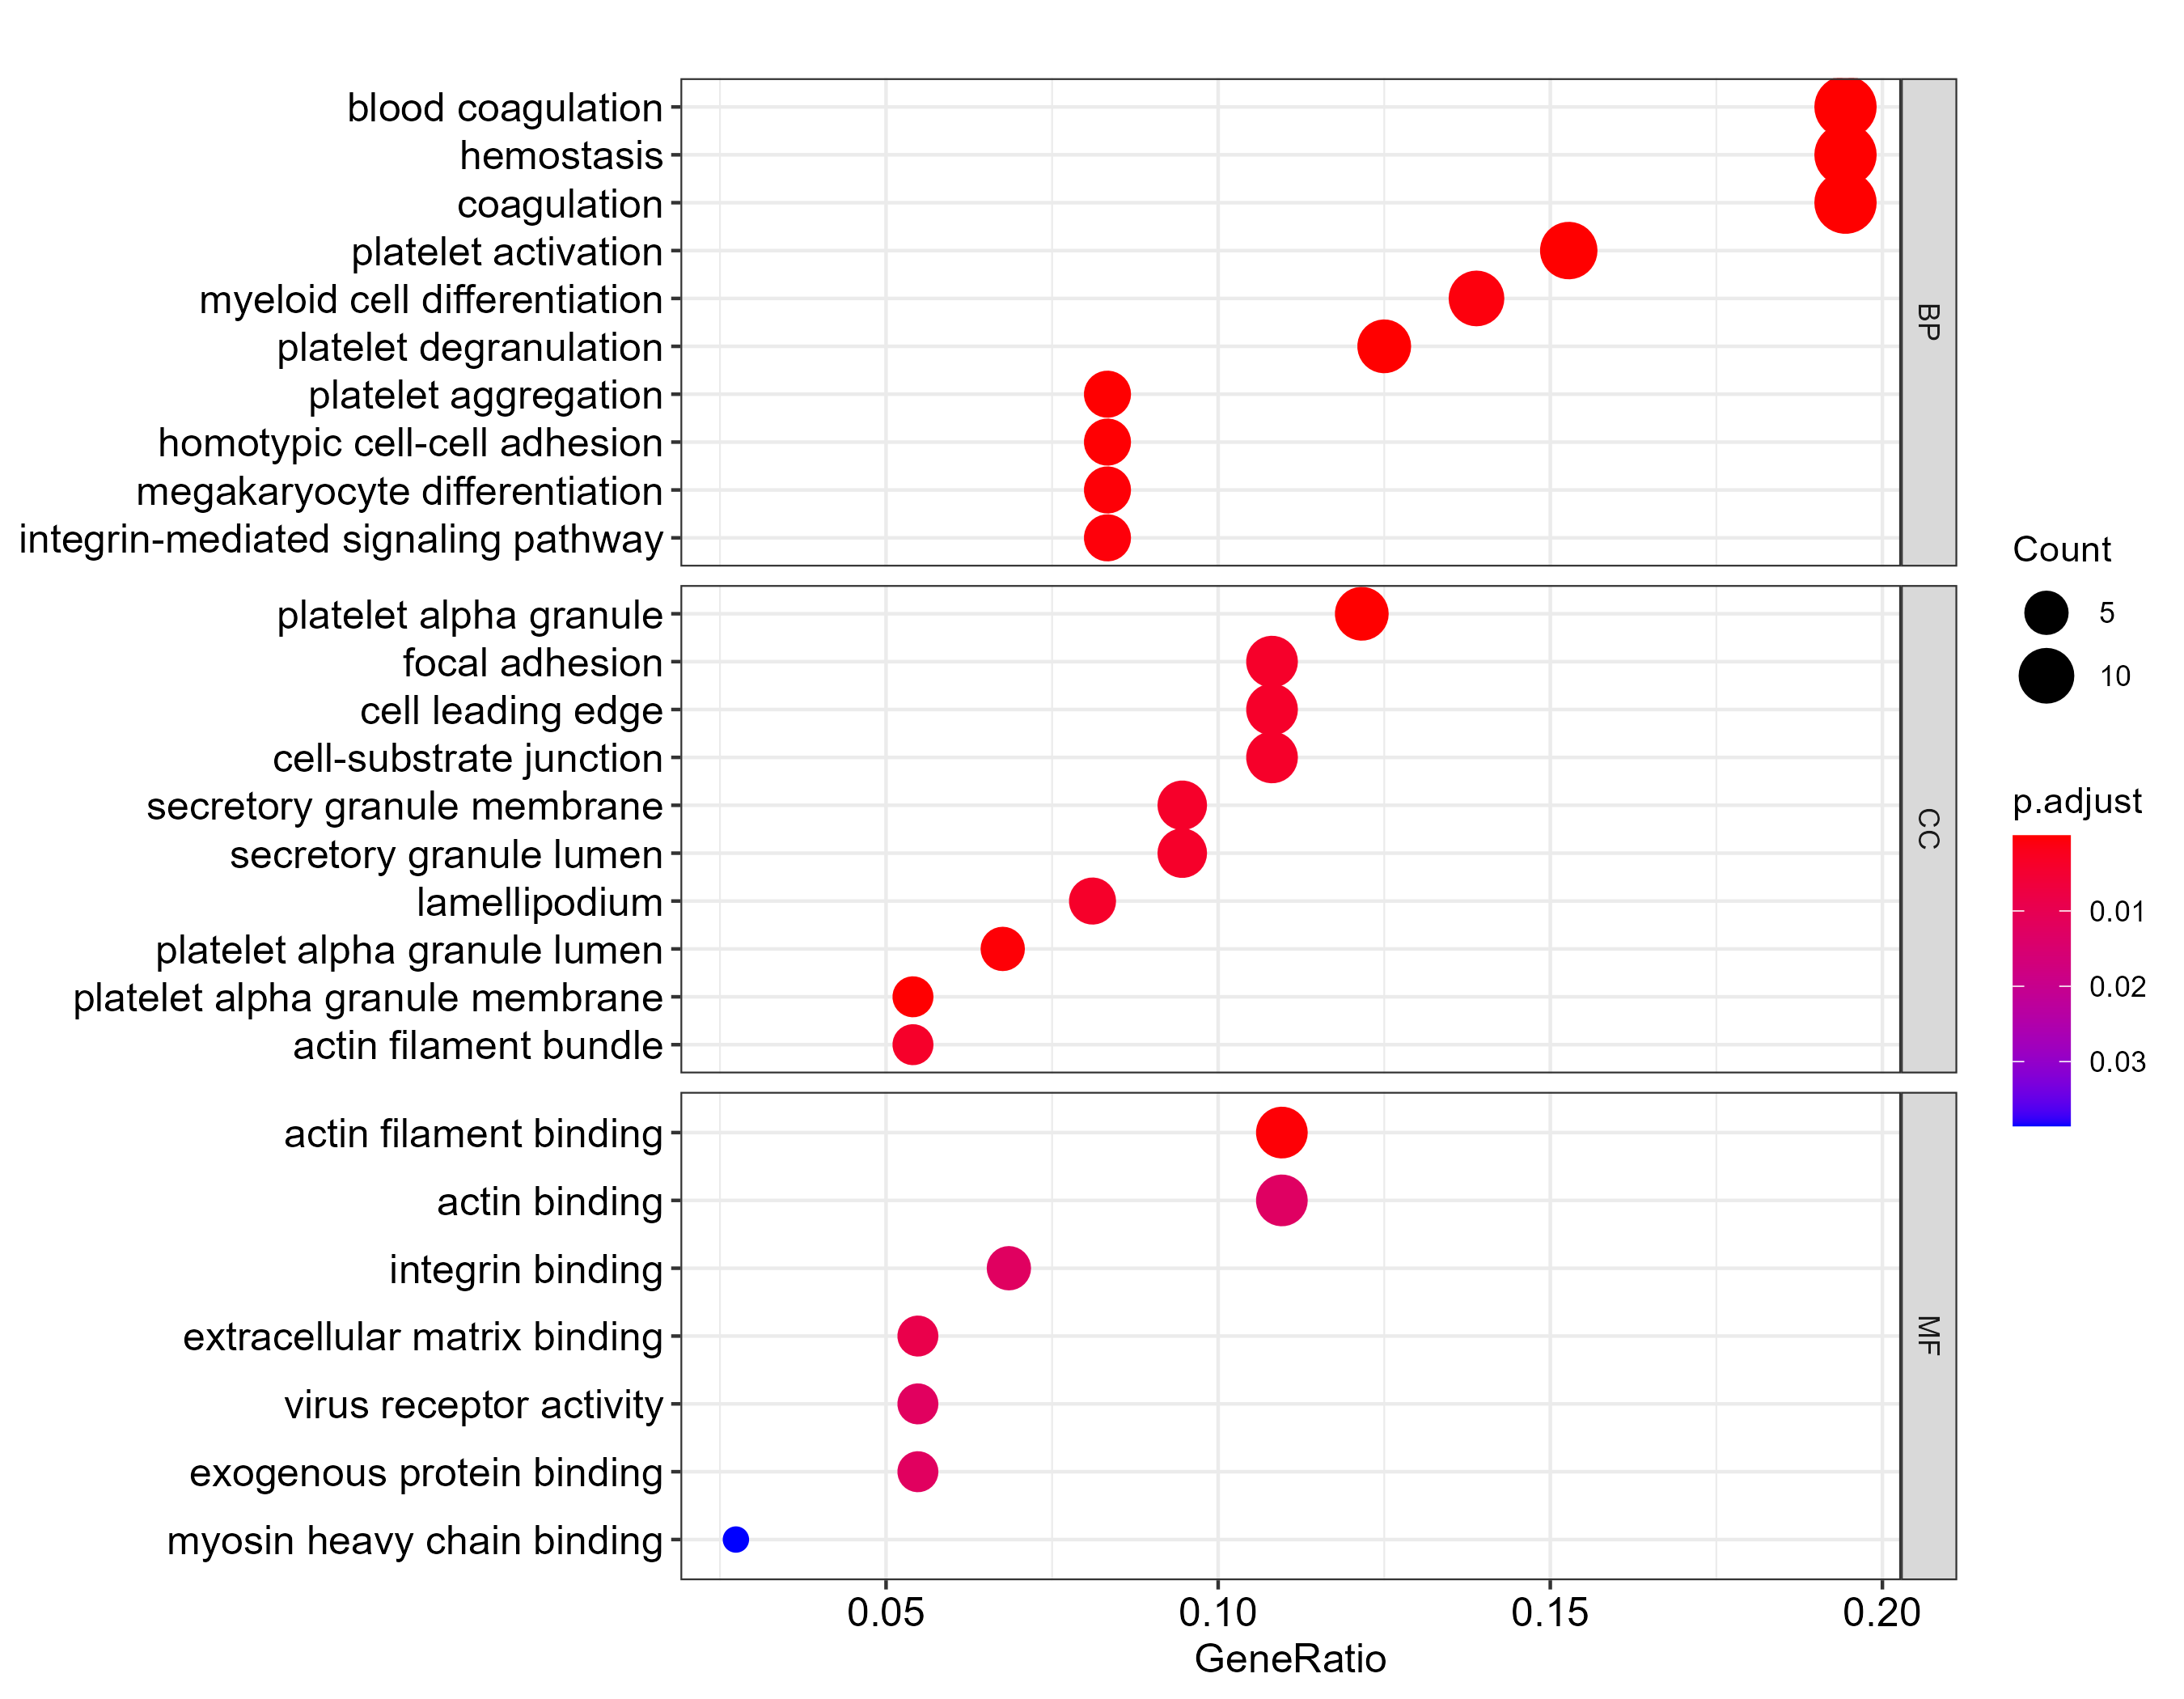
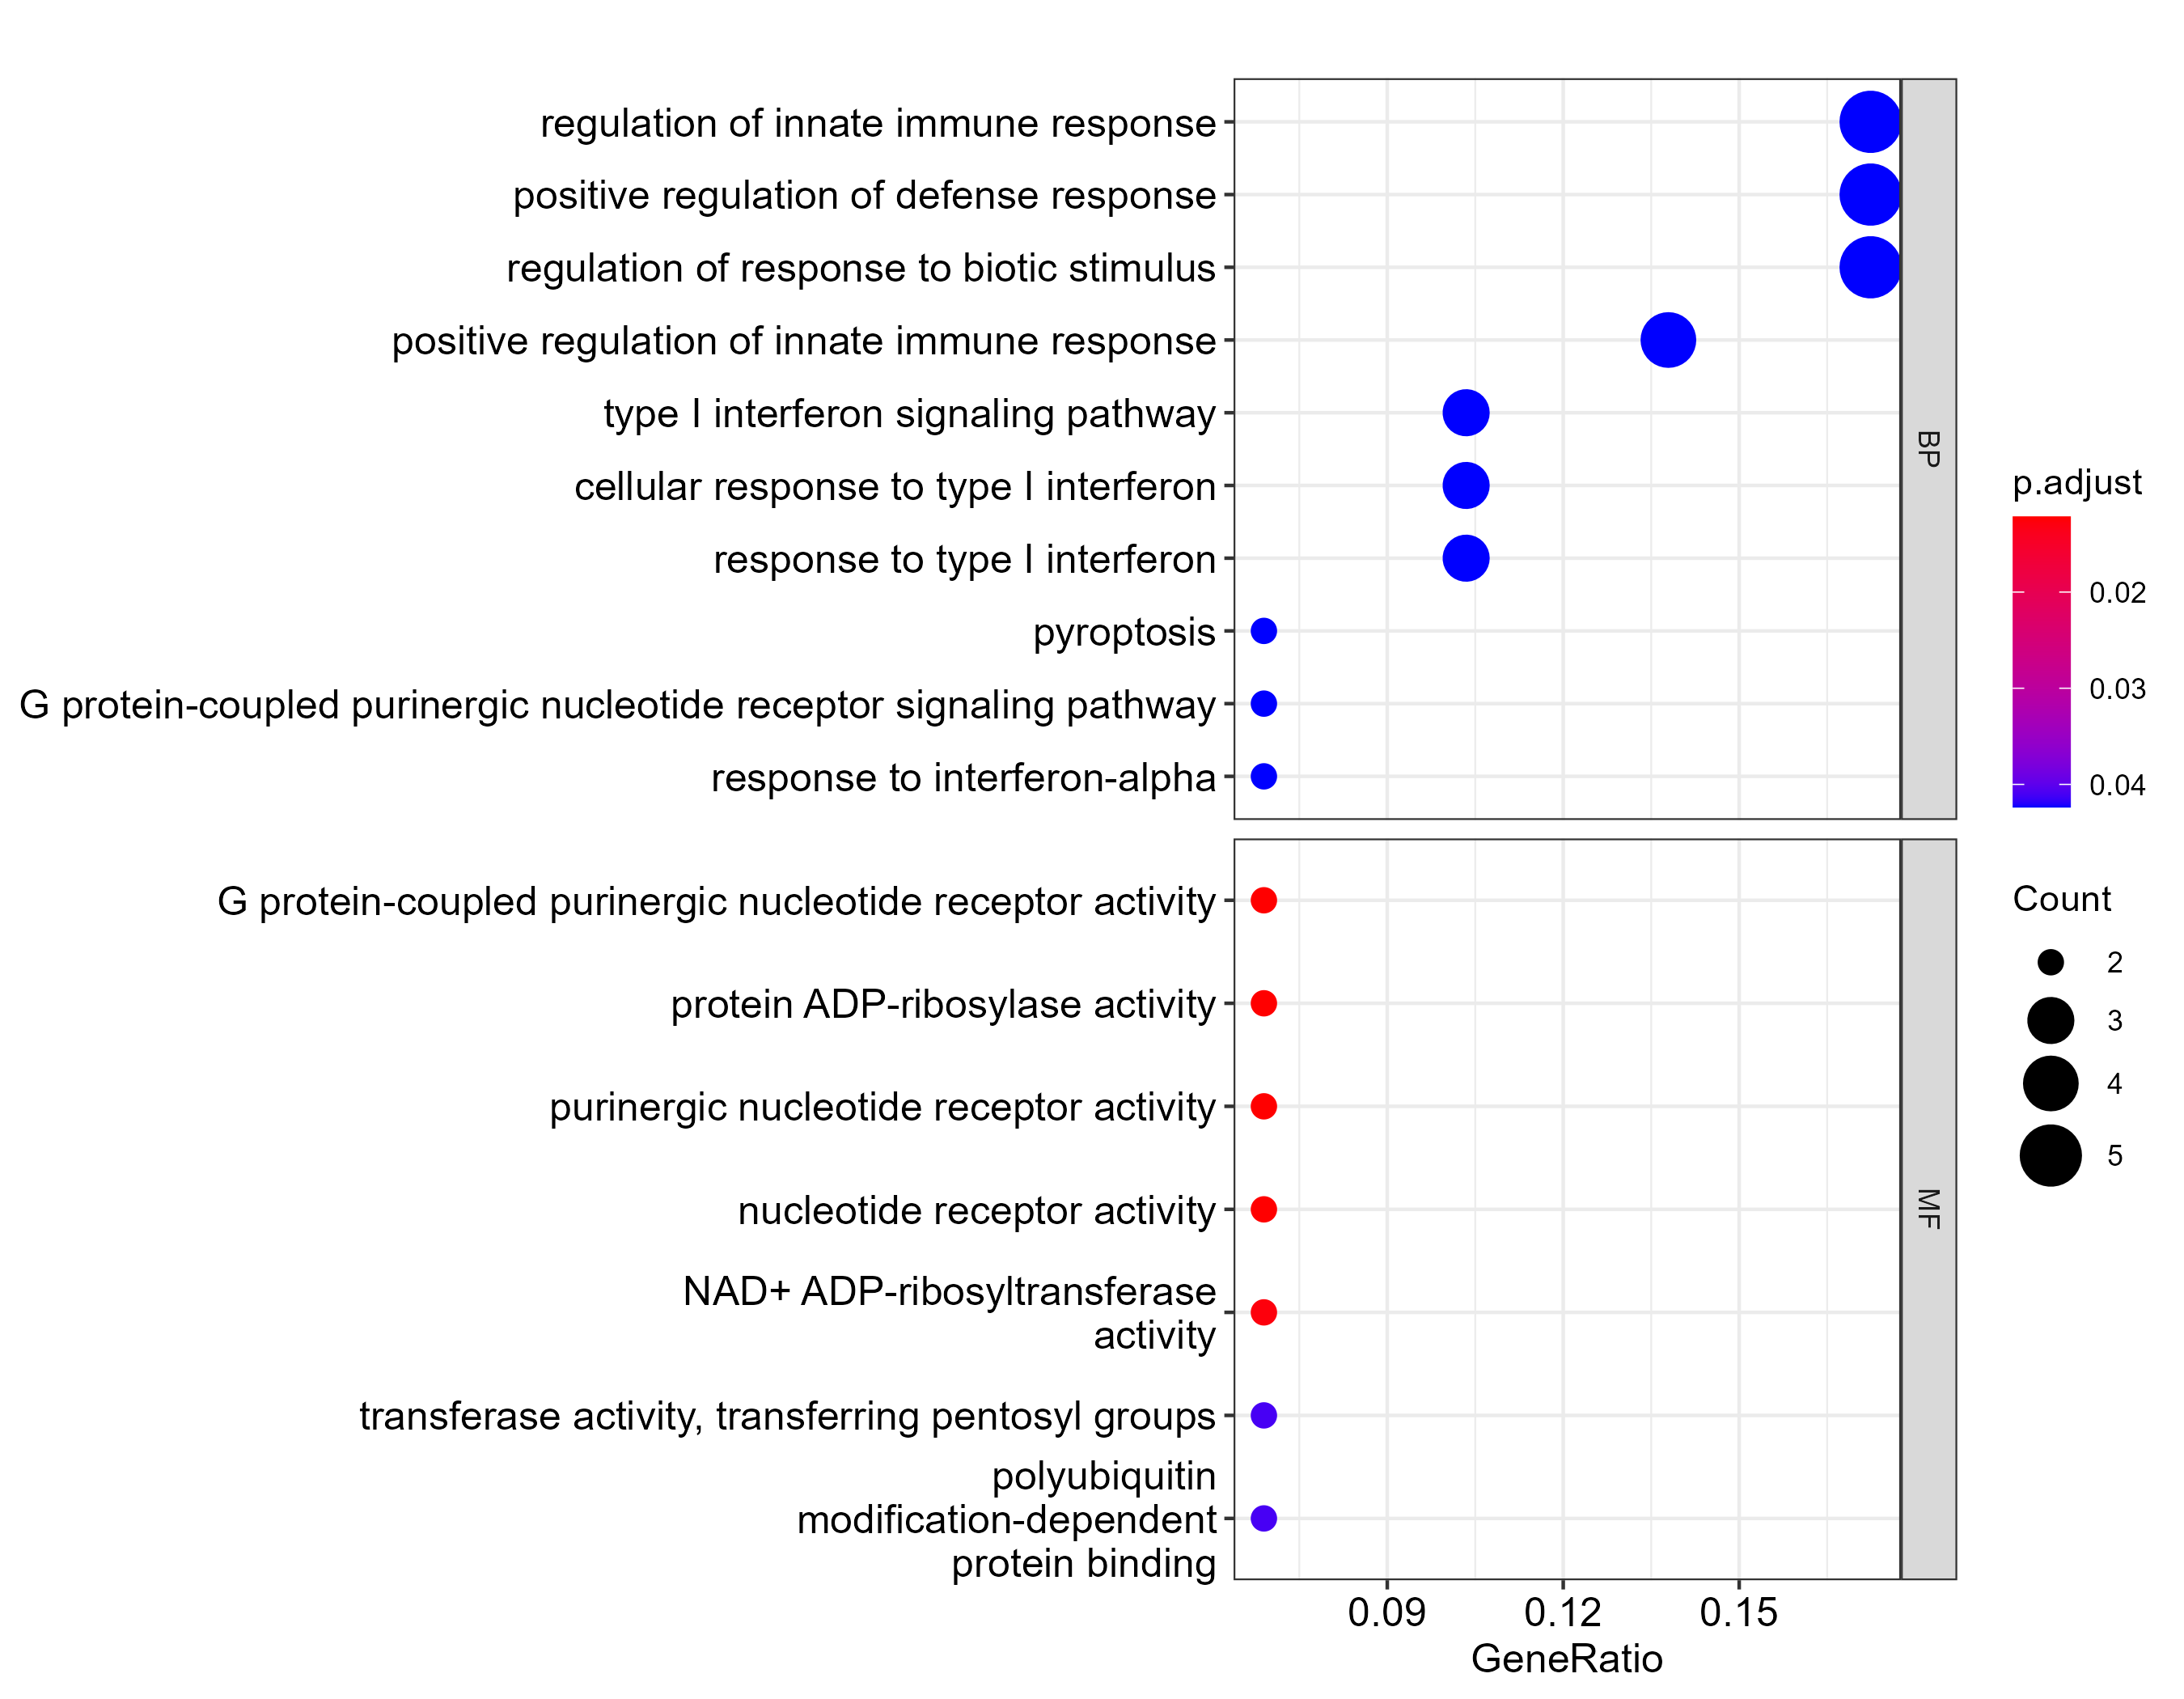
GO enrichment
Up regulated
Down regulated
Search:
Ontology
GO ID
GO term
GeneRatio
BgRatio
P value
Adjusted P value
Q value
Gene count
Regulatory trend
BP
GO:0030168
platelet activation
11/72
158/18866
1.95e-11
1.88e-8
1.54e-8
11
Up
BP
GO:0007596
blood coagulation
14/72
343/18866
3.82e-11
1.88e-8
1.54e-8
14
Up
BP
GO:0007599
hemostasis
14/72
348/18866
4.63e-11
1.88e-8
1.54e-8
14
Up
BP
GO:0050817
coagulation
14/72
349/18866
4.81e-11
1.88e-8
1.54e-8
14
Up
BP
GO:0002576
platelet degranulation
9/72
129/18866
1.46e-9
4.56e-7
3.74e-7
9
Up
BP
GO:0070527
platelet aggregation
6/72
62/18866
1.30e-7
3.38e-5
2.77e-5
6
Up
BP
GO:0034109
homotypic cell-cell adhesion
6/72
86/18866
9.23e-7
2.06e-4
1.69e-4
6
Up
BP
GO:0030219
megakaryocyte differentiation
6/72
100/18866
2.24e-6
4.38e-4
3.60e-4
6
Up
BP
GO:0007229
integrin-mediated signaling pathway
6/72
108/18866
3.52e-6
6.11e-4
5.02e-4
6
Up
BP
GO:0030099
myeloid cell differentiation
10/72
431/18866
5.28e-6
8.25e-4
6.78e-4
10
Up
Showing 1 to 10 of 177 entries
Previous
1
2
3
4
5
…
18
Next
Gene expression
ENSG00000288970
ENSG00000288970
Expression level
0
2
4
6
8
10
12
14
Ischemic stroke
Control
Search:
Gene
Condition
Min
Q1
Median
Q3
Max
ENSG00000288970
Control
0.56
0.88
1.56
2.83
3.74
ENSG00000288970
Ischemic stroke
0.02
1.47
2.23
3.54
12.33
Showing 1 to 2 of 2 entries
Previous
1
Next
Co-expression network
No result.
Control
Ischemic stroke
orange
thistle1
saddlebrown
coral1
lightsteelblue1
-0.66
-0.6
0.57
-0.56
-0.54
0.66
0.6
-0.57
0.56
0.54
4.91e-4
6.51e-3
Module-trait relationships in CVDS000592
Module
Trait
Correlation
P value
orange
Ischemic stroke
0.66
4.91e-4
thistle1
Ischemic stroke
0.60
2.01e-3
saddlebrown
Control
0.57
3.94e-3
coral1
Ischemic stroke
0.56
4.74e-3
lightsteelblue1
Ischemic stroke
0.54
6.51e-3
Showing 1 to 5 of 10 entries
Previous
1
2
Next
Module
coral1
lightsteelblue1
orange
saddlebrown
thistle1
coral1
coral1
lightsteelblue1
orange
saddlebrown
thistle1
Only top 100 pairs are retained and displayed in network plot, ordered by 'Weight'.
NFE2
ANXA3
MSRB1
RPS6KA1
MOB3A
IMPDH1
TALDO1
H3P6
MAPK3
GSN
PPP1R18
SEMA4B
ENSG00000289273
GNG10
LRG1
HCLS1
YIPF3
PGLYRP1
FPR1
VAV1
FLOT2
H3-3A
B9D2
CYSTM1
GPSM3
PITPNA
ATXN7L3
IST1
PXN
ZBTB7B
MLF2
ANP32A
DNAJC25-GNG10
FRAT2
ANXA11
NOL8
WIPI2
BASP1
ROPN1L
FLOT1
IL1B
Search:
Node 1
Node 2
Weight
Detail
NFE2
ANXA3
0.202
Detail
ANXA3
MSRB1
0.195
Detail
RPS6KA1
MOB3A
0.192
Detail
IMPDH1
TALDO1
0.190
Detail
TALDO1
H3P6
0.189
Detail
Showing 1 to 5 of 100 entries
Previous
1
2
3
…
20
Next
XXXX
Basic information
Metadata
Significant SNP
Colocalization
Basic information
CVD Atlas ID
CVDS000091
Data type
GWAS summary statistics
Disease/trait
Title
PubMed ID
GWAS Catalog link
Link
Metadata
Study
Number of cases
Number of controls
Total
Ancestry
Significant SNP
No SNP with a p value less than 5e-8.
SNP
Effect allele
Other allele
Beta
Standard error
P value
Odds ratio
Colocalization
No data available.
Gene
Tissue
#SNPs
PP.H4.abf
PP4/PP3
Coloc SNP
GWAS risk SNP
PP.H0.abf
PP.H1.abf
PP.H2.abf
PP.H3.abf
XXXX
Basic information
Differentially expressed metabolite
Basic information
CVD Atlas ID
Omics
Reported disease
Mapped disease
Tissue
Number of samples
Data source
Differential analysis
Metabolite
Reported disease
Mapped disease
VIP
Super class
Main class
Sub class
Formula
Exact mass
PubChem ID
Dataset
XXXX
Basic information
Differentially expressed protein
Basic information
CVD Atlas ID
Omics
Reported disease
Mapped disease
Tissue
Number of samples
Data source
Differential analysis
UniProt ID
Average log2FC
P value
XXXX
Basic information
Metadata
Differential methylation position
GO enrichment
Basic information
CVD Atlas ID
Disease
Omics
Tissue/cell type
Method
Number of samples
GEO link
Metadata
GEO accession
Reported condition
Mapped condition
Tissue
GO enrichment
ID
Gene
Delta beta
P value
Adjusted P value
GO enrichment
Up regulated
Down regulated
Loading