1. Introduction
GWAS Atlas is a manually curated resource of genome-wide genotype-phenotype (G2P) associations for a wide range of species. The current release of GWAS Atlas features a comprehensive collection 302295 curated G2Ps for 1724 traits across 10 plants and 5 animals, which were manually curated from 922 publications. More importantly, all traits were annotated and organized based on a suite of reference ontology (PTO, Plant Trait Ontology; ATOL, Animal Trait Ontology for Livestock) and our customized ontology (PPTO, Plant Phenotype and Trait Ontology; APTO, Animal Phenotype and Trait Ontology) terms. Taken together, GWAS Atlas integrates high-quality curated GWAS associations for animals and plants and provides user-friendly web interfaces for data browsing and downloading, accordingly serving as a valuable resource for genetic research of important traits and breeding application.
2. Data curation
2.1. Overview of curation processes
To provide high-quality information curated from GWAS publications, we set up a standardized curation process involving literature search, information retrieval, integration & annotation and database construction.
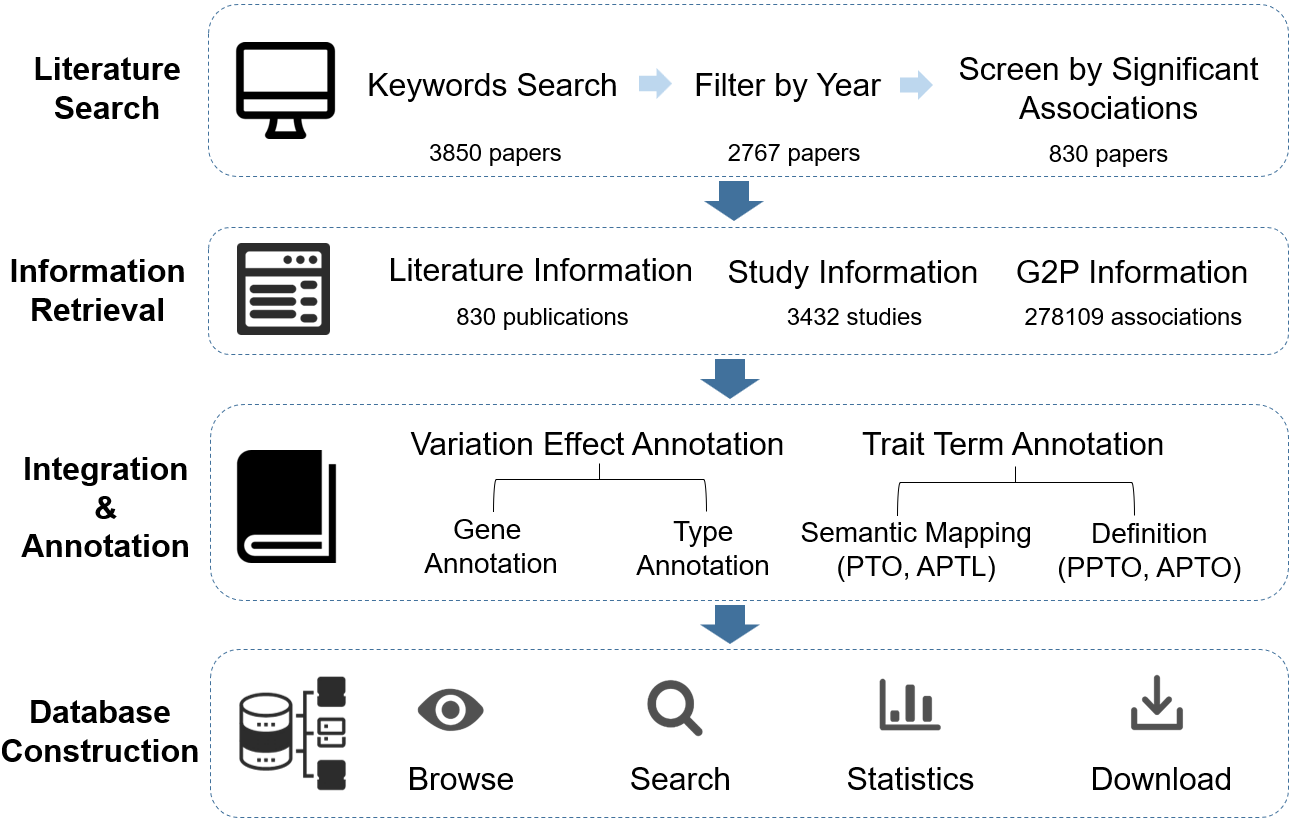
Figure 1 Overview of GWAS
Atlas
Curation Processes
2.2. Literature retrieval
We performed literature search in PubMed using species name and GWAS as keywords. Publications are eligible for inclusion in GWAS Atlas if they contain significant GWAS associations with necessary description on biological traits.
2.3. Curation models
We manually curate the study and G2P information from publications. As one publication may contain multiple studies with different experimental designs, we record species name, sampling spot, year, condition, population, sample size, genotyping technology, association model, association number, and PMID for each study. Regarding GWAS association, we collect species name, genome version, genomic position, variant ID, traits, GWAS association P-value, R2 and mapped genes.
| Data type | Description | Examples |
|---|---|---|
| Genomic Location | Localization of variation site in the genome | chr1:129845 |
| Reference Genome | The version of the reference genome | Wm82.a2.v1 |
| Environment | The growth environment of the phenotypic individuals | field |
| Sampling Spot | Geographic location of phenotype sampling | Beijing, China |
| Sampling Year | Year of sampling | 2016 |
| Condition | Treatment conditions for phenotypic individuals | salt stress |
| Population | Composition of phenotypic population | 319 landrace, 245 cultivared soybean accessions |
| Sample Size | The total number of phenotypic elements | 127 |
| Tissue | Biological tissue / organ | leaf |
| Trait | Biological traits being studied | plant height |
| Genotype Technology | The genotype technology used for genotyping | Controlled vocabulary in table3 |
| Association Model | The GWAS association model used | Controlled vocabulary in table4 |
| P-value | P-value in the GWAS model | 0.00000077 |
| R2(%) | R2(%) in the GWAS model | 18.1 |
| Gene ID | Gene ID of the related genes | Glyma.01G003300 |
| Gene Symbol | Gene symbol of the related genes | ET2 |
| PMID | Publication information | 29081789 |
| Journal | Frontiers in Plant Science | |
| Title | Genetic architecture of natural variation in rice nonphotochemical quenching capacity revealed by genome-wide association study |
| Data type | Description | Examples |
|---|---|---|
| Genomic Location | Localization of variation site in the genome | chr3:45301350 |
| Reference Genome | The version of the reference genome | Wm82.a2.v1 |
| Gene Symbol | Gene name or alias | MYB4 |
| Gene ID | Gene identifier | Glyma.03G258700 |
| Reference allele | The base that is consistent with the reference genome | A, T, C, G |
| Alternative allele | The base that is not consistent with the reference genome (effect allele) | A, T, C, G |
| Area | The gene area where the variation located | Controlled vocabulary in table5 |
| Trait | Biological traits being studied | flavone content |
| Trait Impact | The change of traits for individuals with alternative allele | Controlled vocabulary in table6 |
| Allele Impact | The impact of functional alleles (inferior, superior or other) | Controlled vocabulary in table7 |
| Causal Type | The classification of variants (causal, potential causal or other) | Controlled vocabulary in table8 |
| PMID | Publication in which the association is described | 32082354 |
| Tech ID | Genotyping Technology | Abbreviation Name |
|---|---|---|
| 1 | Whole Genome Sequencing | WGS |
| 2 | Genotyping by Sequencing | GBS |
| 3 | Genotyping by Array | Array |
| 4 | Specific-Locus Amplified Fragment Sequencing | SLAF-seq |
| 5 | Whole Exome Sequencing | WES |
| 6 | RNA Sequencing | RNA-seq |
| 7 | Restriction-site Associated DNA Sequencing | RAD-seq |
| 8 | Droplet-assisted RNA Targeting by Single-cell Sequencing | DART-seq |
| 9 | Polymerase Chain Reaction | PCR |
| 10 | Unclassified | other |
| Model ID | Model Name | Abbreviation Name |
|---|---|---|
| 1 | Mixed Linear Model | MLM |
| 2 | General Linear Model | GLM |
| 3 | Logistic Regression Model | LRM |
| 4 | Compressed Mixed Linear Model | CMLM |
| 5 | Unified Mixed Linear Model | UMLM |
| 6 | Efficient Mixed Model | EMMAX |
| 7 | Multi-Locus Mixed Model | MLMM |
| 8 | Bayesian Sparse Linear Mixed Model | BSLMM |
| 9 | Factored Spectrally Transformed Linear Mixed Model | FaST-LMM |
| 10 | Fixed and random model Circulating Probability Unification | FarmCPU |
| 11 | Joint-Linkage Model | JLM |
| 12 | Additive Inherence Model | Additive model |
| 13 | Fisher's Exact Test | Fisher's exact test |
| 14 | Least Squares Regression Model | LSR |
| 15 | Chi Square test | X² test |
| 16 | Case Control Model | Case Control Model |
| 17 | Multi-Locus Random-SNP-Effect Mixed Linear Model | mrMLM |
| 18 | Fast-Multi-Locus Random-SNP-Effect Mixed Linear Model | FASTmrEMMA |
| 19 | Unclassified | other |
| Area ID | Area Name |
|---|---|
| 1 | 3_prime_UTR |
| 2 | 5_prime_UTR |
| 3 | exon |
| 4 | intron |
| 5 | CDS |
| 6 | promoter |
| 7 | upstream |
| 8 | downstream |
| Vocabulary ID | Vocabulary Name |
|---|---|
| 1 | increasing |
| 2 | decreasing |
| 3 | early |
| 4 | delaying |
| 5 | other |
| Vocabulary ID | Vocabulary Name |
|---|---|
| 1 | inferior |
| 2 | superior |
| 3 | other |
| Vocabulary ID | Vocabulary Name |
|---|---|
| 1 | causal |
| 2 | potential causal |
2.4. Variant unifying and annotation
As the genome sequence is continuously updating, we unified the genomic lociation of variants which were collected from different publications to the latest version of the reference genome in GVM using sequence-based searching. If there are variant records in the GVM database, we use the reference identifier in VarID and redirect the user to the variant view in GVM. All variants were annotated by VEP.
2.5. Trait term annotation
To unify the representation of biological traits, trait entities are mapped to a suite of reference ontologies (PTO; ATOL) and species-specific ontology (CO) using the ‘term search’ in Planteome API and Livestock Ontologies. Since not all curated traits are included in existing ontologies, we additionally establish PPTO and APTO by integrating more comprehensive terms based on Open Biological and Biomedical Ontologies (OBO) format.
3. GWAS tools
3.1 LeadSNPFinder
For a given genomic region, there are many variants that are associated with the same phenotype. Actually, some variants are defined because of that they are genetically linked to the causal variant. Thus, we can filter some variants using the genetic linkage parameter R2. A smaller R2 value indicates that the two alleles are independent of each other.
Lead SNPs in this database has been defined using PLINK. The parameters are set as follows:
Users can calculate lead SNPs with their own GWAS summary data using the LeadSNPFinder tool.
3.2 GeneFinder
Based on GWAS summary data, the MAGMA tool is used to compute gene-based P-values (gene analysis) with default parameters. Before this, SNPs need to be mapped to genes.
Users can find gene-phenotype associations using the GeneFinder tool.
4. Data search
In the 'Search' module, we support user to query term keywords (e.g. height), gene ID (e.g. Zm00001d021954), and genomic location (e.g. chr1:14702150-37601000). The related traits, genes, and variants, and all eligible search results will be listed.
5. Data download
If you are interested in the associations of a species, please visit the 'Download' page, which includes associations for each specie stored in text format (.txt and .xlsx). Our customized ontologies including PPTO and APTO were also available in obo format.
6. Data submission
GWAS Atlas is equipped with a submission platform for GWAS studies or summaries, allowing users to perform data submission.
7. Support
7.1. Funding Support
- Strategic Priority Research Program of Chinese Academy of Sciences (XDA08020102)
- The 13th Five-year Informatization Plan of Chinese Academy of Sciences (XXH13505-05)
- The Youth Innovation Promotion Association of Chinese Academy of Sciences (2018134)
7.2. Comments & Collaborations
We look forward to worldwide comments, suggestions and guidance from colleagues and peers with common research interests. We also invite the scientific community to submit their analysis results of GWAS to GWAS Atlas and to build collaborations in improving the functionalities of GWAS Atlas.
7.3. FeedBack
We would love to hear from you for any questions or comments. Please find our contact information here.
- Data Curation Xiaonan Liu, Dongmei Tian, Cuiping Li, Zhonghuang Wang, Rongqin Zhang, Yi Wang, Yitong Pan, Pei Wang, Shuhui Song
- Web Development Dongmei Tian, Bixia Tang, Dong Zou, Xufei Teng
- Principal Investigator Shuhui Song, Zhang Zhang
Fax: +86 (10) 8409-7298
Email: gwas@big.ac.cn
Postal Address:
The GWAS Team, National Genomics Data Center, Beijing Institute of Genomics (BIG), Chinese Academy of Sciences (CAS)
NO 1 Beichen West Road, Chaoyang District, Beijing 100101, China