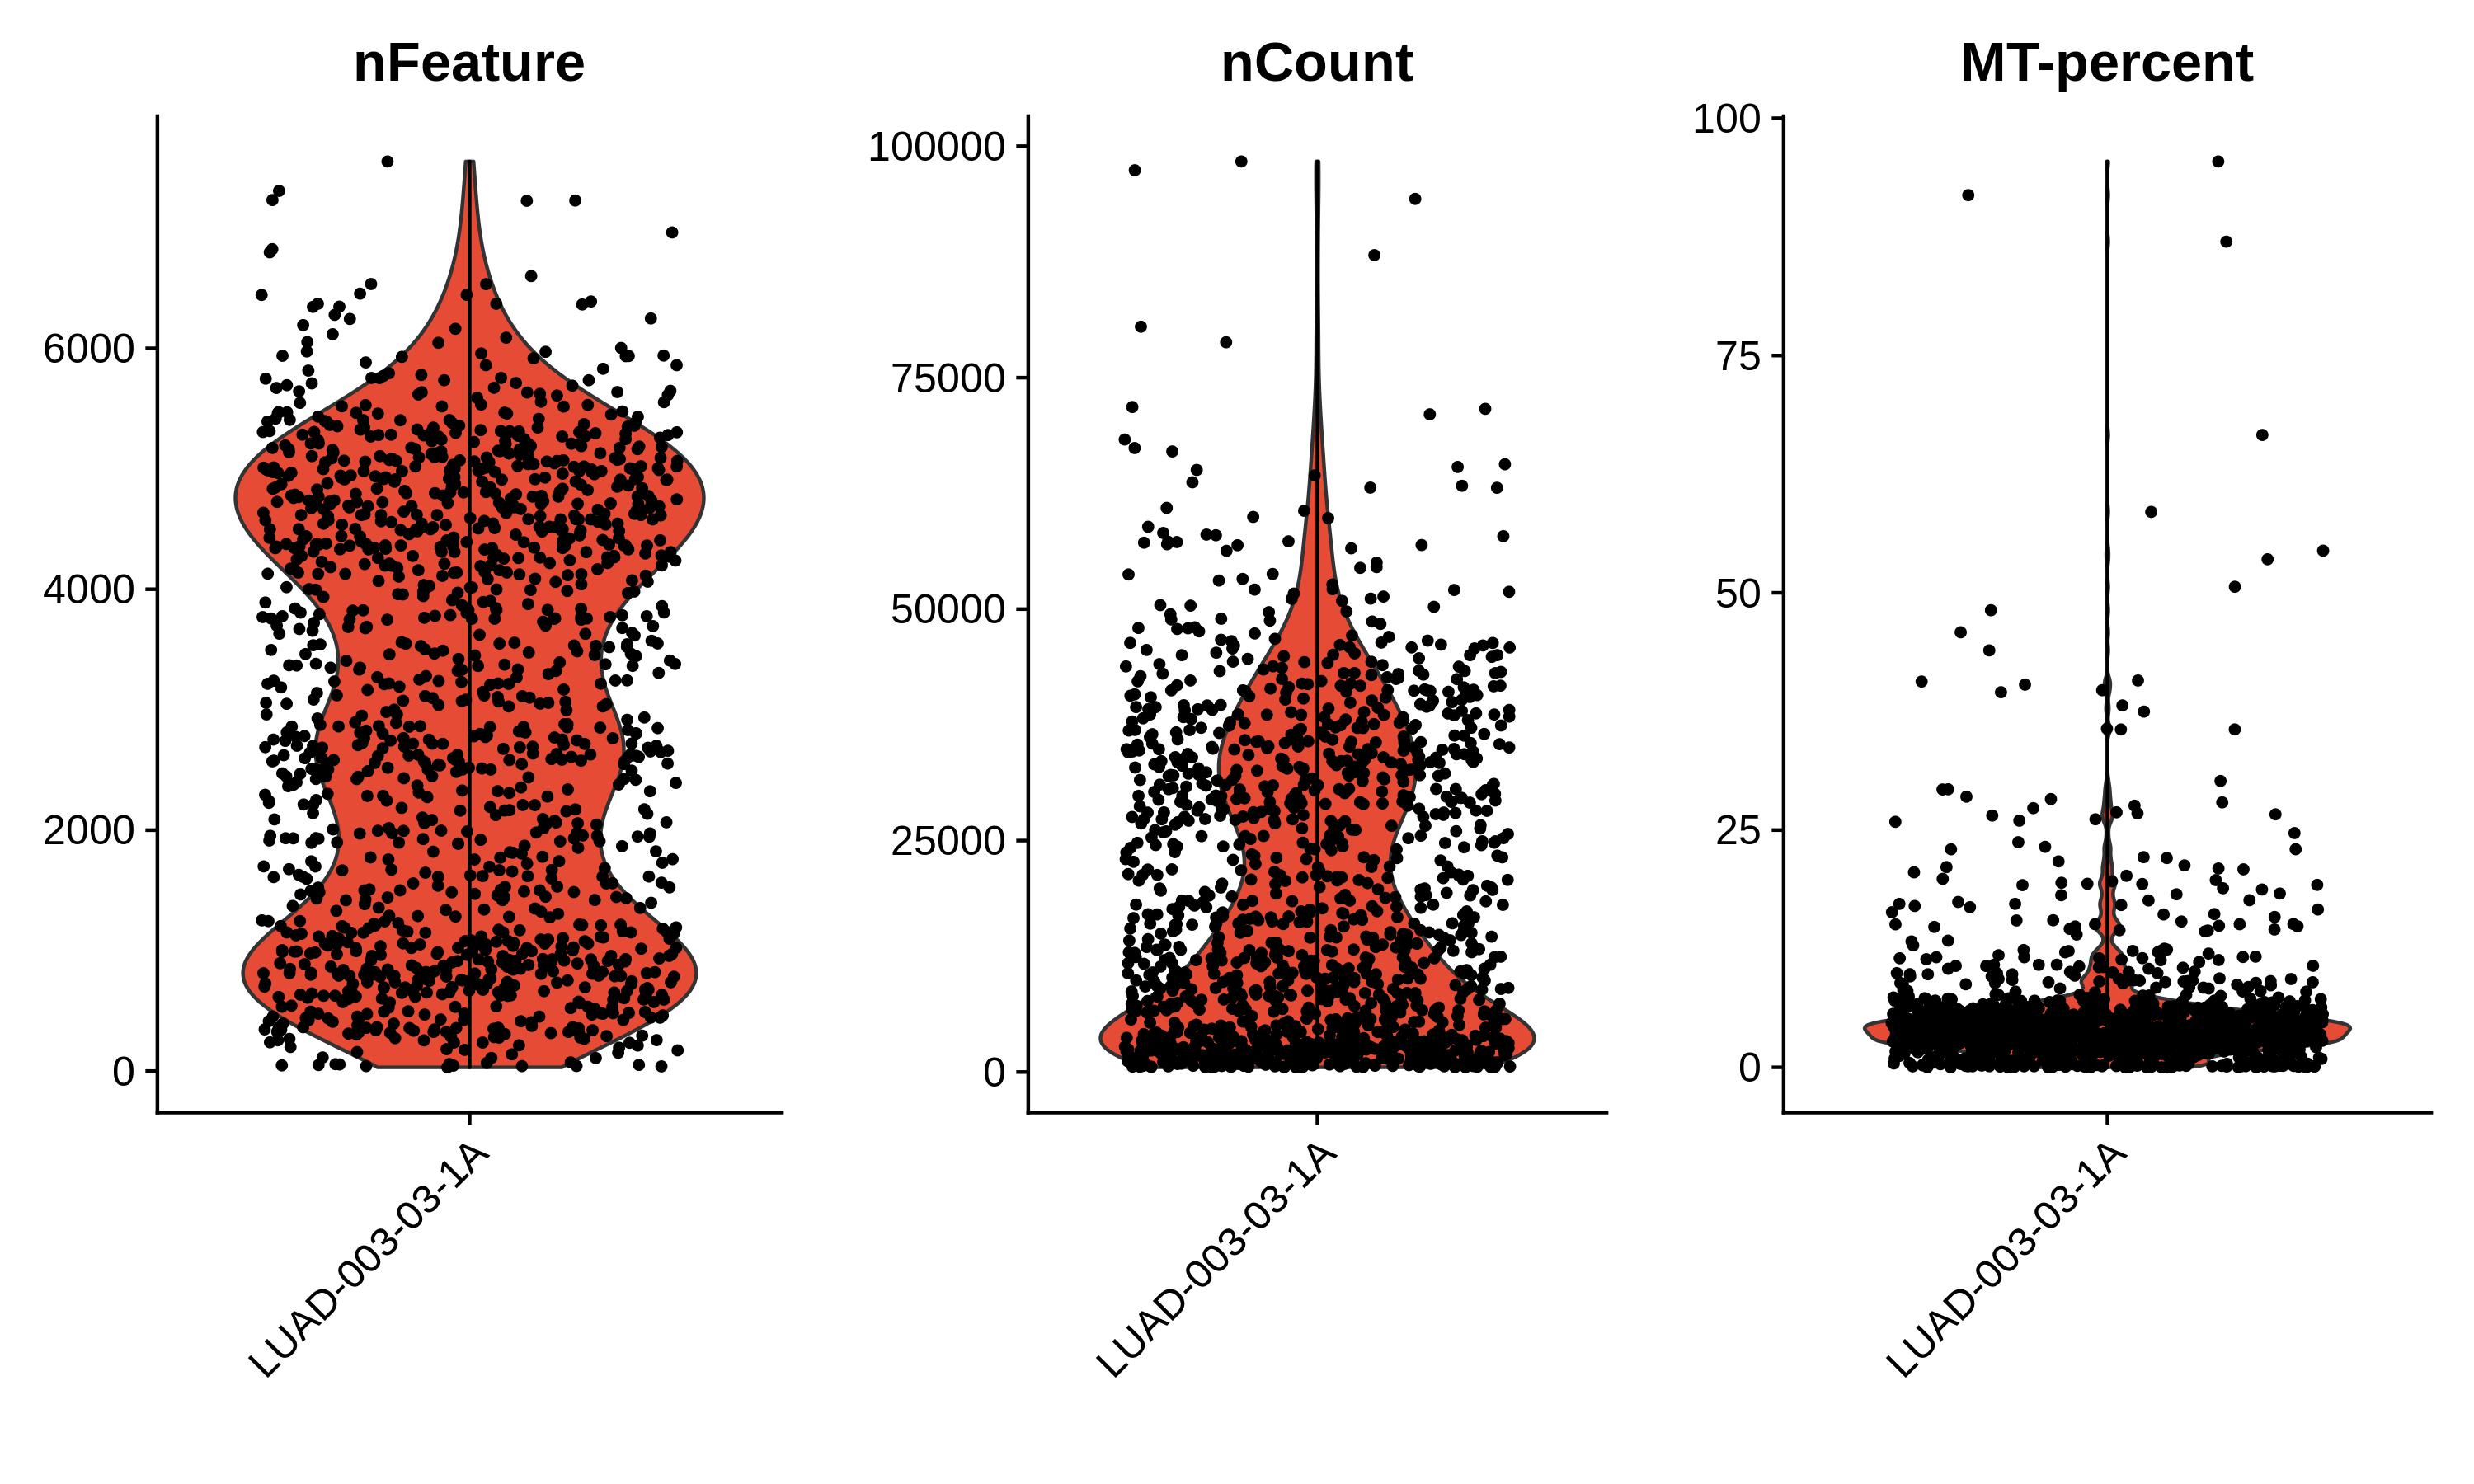
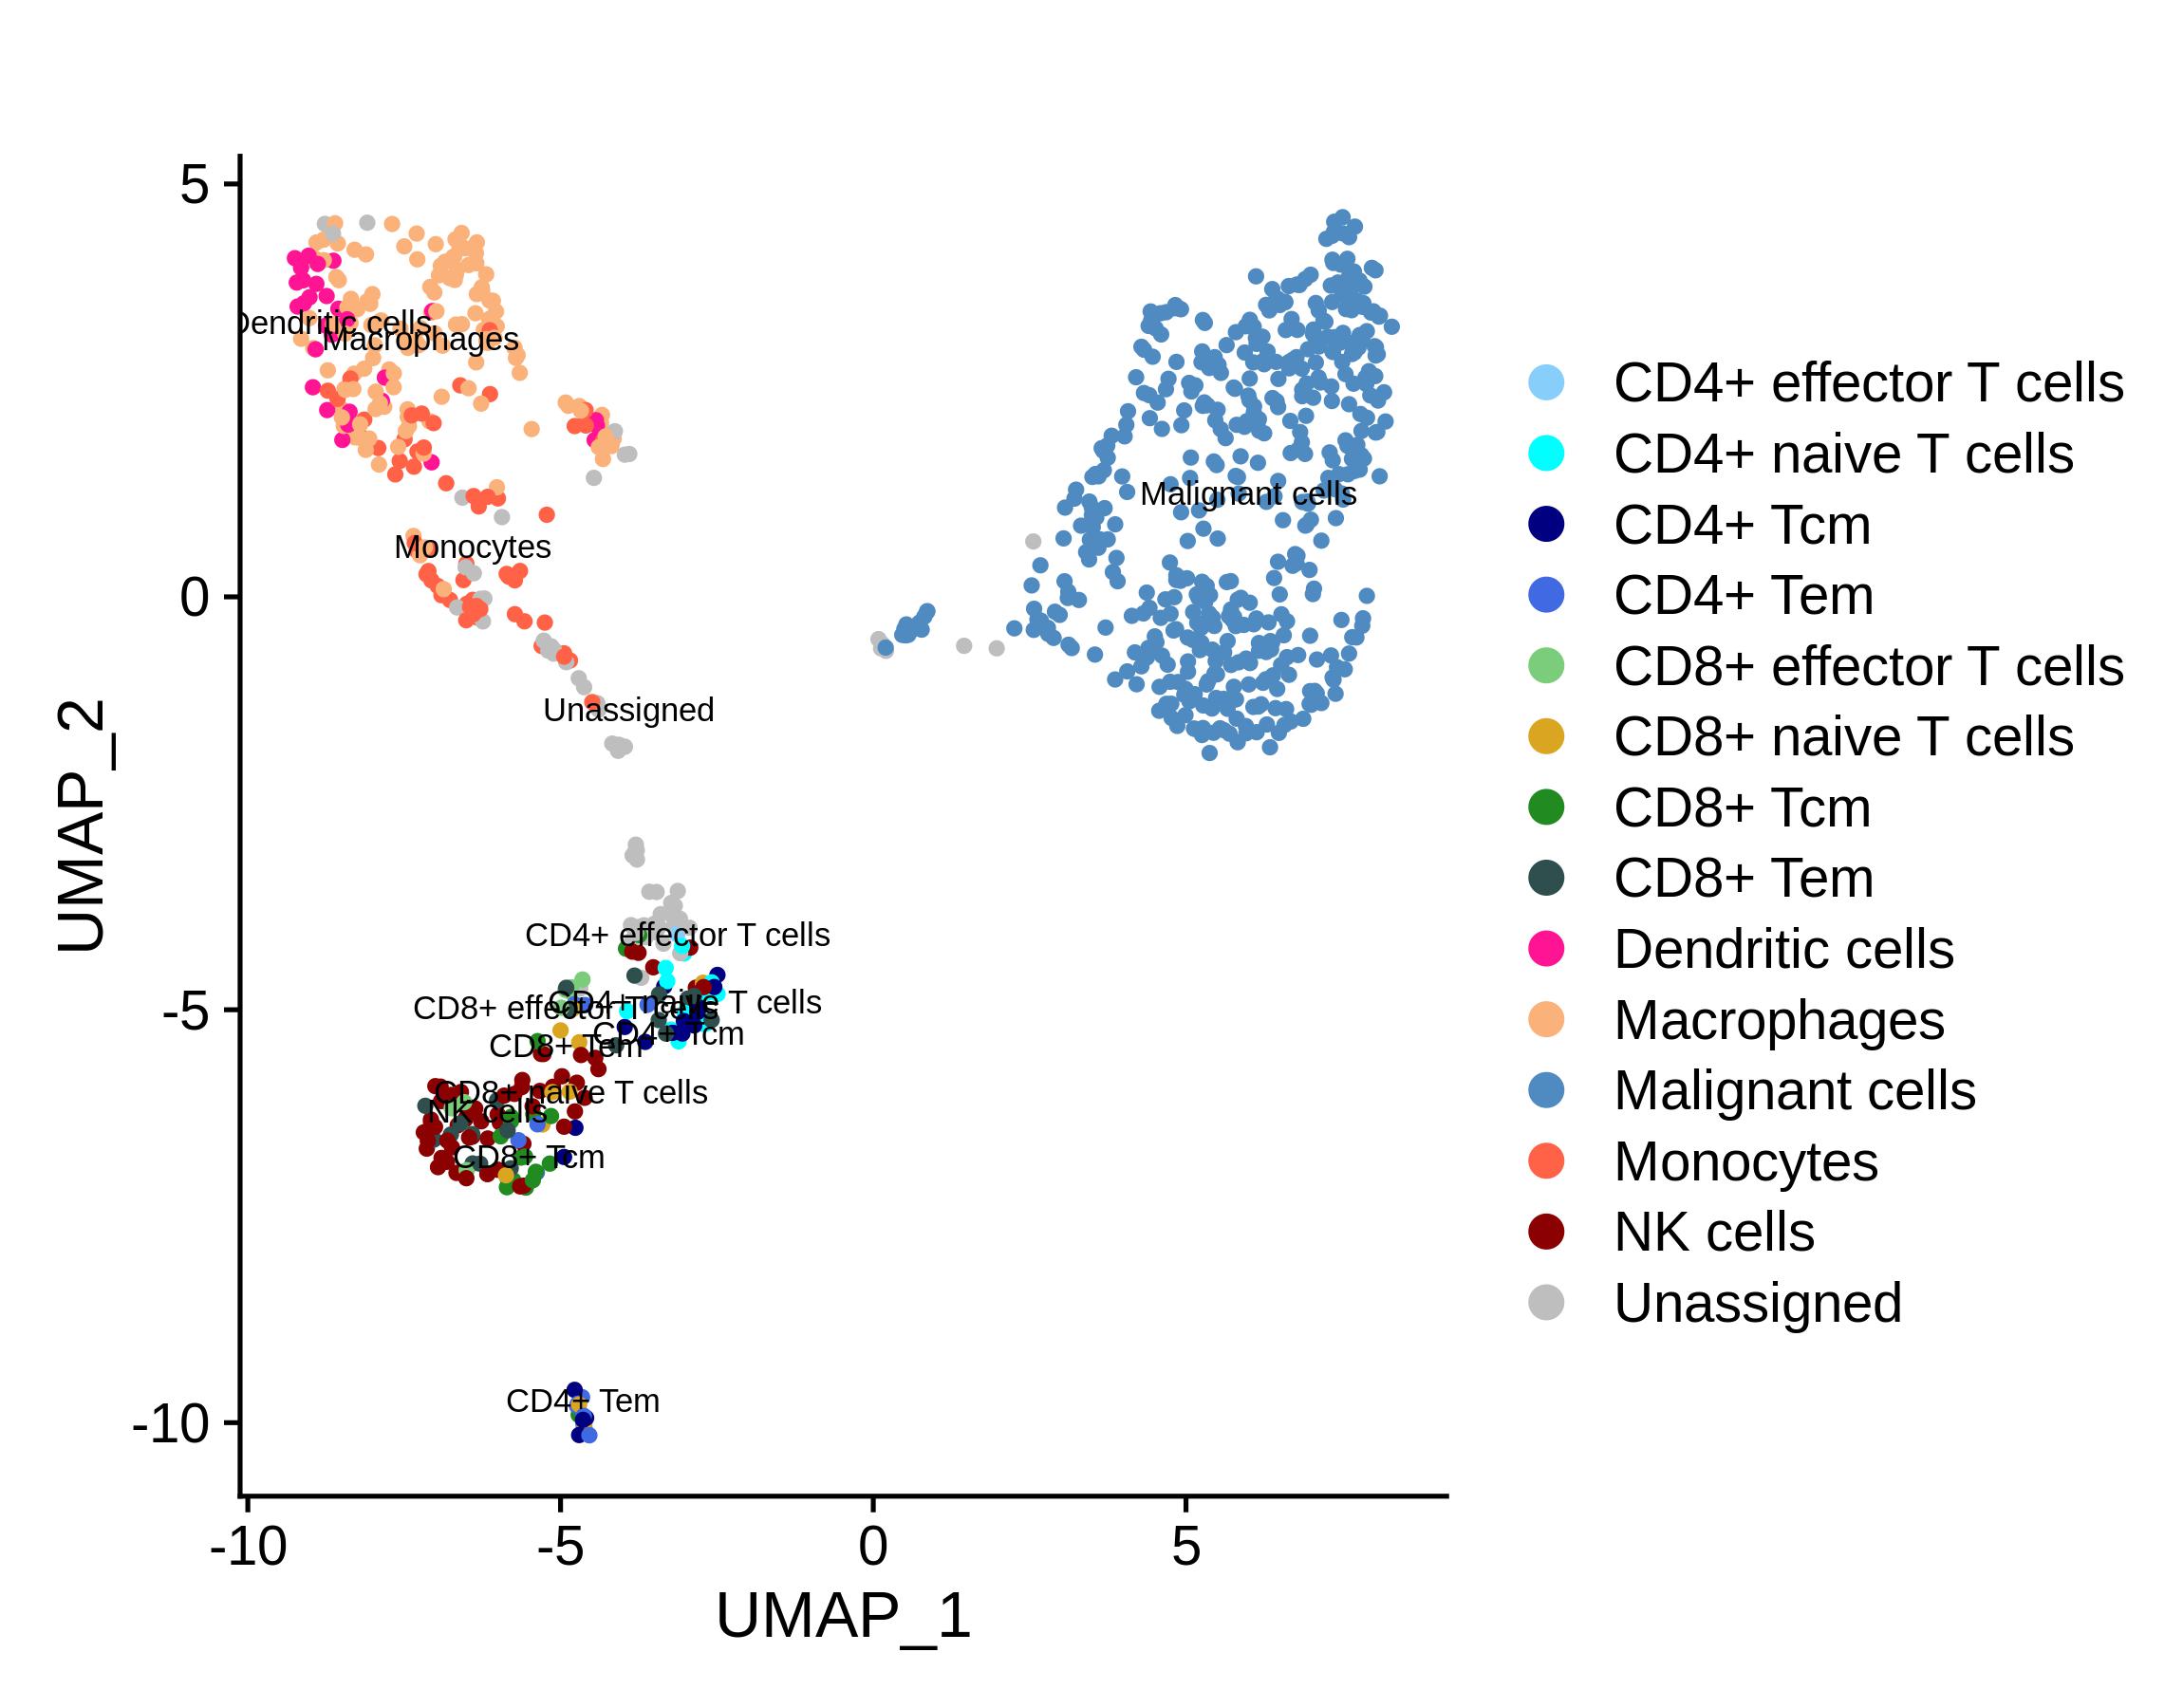
The dataset included a total of 945 cells, the parameters adopted were as follows: resolution=1, PCs=1:20, MT<10%.
| Subtype | Cell Count | Percentage |
|---|---|---|
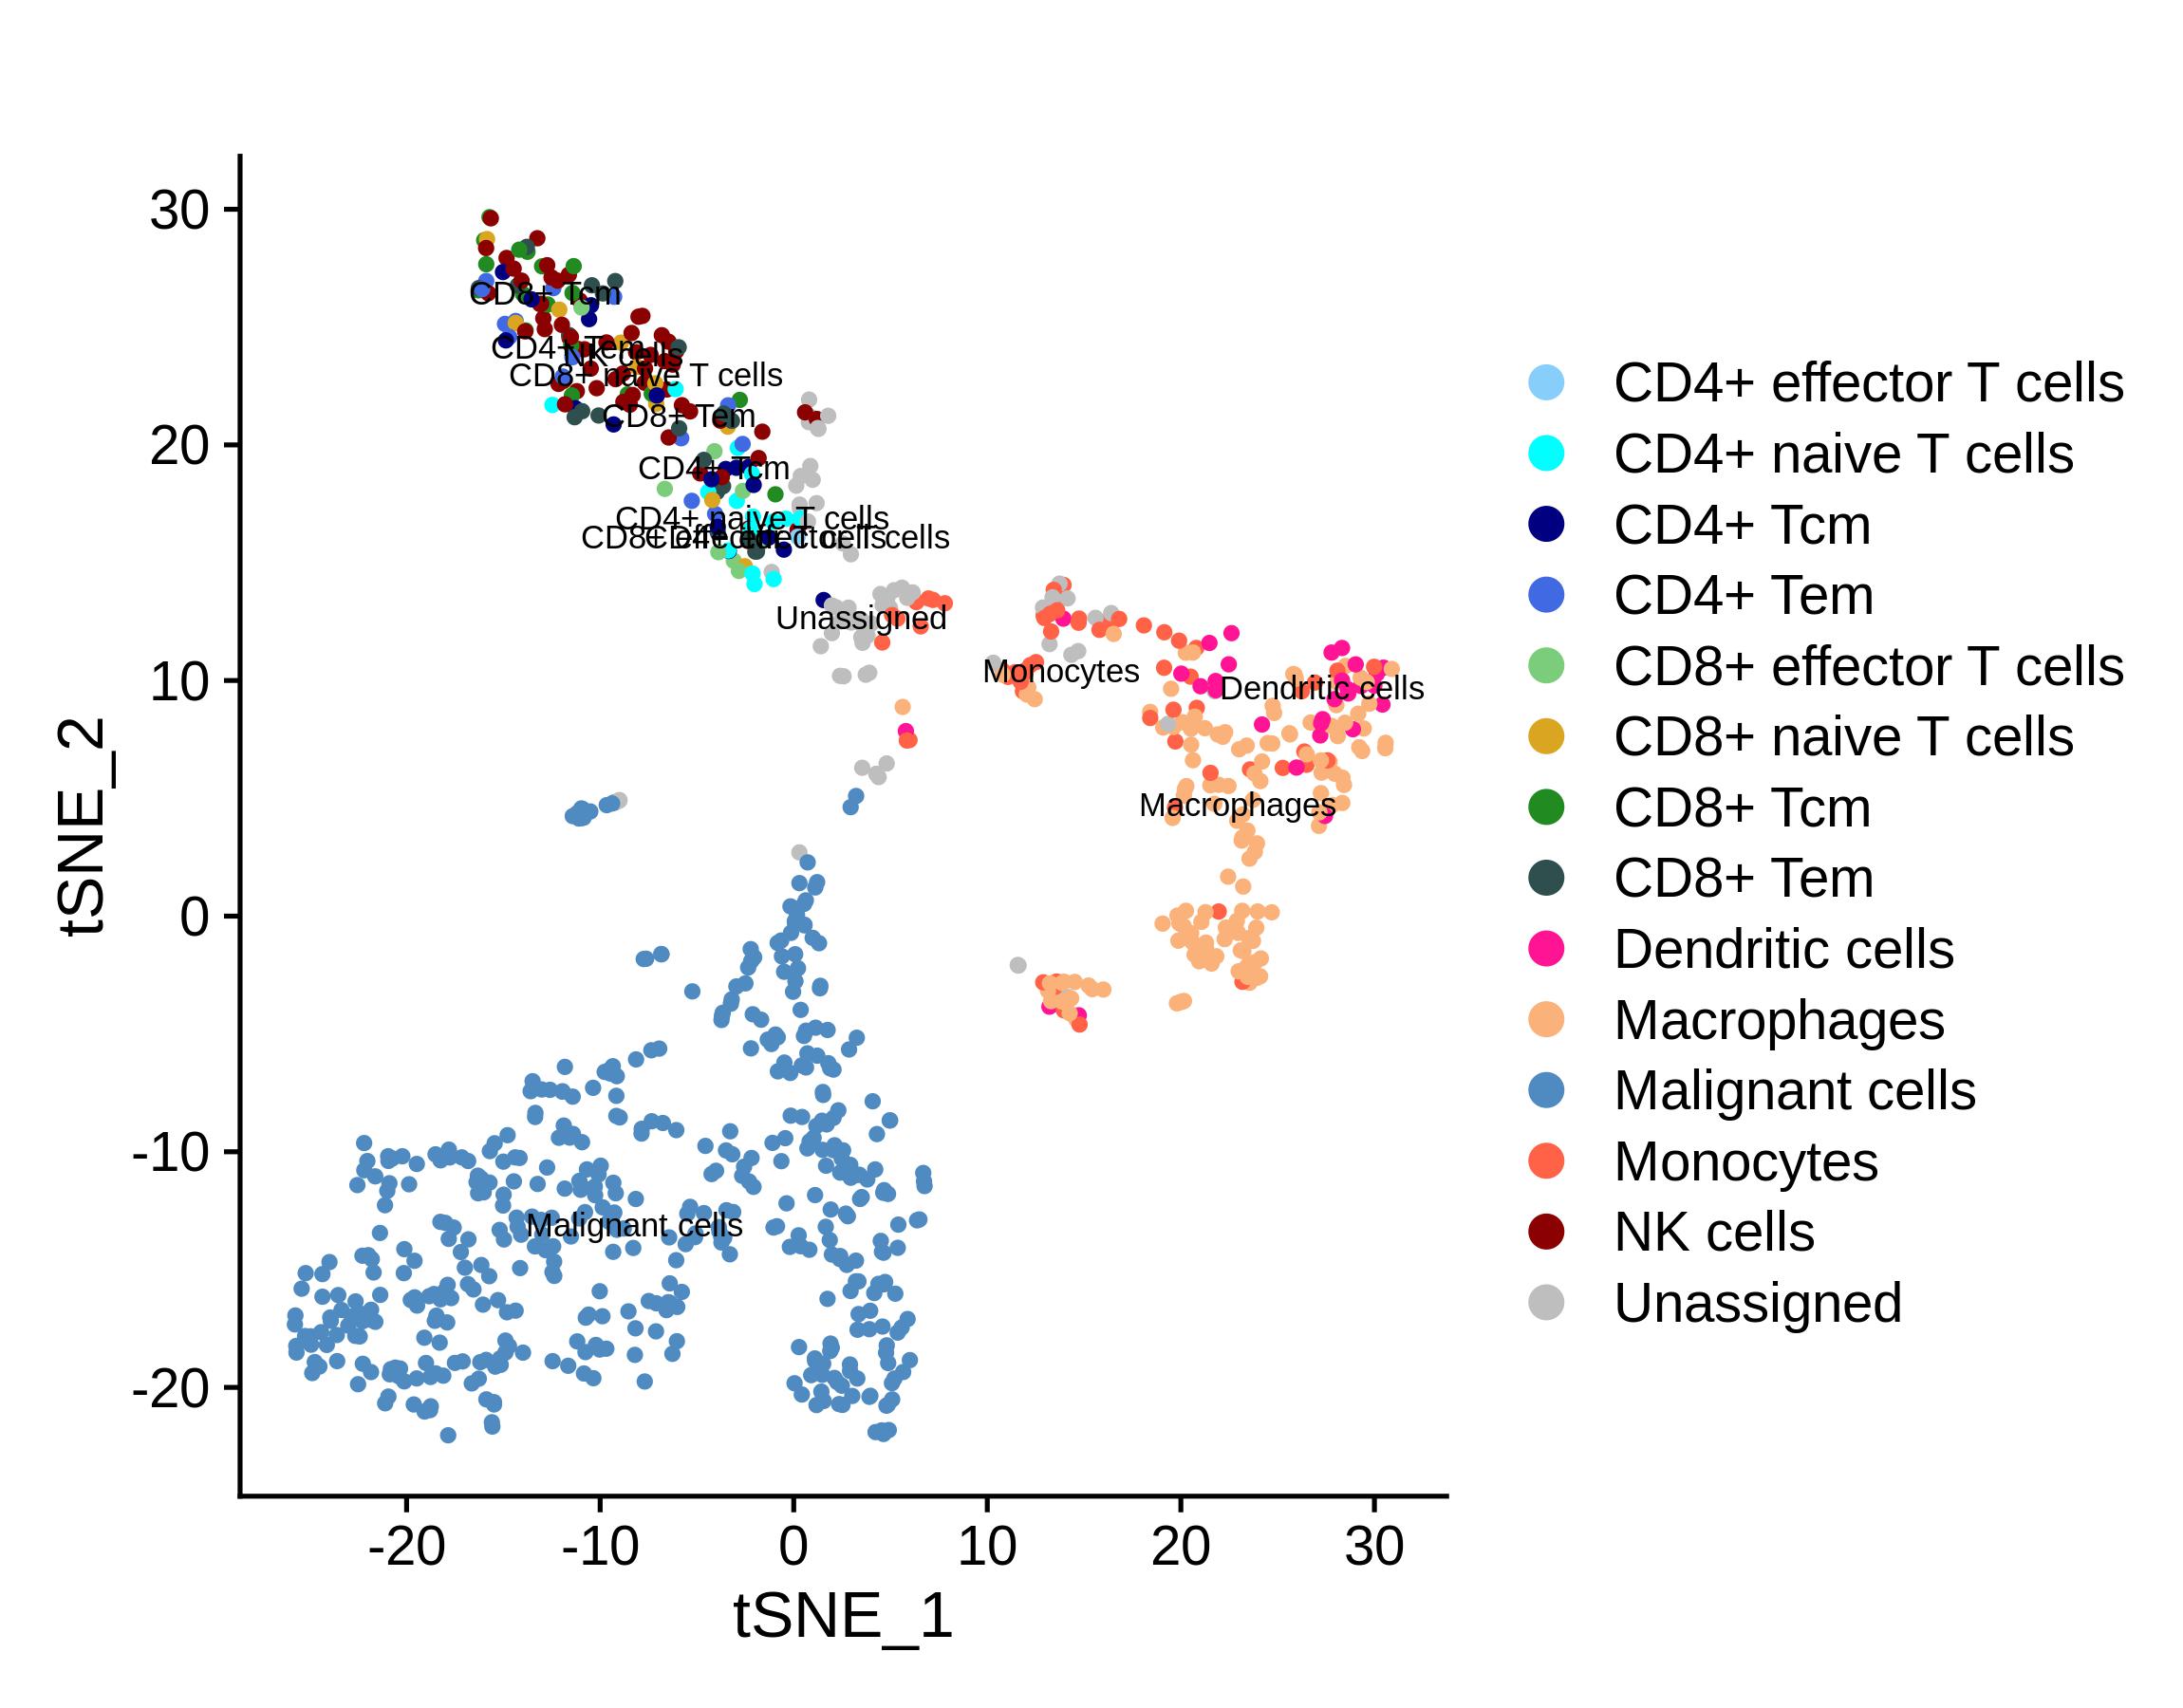
| Malignant cells | 476 | 50.370% |
| CD4+ naive T cells | 15 | 1.590% |
| CD4+ effector T cells | 1 | 0.110% |
| CD4+ Tcm | 18 | 1.900% |
| CD4+ Tem | 14 | 1.480% |
| CD8+ naive T cells | 10 | 1.060% |
| CD8+ effector T cells | 9 | 0.950% |
| CD8+ Tcm | 18 | 1.900% |
| CD8+ Tem | 21 | 2.220% |
| NK cells | 61 | 6.460% |
| Macrophages | 139 | 14.710% |
| Monocytes | 64 | 6.770% |
| Dendritic cells | 30 | 3.170% |
| Unassigned | 69 | 7.300% |
Gene Symbol | Avg_logFC | Pct.1 | Pct.2 | p-value | adj_pvalue |
|---|---|---|---|---|---|
| CCR7 | 1.74 | 0.533 | 0.032 | 1.634e-22 | 2.910e-18 |
| PRKCQ-AS1 | 1.27 | 0.533 | 0.039 | 4.528e-20 | 8.065e-16 |
| IL7R | 2.05 | 0.933 | 0.16 | 3.029e-18 | 5.395e-14 |
| CD27 | 0.69 | 0.4 | 0.024 | 4.108e-17 | 7.317e-13 |
| SELL | 0.95 | 0.467 | 0.035 | 9.442e-17 | 1.681e-12 |
| TXK | 0.89 | 0.267 | 0.012 | 2.941e-15 | 5.239e-11 |
| SCML4 | 0.94 | 0.267 | 0.013 | 4.052e-14 | 7.218e-10 |
| MAL | 0.90 | 0.267 | 0.014 | 2.424e-13 | 4.319e-09 |
| TRAT1 | 0.43 | 0.267 | 0.014 | 5.219e-13 | 9.297e-09 |
| S1PR1 | 0.80 | 0.267 | 0.015 | 1.226e-12 | 2.184e-08 |
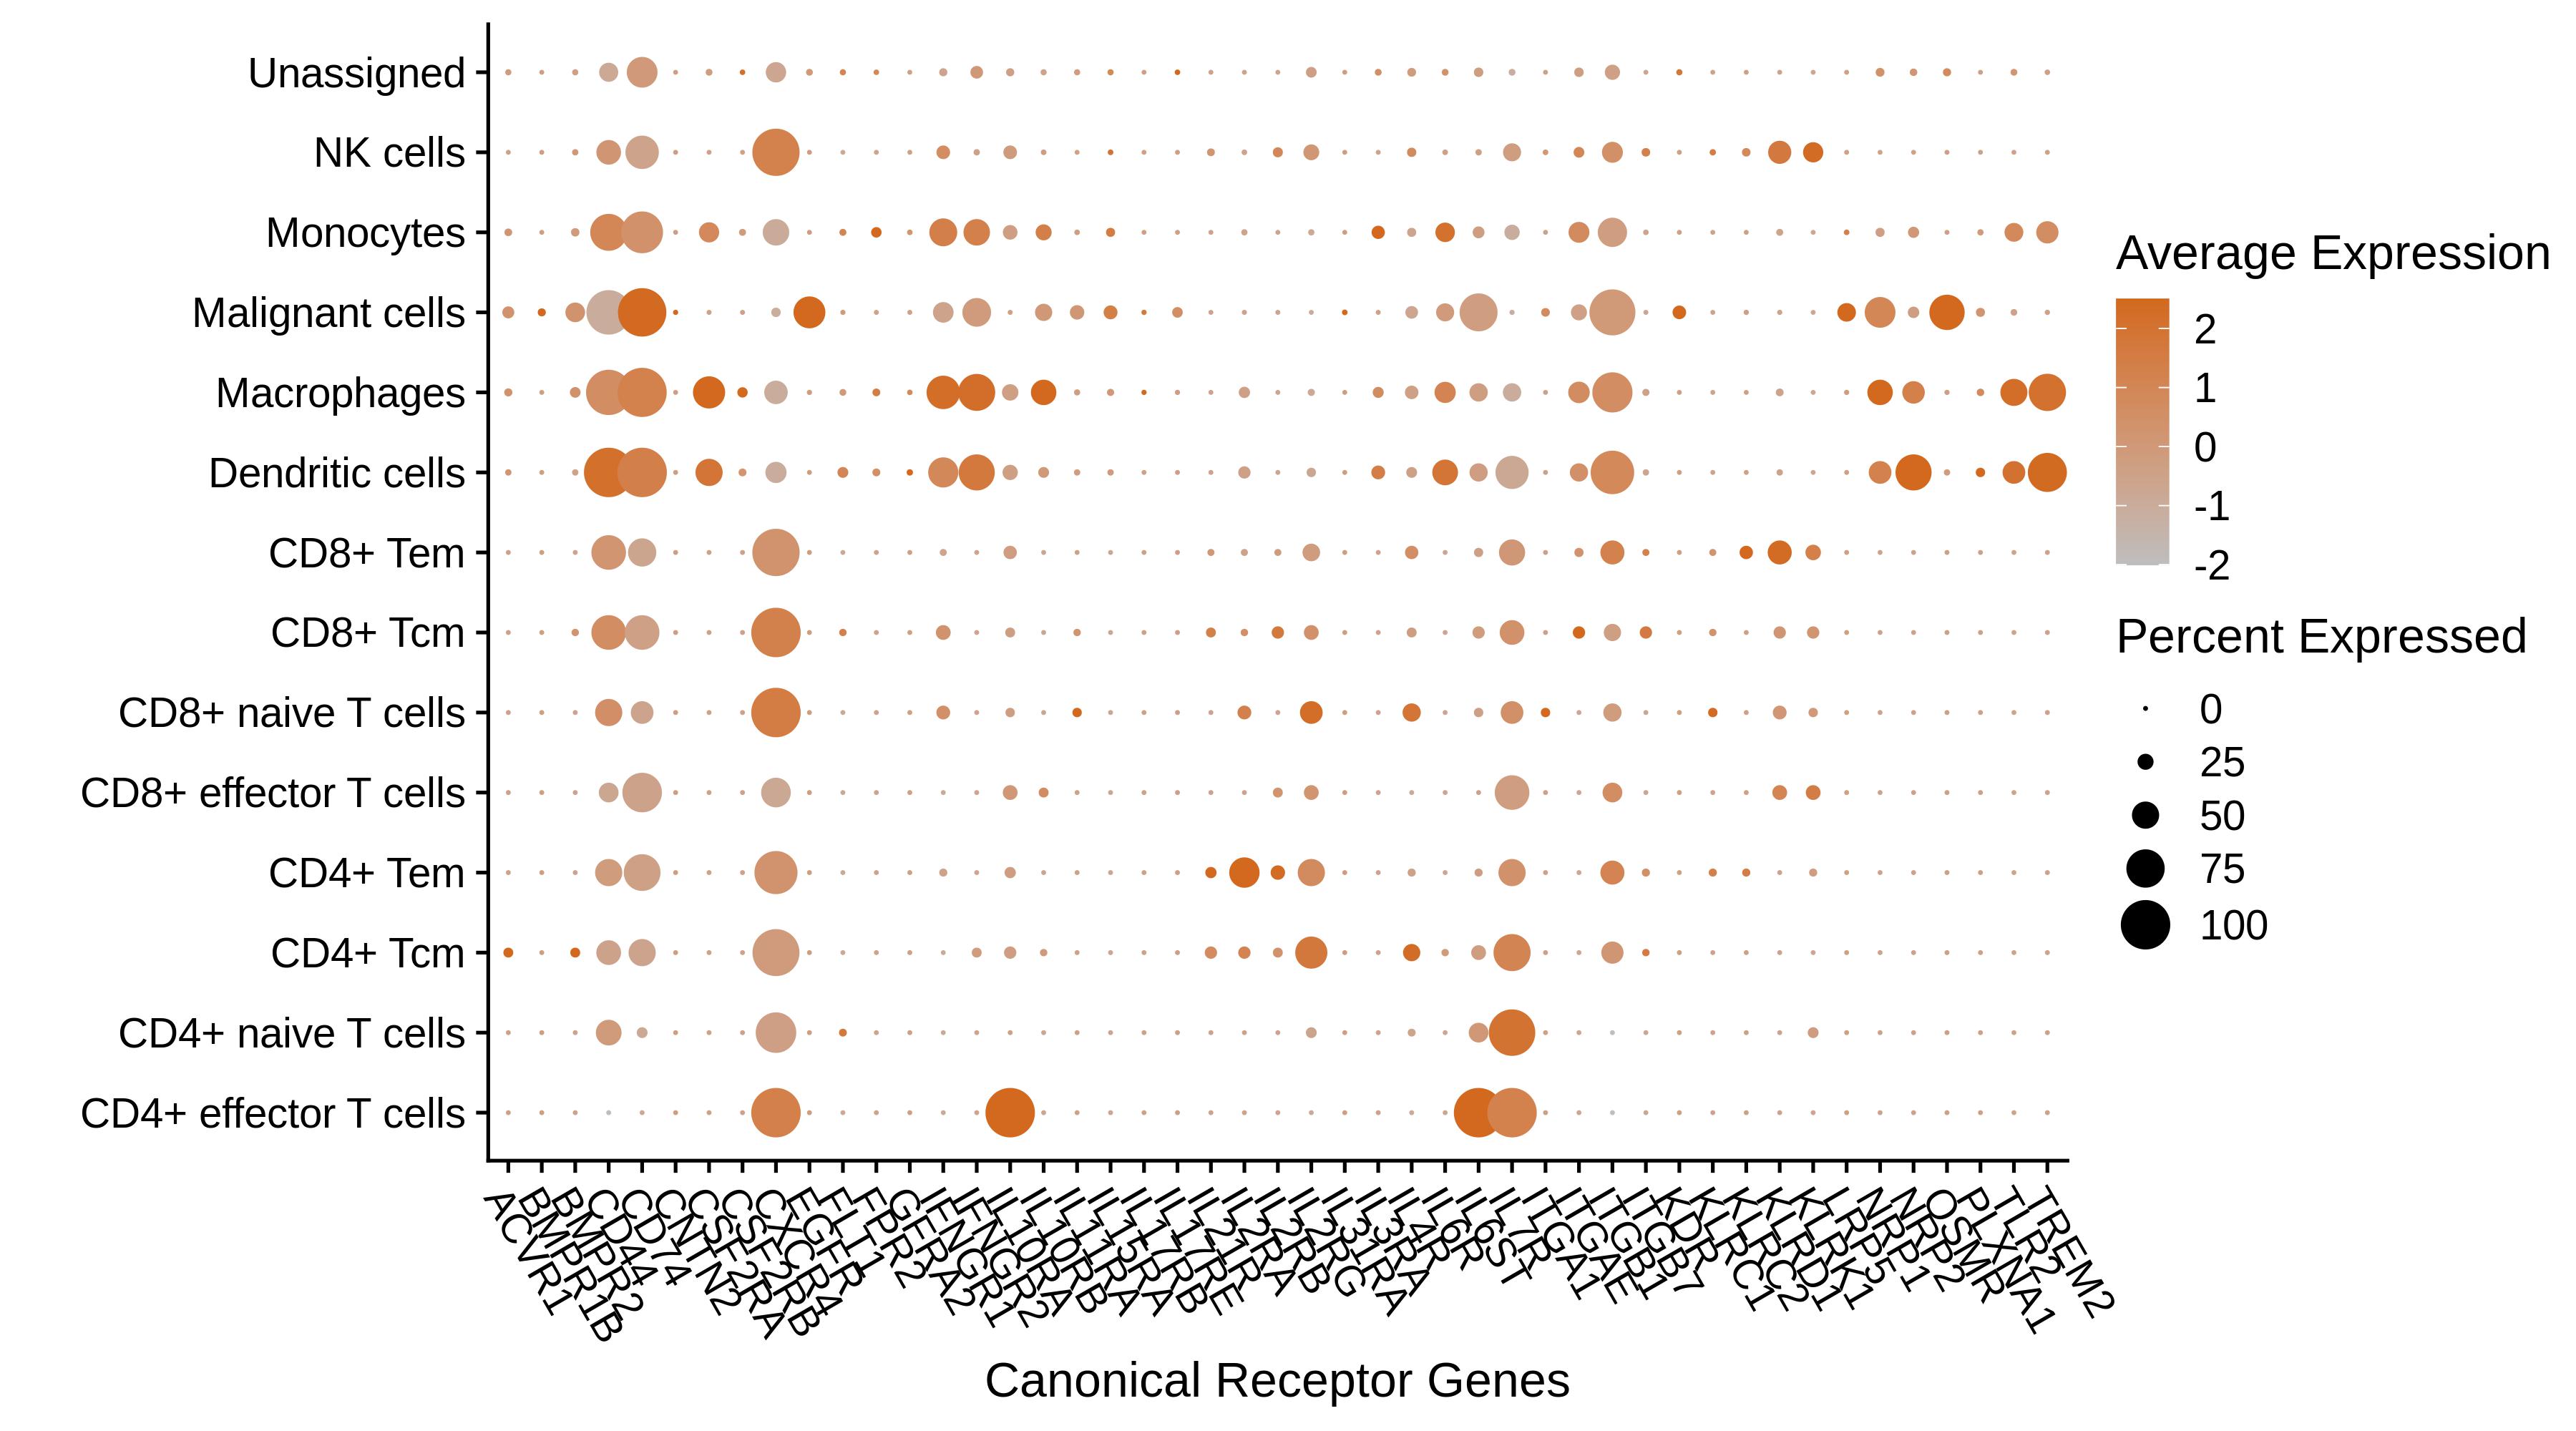
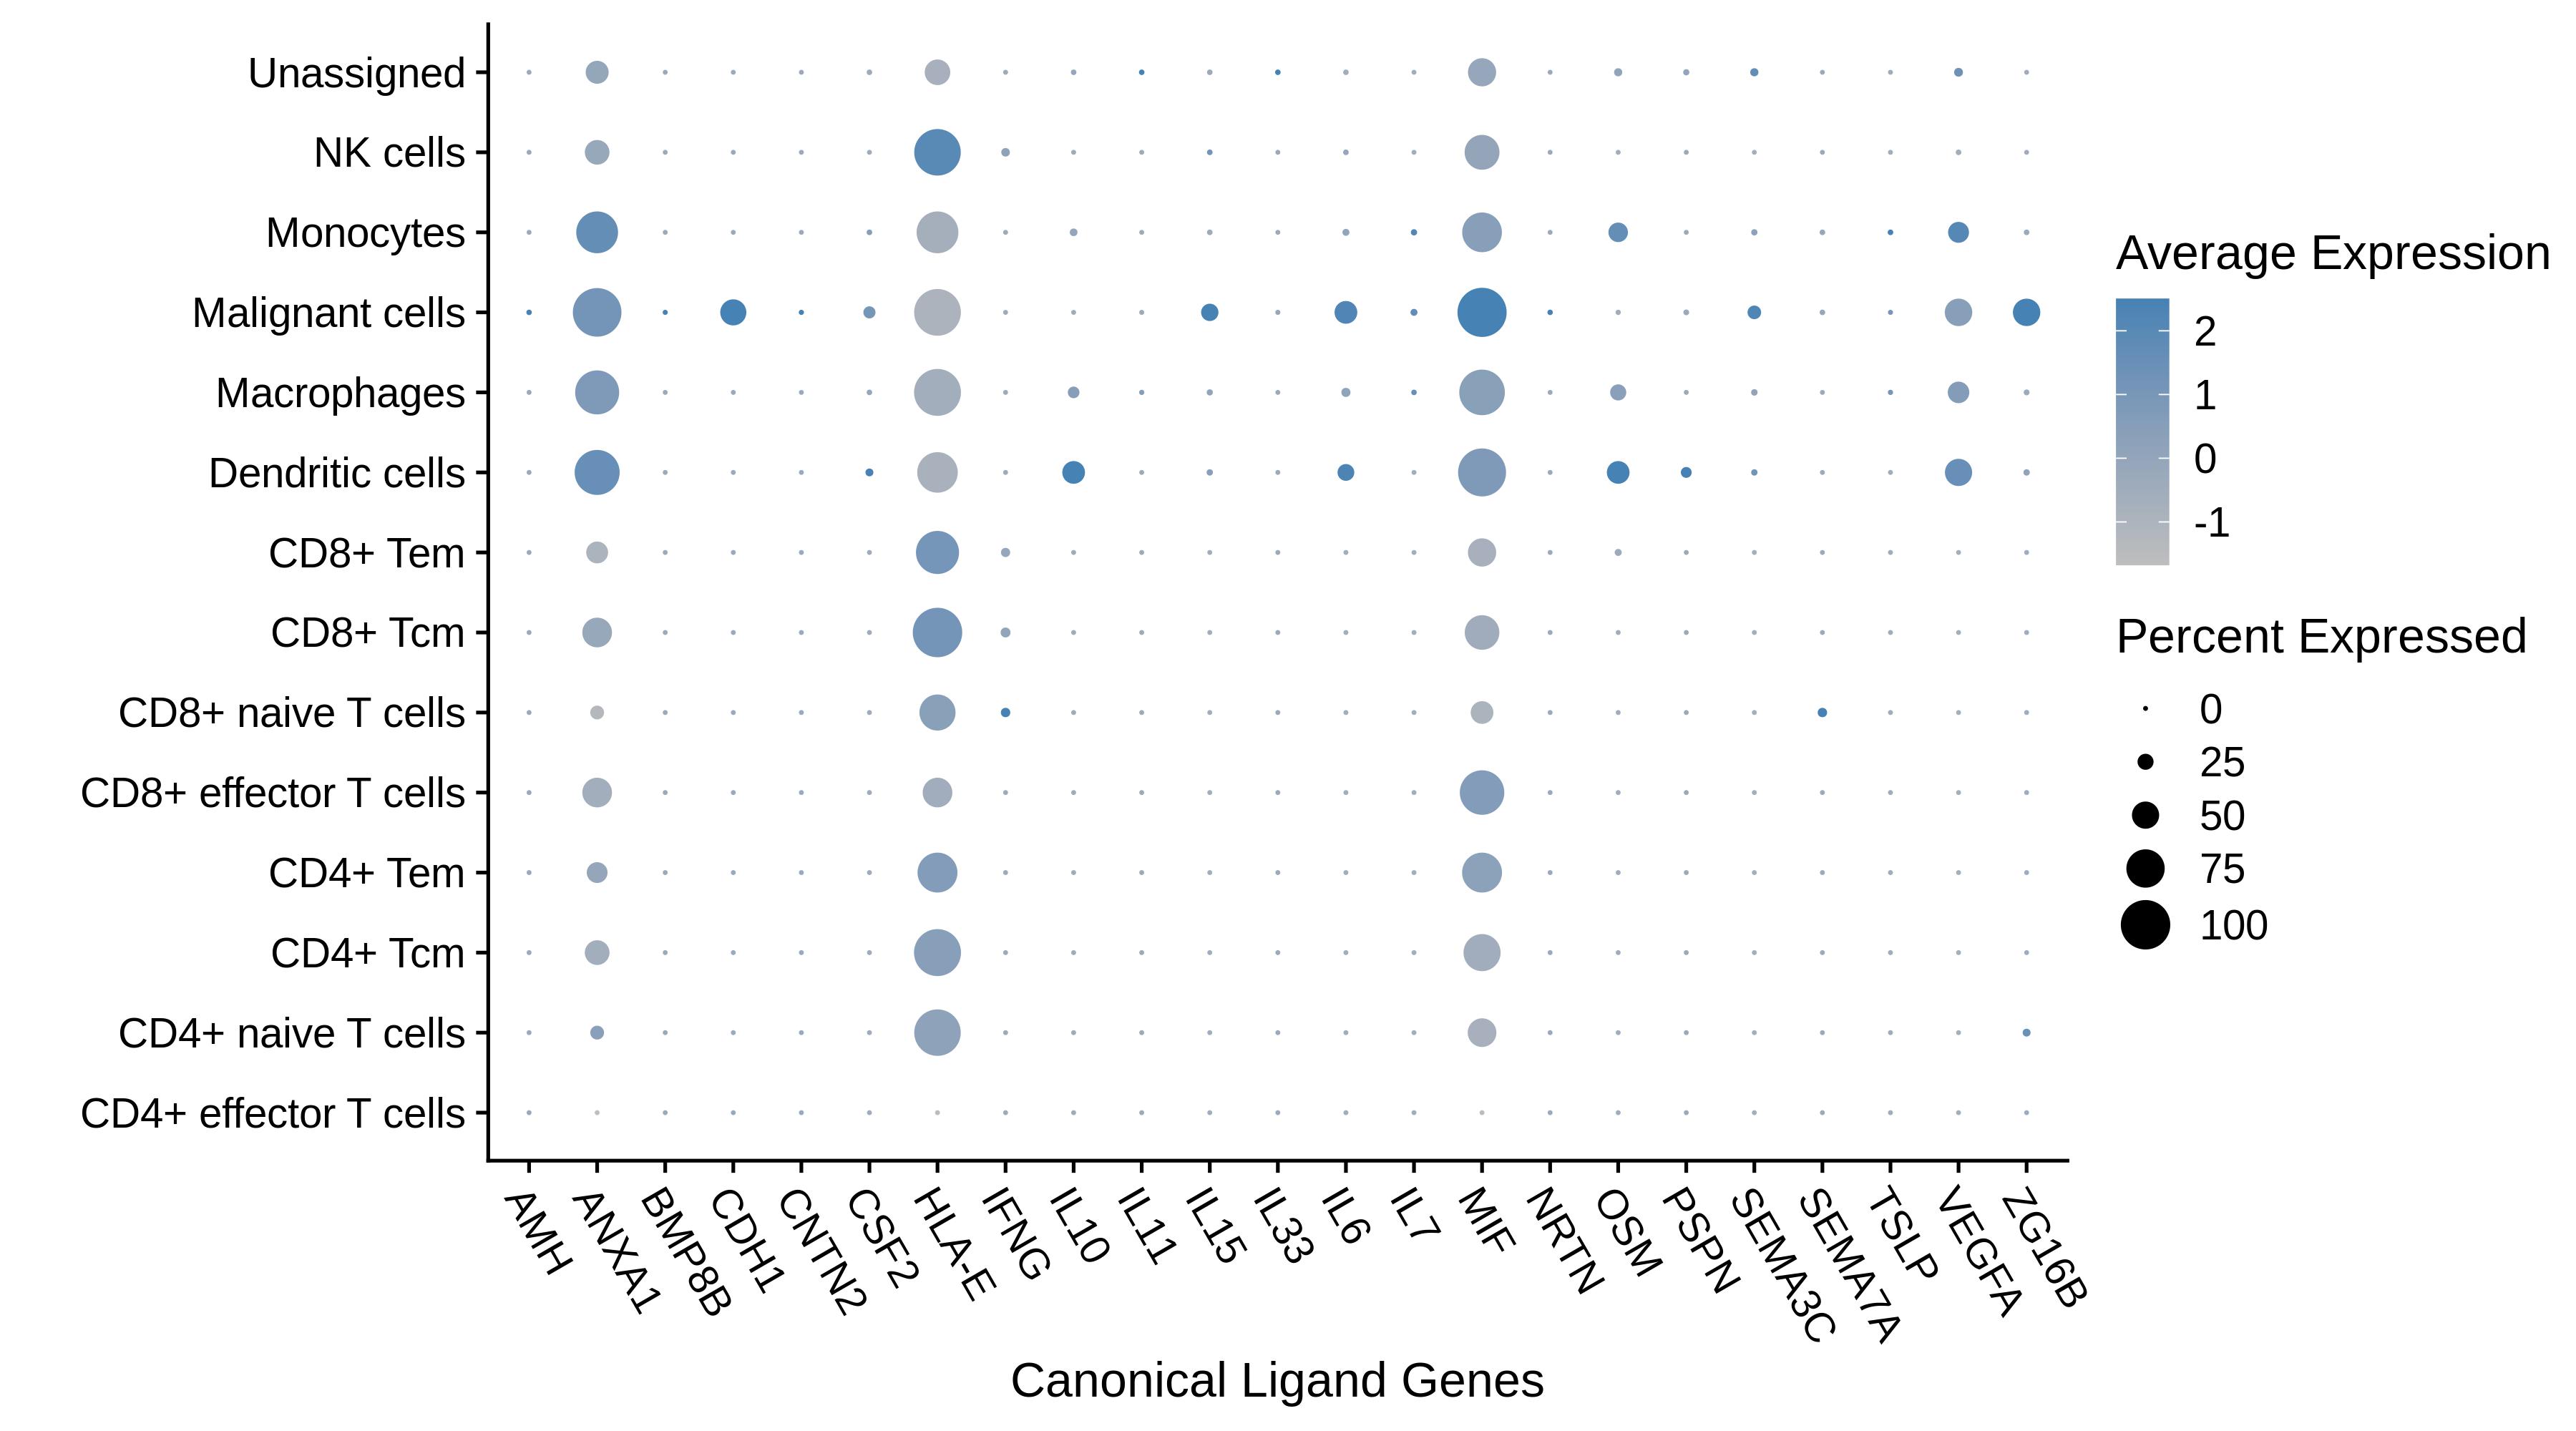
Receptor genes and their paired ligand genes were collected from CelltalkDB, SingleCellSingalR, Cellinker, Cell-Cell Interaction Database and Armingol E, et al., 2021. The following figures only demonstrated the expression of receptor genes and ligand genes supported by three or more databases or other sources, and the corresponding relationship between ligands and receptors were shown in the following table.
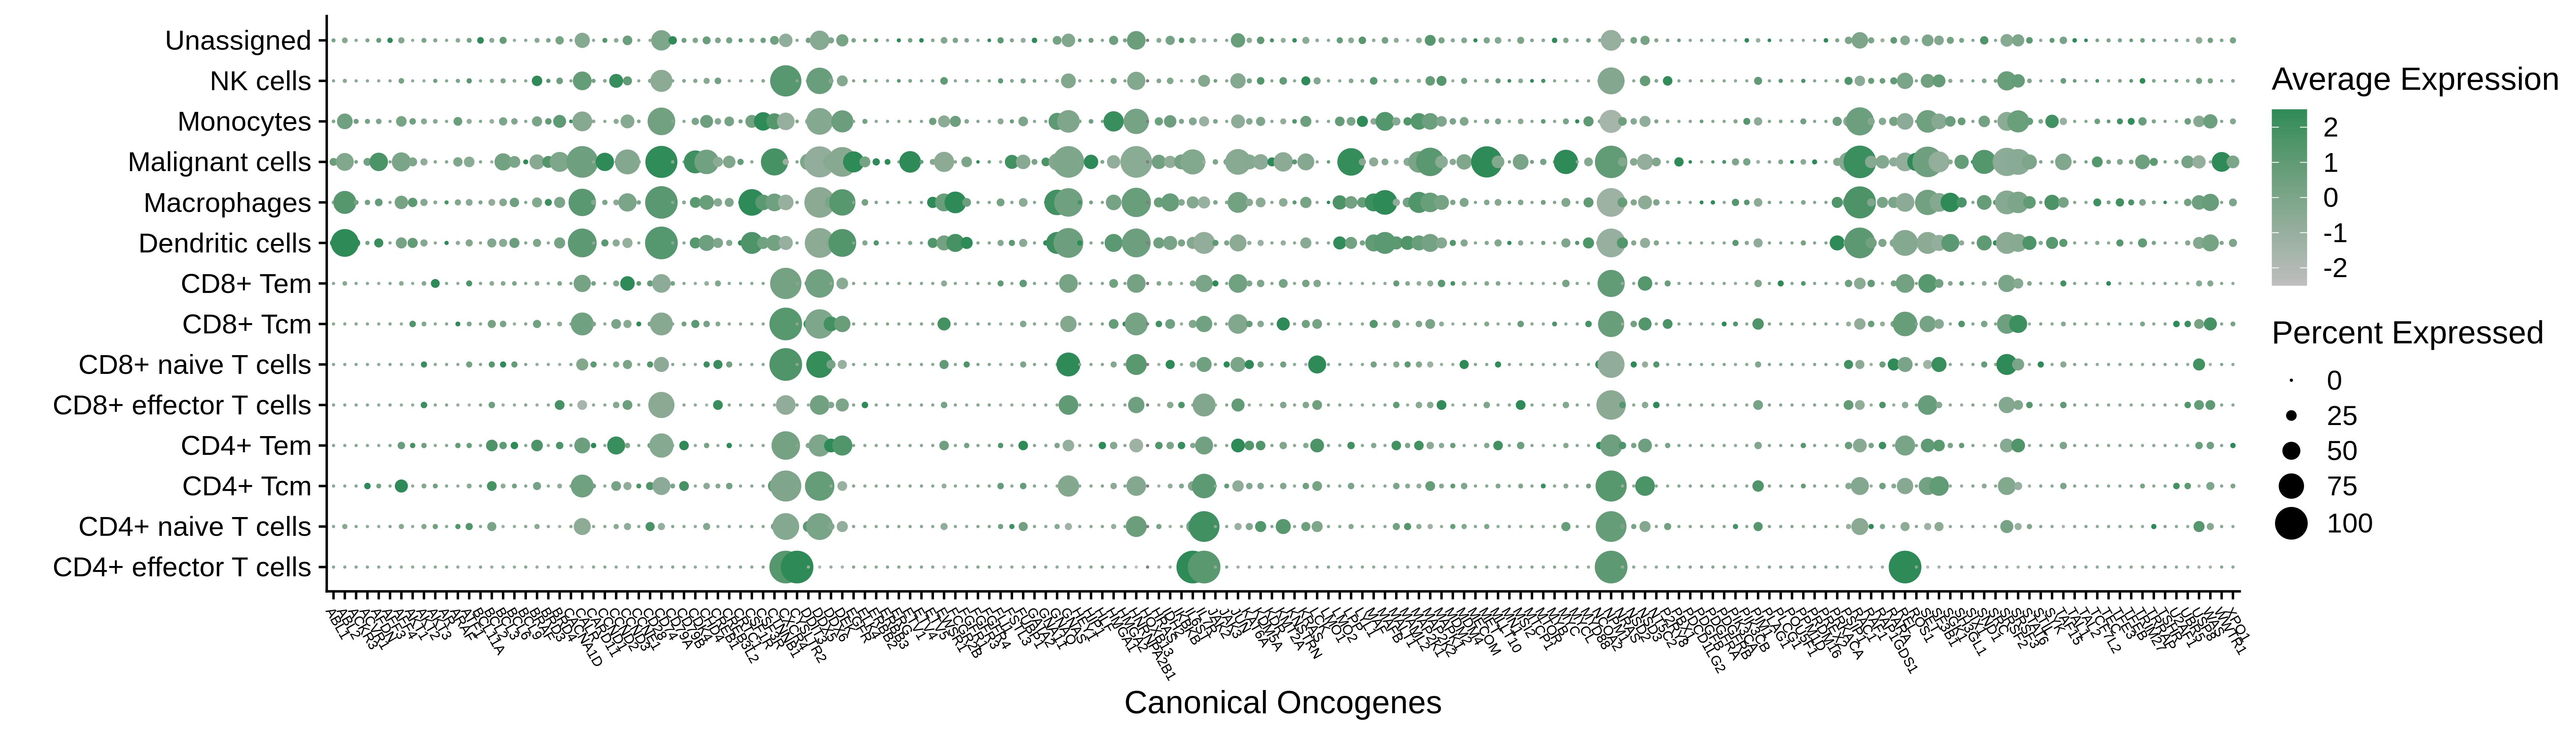
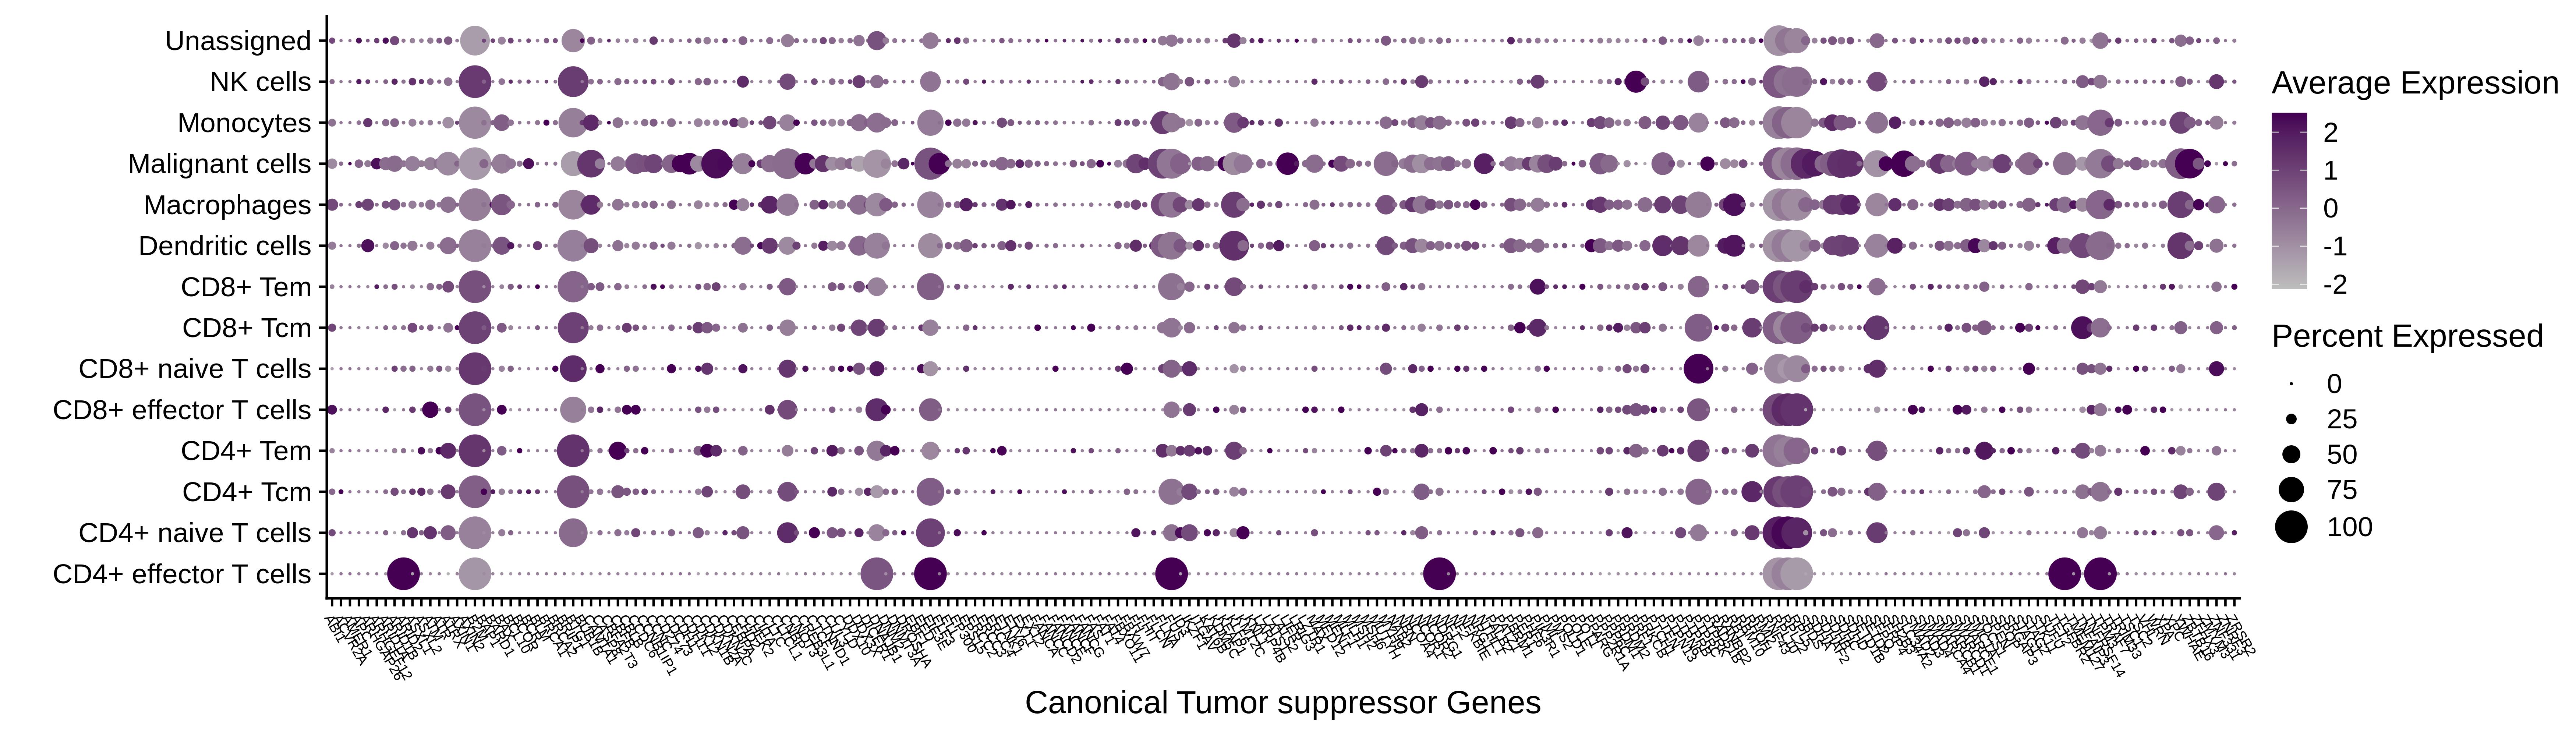
Oncogenes and tumor suppressor genes (TSGs) were collected from Cancer Gene Census (CGC), OncoKB, Network of Cancer Genes (NCG), TSGene, IntOGene and Volkan Okur and Wendy K. Chung, 2017. The following figures only displayed the expression of oncogenes and TSGs supported by three or more databases or other sources.