Gene Expression Nebulas,GEN 是一个基因表达谱数据门户,收录了完全基于多物种 RNA-Seq 数据分析获得的不同条件下的基因表达谱,旨在服务于广泛开展功能基因组学研究的科研群体。作为第一阶段,GEN-1.0 通过基于本体的系统整合方式,汇集来自 NGDC、NCBI 和 EBI 的 RNA 测序数据,为多个物种提供全面的转录组和转录后组学图谱。GEN-1.0 提供易用的界面,并通过浏览、搜索、分析、可视化和下载等功能,帮助用户访问、展示并进一步挖掘经过整理的基因表达数据。
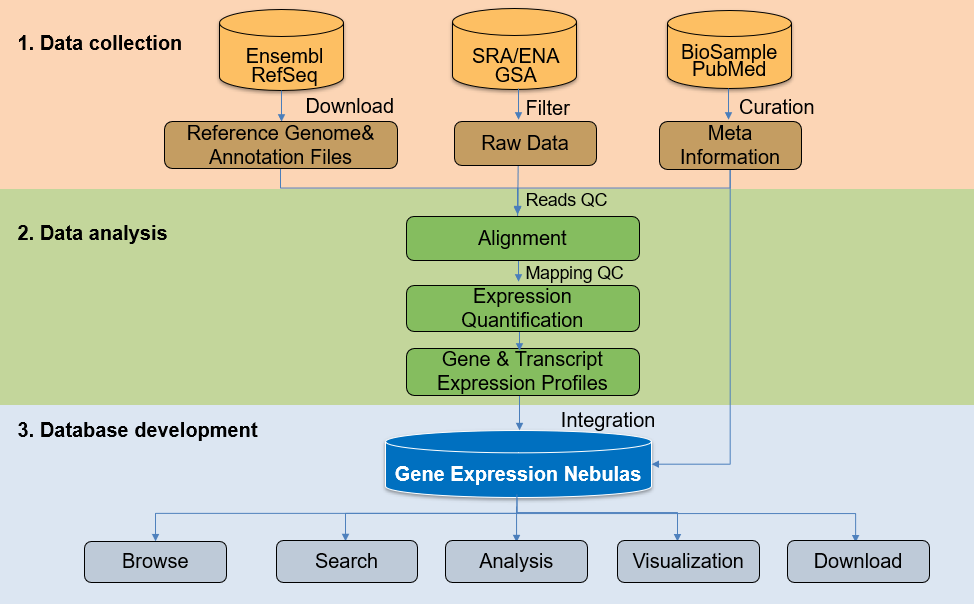
从 GSA、SRA 和 ENA 等数据资源库中获取 bulk RNA-seq 和单细胞 RNA-seq 数据集的高质量原始测序数据。候选数据集初始列表通过以下属性进行筛选:
(1) 数据资源状态为开放访问
(2) “LibraryStrategy”=“RNA-Seq”
(3) “Sequencing Platform”=“ILLUMINA”
(4) bulk RNA-seq 和单细胞 RNA-seq 数据集的中位比对率应分别高于 50% 和 40%。
(5) 根据生物学背景将数据集分为“基线”“遗传”“表型”“环境”“空间”和“时间”等类别。
最终整合到 GEN-1.0 中的数据集列表是在此基础上进一步人工整理得到的。
RNA-seq 数据处理流程包括原始数据预处理(质量控制)、序列比对、基因/转录本表达定量(适用于 bulk RNA-seq 和单细胞 RNA-seq 数据)、细胞聚类和细胞注释(仅适用于单细胞 RNA-seq 数据)。
 |
Bulk RNA-seq 数据分析——预处理及基因/转录本表达定量
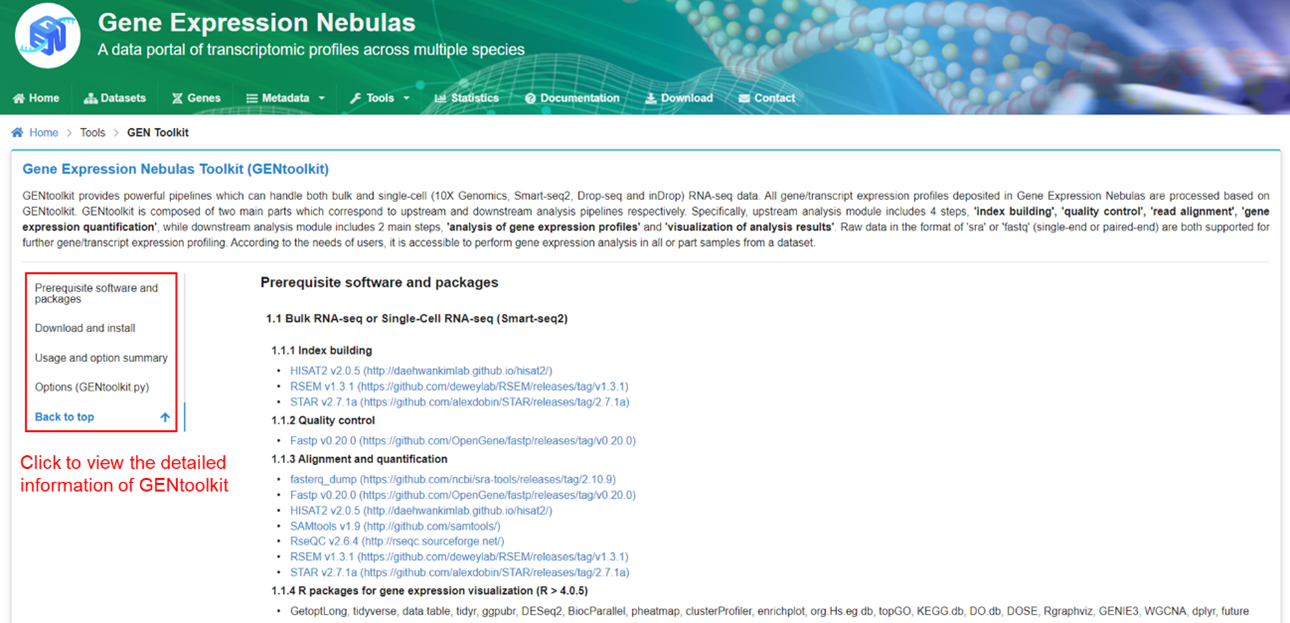
首先,使用 Fastp v0.20.0(Chen 等,2018)通过预处理步骤过滤低质量 RNA-seq reads,并使用 RseQC v2.6.4(Wang 等,2012)推断 RNA-seq 文库的链特异性。随后,使用 STAR 2.7.1a(Dobin 等,2013)将高质量 RNA-seq reads 比对到 Ensembl GRCh38 参考基因组。完成序列比对后,使用 RSEM v1.3.1(Li 和 Dewey,2011)的默认参数进行基因/异构体组装与定量;在基础表达谱分析中,同时计算 RawCount、RPKM 和 TPM。
参考文献:
Chen S, Zhou
Y, Chen Y, et al. fastp: an ultra-fast all-in-one FASTQ
preprocessor.
Bioinformatics.
2018,34(17):i884-i890.
PMID:30423086
Wang L, Wang
S, Li W. RSeQC: quality control of RNA-seq experiments.
Bioinformatics.
2012,28(16):2184-2185.
PMID:22743226
Dobin A,
Davis CA, Schlesinger F, et al. STAR: ultrafast universal RNA-seq
aligner.
Bioinformatics.
2013,29(1):15-21.
PMID:23104886
Li B, Dewey
CN. RSEM: accurate transcript quantification from RNA-Seq data with
or without a
reference
genome. BMC Bioinformatics. 2011,12:323.
PMID:21816040
Bulk RNA-seq 数据分析——RNA 编辑位点识别及 RNA 编辑水平定量
RNA 编辑位点的识别及 RNA 编辑水平定量主要由 REDItoolDenovo.py 完成,该脚本位于
REDItools 2.0(Picardi 等,2013)。首先,使用 REDItools 2.0 的并行策略,根据每个位点的 reads 覆盖度和变异频率识别并定量所有候选 RNA 编辑位点。其次,通过不同的参数配置分别筛选位于 Alu 区域和非 Alu 区域的候选 RNA 编辑位点,并结合基因注释、RepeatMasker、SNP 以及已知 RNA 编辑信息等多种注释文件进行后续注释。第三,由于非 Alu 区域中的编辑位点通常分布范围较窄,因此采用额外的筛选标准,以获得更准确的非 Alu 区域新型编辑位点。具体而言,使用 Pblat(Wang 和 Kong,2019)检测错配及多重比对 reads,并使用 Samtools(Li 等,2009)删除重复 reads。最后,将 RNA 编辑位点标记为新型位点或已知位点。当前版本同时包含 A-to-I 和 C-to-U 两种 RNA 编辑类型。
注释文件来源:(1) 基因注释文件:
GENCODE V33,
(2) RepeatMasker 注释文件:
UCSC,
(3) SNP 注释文件:
UCSC,(4) 已知 RNA 编辑位点:
REDIportal database.
使用以下工具将 RepeatMasker 文件和已知 RNA 编辑位点文件的基因组坐标从 hg19 转换为 hg38:
UCSC
liftover.
参考文献:
Picardi E,
Pesole G. REDItools: high-throughput RNA editing detection made easy. Bioinformatics. 2013,
29(14):1813-1814.
PMID:23742983
Wang M, Kong
L. pblat: a multithread blat algorithm speeding up aligning sequences to genomes. BMC
Bioinformatics. 2019, 20(1):28.
PMID:30646844
Li H,
Handsaker B, Wysoker A, et al. The Sequence Alignment/Map format and SAMtools.
Bioinformatics. 2009,25(16):2078-2079.
PMID:19505943
单细胞 RNA-seq 数据分析——序列比对及计数矩阵生成
对于来自 10X Genomics 平台的数据集,使用 CellRanger 生成数据。对于基于液滴的单细胞数据,矩阵计数步骤略为复杂,因为工具需要追踪每条 read 的来源(来自哪个细胞和哪个转录本;如使用 UMI,也需追踪 UMI)。获得每个基因的 read 计数矩阵是比对步骤的一部分,其中行通常对应基因,列对应细胞。
对于来自 Drop-seq 和 inDrop 的数据集,使用 dropEst 生成数据。
(1) dropTag:从文库中提取细胞条形码和 UMI。结果:拆分后的 .fastq.gz 文件,随后应比对到参考序列。
(2) 将拆分后的文件比对到参考基因组。结果:包含比对结果的 .bam 文件。
(3) dropEst:构建计数矩阵并估算质量控制所需的部分统计指标。结果:包含计数矩阵和统计信息的 .rds 文件;也可选择输出 MatrixMarket 格式的计数矩阵。
(4) dropReport:生成文库质量报告。
对于来自 Smart-seq2 和 SMARTer(Fluidigm C1)的数据集,其处理流程与 bulk RNA-seq 分析相同,包括 fastp、RSeQC 和 RSEM;不同之处在于 RSEM 步骤使用特殊参数“--single-cell-prior”,以 Dirichlet(0.1)作为先验来计算后验均值估计和可信区间。
根据下方列出的结构化整理模型,对所有纳入的 RNA-seq 数据集元数据进行人工整理,分为“项目”“数据集”“数据谱”和“样本”4 个层级。
“项目”层级的整理模型
| 项目 |
说明 |
值(灰色文字:登录号前缀) |
| 数据资源 |
受控词表 |
NGDC、NCBI、EBI、DDBJ |
| BioProject ID |
数据资源中各 BioProject 的登录号 |
PRJCA, PRJNA,
PRJEB, or PRJDA
|
| 原始项目 ID |
数据资源中各系列或原始数据项目的登录号 |
CRA, GSE,
ERA, or DRP
|
| 项目名称 |
数据资源中 BioProject 的标题 |
归纳术语 |
| 物种 |
受控词表 |
智人、小鼠、黑腹果蝇等 |
| 测序策略 |
受控词表 |
Bulk RNA-seq、scRNA 10X Genomics、scRNA Smart-seq2 等 |
| 组织 |
受控词表 |
脑、肝、皮肤、肾、叶、根、种子等 |
| 细胞类型 |
受控词表 |
T 细胞、B 细胞等 |
| 细胞系 |
受控词表 |
CB660、H358、501 mel 等 |
| 疾病 |
受控词表 |
哮喘、慢性淋巴细胞白血病(CLL)、健康对照等 |
| 发育 |
BioProject 中样本的发育阶段 |
归纳术语 |
| 病例/对照详情 |
病例/对照条件的详细说明 |
归纳术语 |
| 样本数量 |
统计数据 |
项目中包含的样本数量 |
| 摘要 |
项目方案的简要说明 |
归纳术语 |
| 总体设计 |
实验设计,主要包括样本分组 |
归纳术语 |
| PMID |
描述该研究的出版物 |
PubMed ID 或 DOI |
| 发布日期 |
BioProject 在数据资源中的发布日期 |
包括年、月、日 |
| 提交日期 |
BioProject 在数据资源中的提交日期 |
包括年、月、日 |
| 更新日期 |
BioProject 在数据资源中的更新日期 |
包括年、月、日 |
“数据集”层级的整理模型
| 项目 |
说明 |
值(灰色文字:登录号前缀) |
| 数据资源 |
受控词表 |
NGDC、NCBI、EBI、DDBJ |
| GEN 数据集 ID |
GEN 中各数据集的登录号 |
GEND |
| BioProject ID |
数据资源中各 BioProject 的登录号 |
PRJCA, PRJNA,
PRJEB, or PRJDA |
| 原始项目 ID |
数据资源中各系列或原始数据项目的登录号 |
CRA, GSE,
ERA, or DRP
|
| 物种 |
受控词表 |
智人、小鼠、黑腹果蝇等 |
| 测序策略 |
受控词表 |
Bulk RNA-seq、scRNA 10X Genomics、scRNA Smart-seq2 等 |
| 基线 |
受控词表 |
是或否 |
| 遗传 |
受控词表 |
数据集中样本的遗传特征(突变、自然变异等)
|
| 表型 |
受控词表 |
数据集中样本的表型特征(疾病、性别、病毒感染等)
|
| 环境 |
受控词表 |
非生物胁迫、生物胁迫或生态暴露 |
| 空间 |
受控词表 |
细胞类型、细胞系、生物体、类器官和组织 |
| 时间 |
受控词表 |
发育、昼夜节律、时间序列 |
| RNA 类型 |
受控词表 |
去除 rRNA 的 RNA、poly(A)+ RNA、poly(A)- RNA 等 |
| 中位比对质量 |
统计数据 |
BioProject 中样本的中位比对率 |
| 中位覆盖度 |
统计数据 |
BioProject 中样本的中位覆盖度 |
| 最大测序长度 |
统计数据 |
BioProject 中样本的最大测序长度 |
| 最大重复数 |
统计数据 |
BioProject 中样本的最大重复数 |
| 组织 |
受控词表 |
脑、肝、皮肤、肾、叶、根、种子等 |
| 细胞类型 |
受控词表 |
T 细胞、B 细胞等 |
| 细胞系 |
受控词表 |
CB660、H358、501 mel 等 |
| 疾病 |
受控词表 |
哮喘、慢性淋巴细胞白血病(CLL)、健康对照等 |
| 发育 |
BioProject 中样本的发育阶段 |
归纳术语 |
| 病例/对照详情 |
病例/对照条件的详细说明 |
归纳术语 |
| 样本数量 |
统计数据 |
项目中包含的样本数量 |
| 数据集名称 |
数据集标题 |
归纳术语 |
| 摘要 |
项目方案的简要说明 |
归纳术语 |
| 总体设计 |
实验设计,主要包括样本分组 |
归纳术语 |
| PMID |
描述该研究的出版物 |
PubMed ID 或 DOI |
| 发布日期 |
BioProject 在数据资源中的发布日期 |
包括年、月、日 |
| 提交日期 |
BioProject 在数据资源中的提交日期 |
包括年、月、日 |
| 更新日期 |
BioProject 在数据资源中的更新日期 |
包括年、月、日 |
“数据谱”层级的整理模型
| 项目 |
说明 |
值(灰色文字:登录号前缀) |
| GEN XProfile ID |
GEN 中基因表达谱的登录号 |
GENDX |
| GEN CProfile ID |
GEN 中 circRNA 表达谱的登录号 |
GENDC |
| GEN EProfile ID |
GEN 中基因编辑谱的登录号 |
GENDE |
| GEN SProfile ID |
GEN 中基因剪接谱的登录号 |
GENDS |
| 数据资源 |
受控词表 |
NGDC、NCBI、EBI、DDBJ |
| 原始项目 ID |
数据资源中各系列或原始数据项目的登录号 |
CRA, GSE,
ERA, or DRP |
| GEN 数据集 ID |
GEN 中各数据集的登录号 |
GEND |
| BioProject ID |
数据资源中各 BioProject 的登录号 |
PRJCA, PRJNA,
PRJEB, or PRJDA |
| 物种 |
受控词表 |
智人、小鼠、黑腹果蝇等 |
| 测序策略 |
受控词表 |
Bulk RNA-seq、scRNA 10X Genomics、scRNA Smart-seq2 等 |
| 参考基因组 |
参考基因组版本,例如 GRCh38 v99(如有需要,包含 ERCC) |
.fa、.fasta 或 .fna 文件 |
| 基因组注释 |
基因组注释版本,例如 GRCh38 v99(如有需要,包含 ERCC) |
.gff(或 .gff3、.gtf)文件和 .bed 文件 |
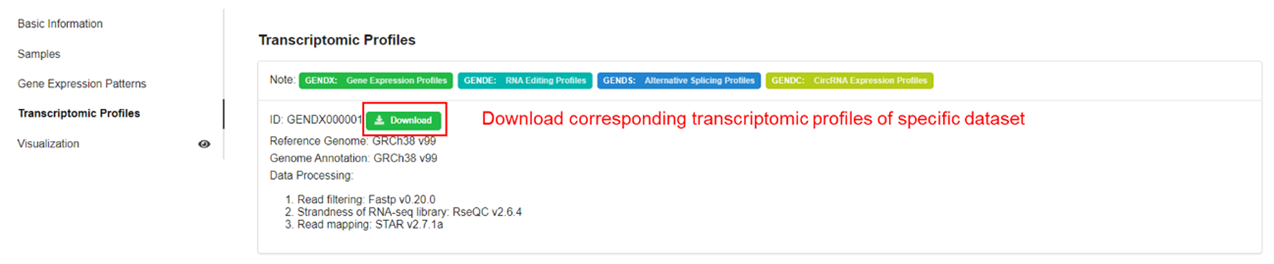
| 数据处理 |
针对不同测序策略执行质量控制、序列比对并生成表达矩阵
|
例如,对于 bulk/scRNA Smart-seq2,使用 Fastp v0.20.0 进行质量控制,使用 RseQC v2.6.4 推断链特异性,并分别使用 STAR v2.7 和 RSEM v1.3.1 进行序列比对和生成表达谱
|
“样本”层级的整理模型
| 项目 |
说明 |
值(灰色文字:登录号前缀) |
| 基本信息 |
| 数据资源 |
受控词表 |
NGDC、NCBI、EBI、DDBJ |
| 原始项目 ID |
数据资源中各系列或原始数据项目的登录号 |
CRA, GSE,
ERA, or DRP |
| BioProject ID |
数据资源中各 BioProject 的登录号 |
PRJCA, PRJNA,
PRJEB, or PRJDA |
| BioSample ID |
数据资源中各 BioSample 的登录号 |
SAMC, SAMN, or
SAME
|
| 样本 ID |
数据资源中各样本的登录号 |
GSM |
| 样本名称 |
数据资源中各样本的名称 |
归纳术语 |
| 样本登录号 |
数据资源中各原始数据样本的登录号 |
CRS, SRS, or
ERS
|
| 实验登录号 |
数据资源中各实验样本的登录号 |
CRX, SRX, or
ERX
|
| GEN 数据集 ID |
GEN 中各数据集的登录号 |
GEND |
| GEN 样本 ID |
GEN 中各样本的登录号 |
GENDS |
| Sample_Name_GEN |
GEN 中各样本的名称 |
归纳术语 |
| 发布日期 |
样本数据在数据资源中的发布日期 |
包括年、月、日 |
| 提交日期 |
样本数据在数据资源中的提交日期 |
包括年、月、日 |
| 更新日期 |
样本数据在数据资源中的更新日期 |
包括年、月、日 |
| 样本特征 |
| 物种 |
受控词表 |
智人、小鼠、黑腹果蝇等 |
| 种族/品种/品系/栽培品种 |
归纳术语 |
种族是指人的身体特征,例如骨骼结构以及皮肤、头发或眼睛颜色。例如美洲印第安人、亚洲人、黑人、西班牙裔、白人等。
品种是指具有相对一致的外观(表型)、行为和/或其他特征,且可与同一物种其他个体区分的一类特定家养动物群体。
品系是指植物、病毒或细菌的变体,或用于实验目的的近交动物。
栽培品种是指经过人工选择、具有理想特征,并能在繁殖过程中保持这些特征的一组植物。
|
| 族群/国家 |
受控词表 |
族群是指文化因素,包括国籍、地域文化、祖先来源和语言。例如德国或西班牙血统,或汉族。
|
| 年龄 |
统计数据 |
样本(患者、健康供体等)的年龄 |
| 年龄单位 |
受控词表 |
样本的年龄单位(年、周、日等) |
| 性别 |
受控词表 |
男性、女性等 |
| 来源名称 |
各样本组的名称 |
归纳术语 |
| 组织 |
受控词表 |
脑、肝、皮肤、肾、叶、根、种子等 |
| 细胞类型 |
受控词表 |
T 细胞、B 细胞等 |
| 细胞亚型 |
受控词表 |
细胞亚型或细胞群 |
| 细胞系 |
受控词表 |
CB660、H358、501 mel 等 |
| 生物学条件 |
| 疾病 |
受控词表 |
哮喘、慢性淋巴细胞白血病(CLL)、健康对照等 |
| 疾病状态 |
样本的疾病阶段 |
归纳术语 |
| 发育阶段 |
样本的发育阶段 |
归纳术语 |
| 突变 |
相关基因突变 |
归纳术语 |
| 表型 |
样本的表型特征 |
归纳术语 |
| 高度/长度/重量 |
植物样本的高度、长度和重量 |
归纳术语 |
| 分离来源 |
植物样本的分离条件 |
归纳术语 |
| 实验变量 |
| 病例/对照 |
病例/对照分组 |
归纳术语 |
| 病例详情 |
用于区分病例与对照的病例详细信息 |
归纳术语 |
| 对照详情 |
用于区分病例与对照的对照详细信息 |
归纳术语 |
| 实验方案 |
| 生长方案 |
样本来源细胞或细胞系的培养方案 |
归纳术语 |
| 处理方案 |
样本处理方案 |
归纳术语 |
| 处理 |
样本处理的简要说明 |
归纳术语 |
| 提取方案 |
RNA 提取方案 |
归纳术语 |
| 文库构建方案 |
RNA 测序文库构建方案 |
归纳术语 |
| 分子类型 |
受控词表 |
去除 rRNA 的 RNA、poly(A)+ RNA、poly(A)- RNA 等 |
| 文库布局 |
受控词表 |
双端、单端 |
| 链特异性 |
受控词表 |
特异、非特异 |
| 文库链方向 |
受控词表 |
Reverse 表示第一链,Forward 表示第二链,短横线(-)表示非链特异性
|
| 外源加标 |
受控词表 |
ERCC 或 - |
| 测序技术 |
| 测序策略 |
受控词表 |
Bulk RNA-seq、scRNA 10X Genomics、scRNA Smart-seq2 等 |
| 平台 |
受控词表 |
Illumina、BGISEQ 等 |
| 仪器型号 |
受控词表 |
Illumina HiSeq 2000、Illumina NextSeq 500、BGISEQ-500 等
|
| 质量评估 |
| #细胞数 |
统计数据 |
估算的细胞数量 |
| #Reads 数 |
统计数据 |
fastq 文件中的 reads 数量 |
| GBases |
统计数据 |
过滤后的总碱基数 |
| AvgSpotLen1 |
统计数据 |
Spot1 的平均长度(如经过过滤,则为过滤后的长度) |
| AvgSpotLen2 |
统计数据 |
Spot2 的平均长度(如经过过滤,则为过滤后的长度) |
| 唯一比对率 |
计算数据 |
唯一比对 reads 的百分比 |
| 多重比对率 |
计算数据 |
多重比对 reads 的百分比 |
| 覆盖率 |
计算数据 |
总比对 reads 数量 × 平均 read 长度 / 参考基因组总碱基数 |
基因功能注释
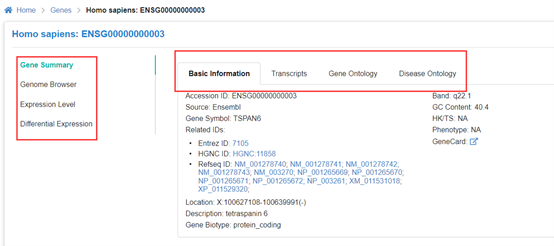
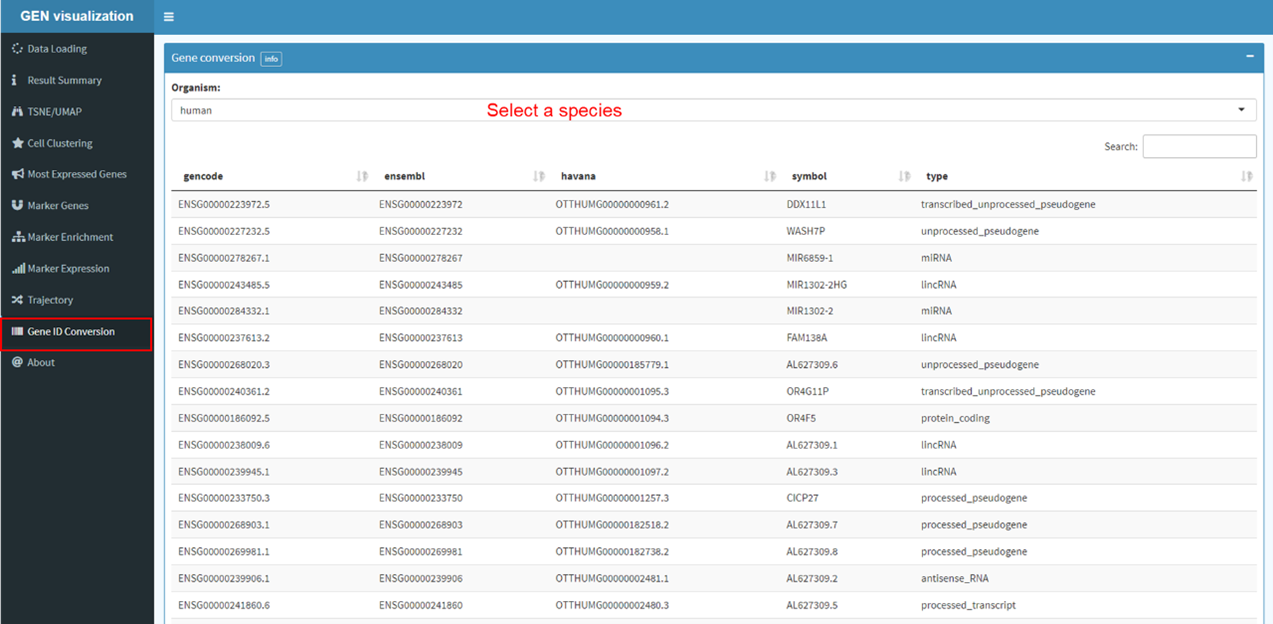
为了更好地理解多物种中的基因功能,GEN 为用户提供每个基因的多维信息作为参考。基因基本信息(包括 Entrez ID、RefSeq ID、Symbol、Position 等)来源于基因组注释谱。此外,基因摘要中还展示管家基因或组织特异性基因、基因本体、疾病本体,以及 Genome Browser 中的基因结构可视化信息。每个基因还会链接来自
GeneCard,
EDK
和
ICG 的外部信息(如可用)。
组织特异性(TS)基因和管家(HK)基因的定义
管家基因和组织特异性基因根据以下来源的表达谱进行定义:
GTEx portal (基因型-组织表达项目,覆盖 53 种正常人体组织)。首先过滤掉在所有组织中最高表达值低于 0.5 TPM/FPKM 的基因。随后使用组织特异性指数 τ 值和 CV(变异系数)值判定管家基因(HK,τ 值 <= 0.5 且 CV <= 0.5)和组织特异性基因(TS,τ 值 >= 0.95)。
τ 指数定义如下:
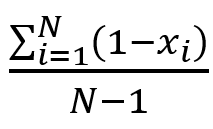 |
其中,N 为组织数量,表达谱分量由最大分量值归一化。CV 是 coefficient of variation(变异系数)的缩写,表示基因表达水平在不同组织之间的波动程度。变异系数(CV)定义为不同组织中基因表达水平的标准差与均值之比。
参考文献:
Yanai I, Benjamin H, Shmoish M, et al. Genome-wide midrange
transcription profiles reveal expression level relationships in human tissue specification.
Bioinformatics. 2005,21(5):650-659.
PMID:15388519
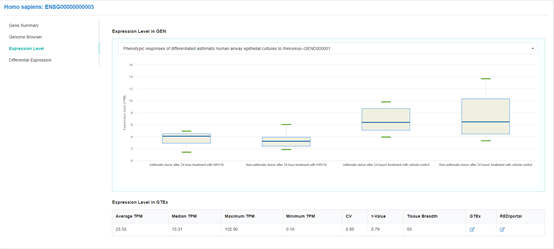
来源于 GTEx 和 REDIportal 的基因表达谱与 RNA 编辑谱参考数据
正常人体组织或身体部位的参考基因表达水平和 RNA 编辑水平分别获取自
GTEx portal 和and
REDIportal。为概览整体表达和 RNA 编辑模式,“基因摘要”部分展示每个基因在 53 种组织中的“平均值”“中位数”“最大值”“最小值”表达水平及 RNA 编辑水平,以及“CV”“τ 值”和“表达广度”;这些指标也可作为基因筛选条件。
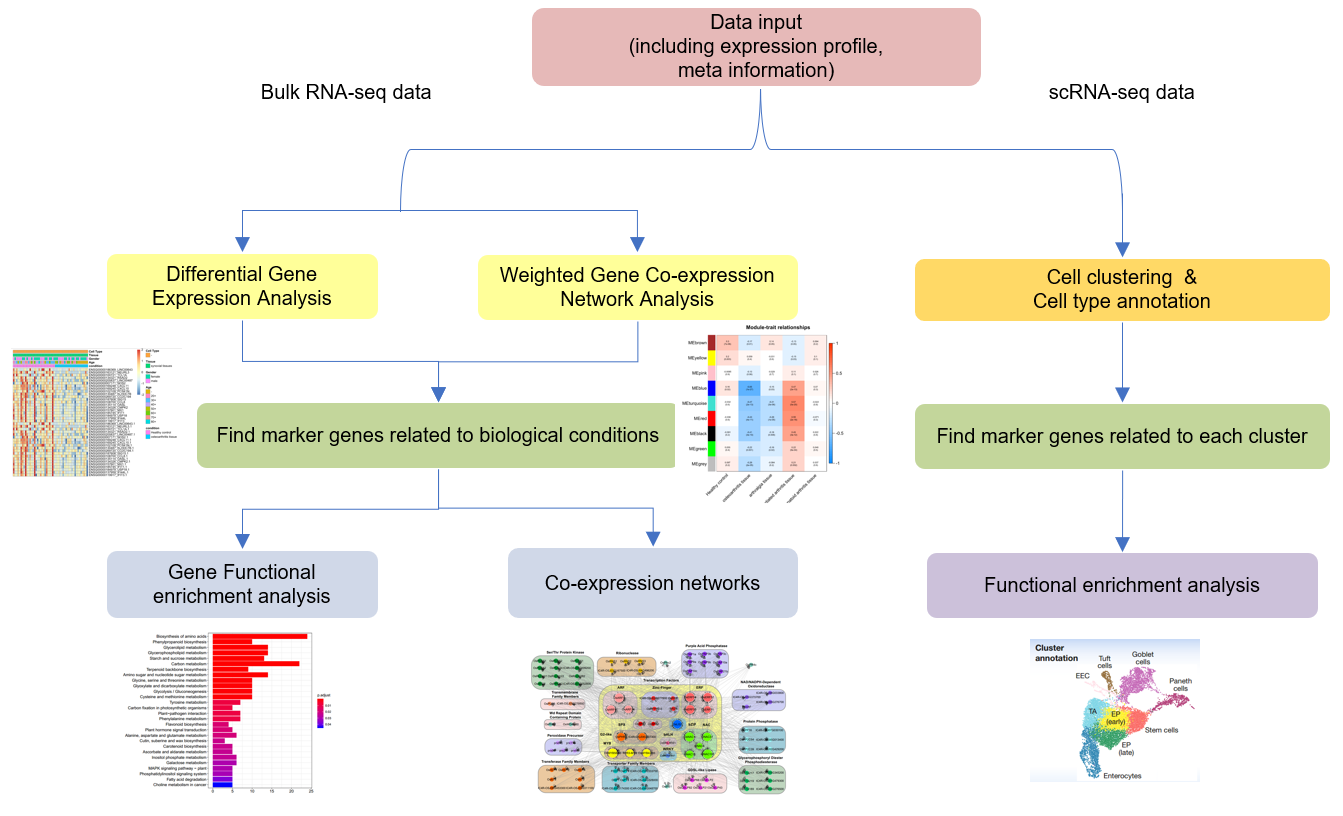 |
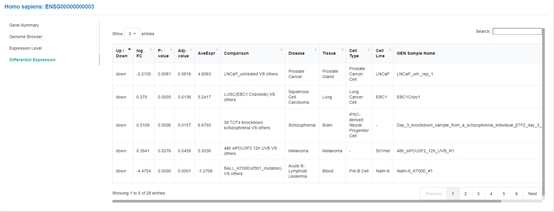
对于包含一个对照组和一个病例组的选定项目,病例组将直接与对照组进行比较。
Limma (Law 等,2014)是一个最初为微阵列数据差异表达(DE)分析开发的 R 包。voom(Ritchie 等,2015)是 limma 包中的一个函数,可将 RNA-Seq 数据转换为适用于 limma 的形式。Limma-voom 结合使用,可对 RNA-Seq 数据进行快速、灵活且强大的差异表达分析。
limma 的 RNA-seq 分析流程以基因层面的计数作为输入,依次进行预处理和探索性数据分析,最终获得差异表达基因列表和基因特征。在 limma 中,对假定服从正态分布的 log-CPM 值进行线性建模,并使用 voom 函数计算的精度权重处理均值-方差关系。随后,limma 使用 lmFit 和 contrasts.fit 函数分别为每个基因的表达值拟合模型。接着,通过在所有基因间借用信息进行经验贝叶斯校正,从而获得更精确的基因层面变异估计。最后,可使用 topTable 列出基于 eBayes 结果得到的显著差异表达基因。
参考文献:
Ritchie ME, Phipson B, Wu D, et al. limma powers
differential expression analyses for RNA-sequencing and microarray studies. Nucleic Acids
Res. 2015,43(7):e47.
PMID:25605792
Law CW, Chen Y, Shi W, et al. voom: Precision weights
unlock linear model analysis tools for RNA-seq read counts. Genome Biol. 2014,15(2):R29.
PMID:24485249
加权基因共表达网络分析(WGCNA)是一种广泛使用的数据挖掘方法,由 Steve Horvath 开发(Zhang 和 Horvath,2005;Langfelder 和 Horvath,2008)。
WGCNA package 包括网络构建、模块检测、基因选择、拓扑属性计算、可视化以及与外部软件交互等功能。WGCNA 可用于寻找高度相关基因的聚类(模块),使用模块特征基因或模块内枢纽基因概括这些聚类,分析模块之间以及模块与外部样本性状之间的关系(采用特征基因网络方法),并计算模块成员度。相关网络有助于开展基于网络的基因筛选,从而识别候选生物标志物或治疗靶点。
参考文献:
Zhang B, Horvath S. A general framework for weighted
gene co-expression network analysis. Stat Appl Genet Mol Biol. 2005,4:Article17.
PMID:16646834
Langfelder P, Horvath S. WGCNA: an R package for
weighted correlation network analysis. BMC Bioinformatics. 2008,9:559.
PMID:19114008
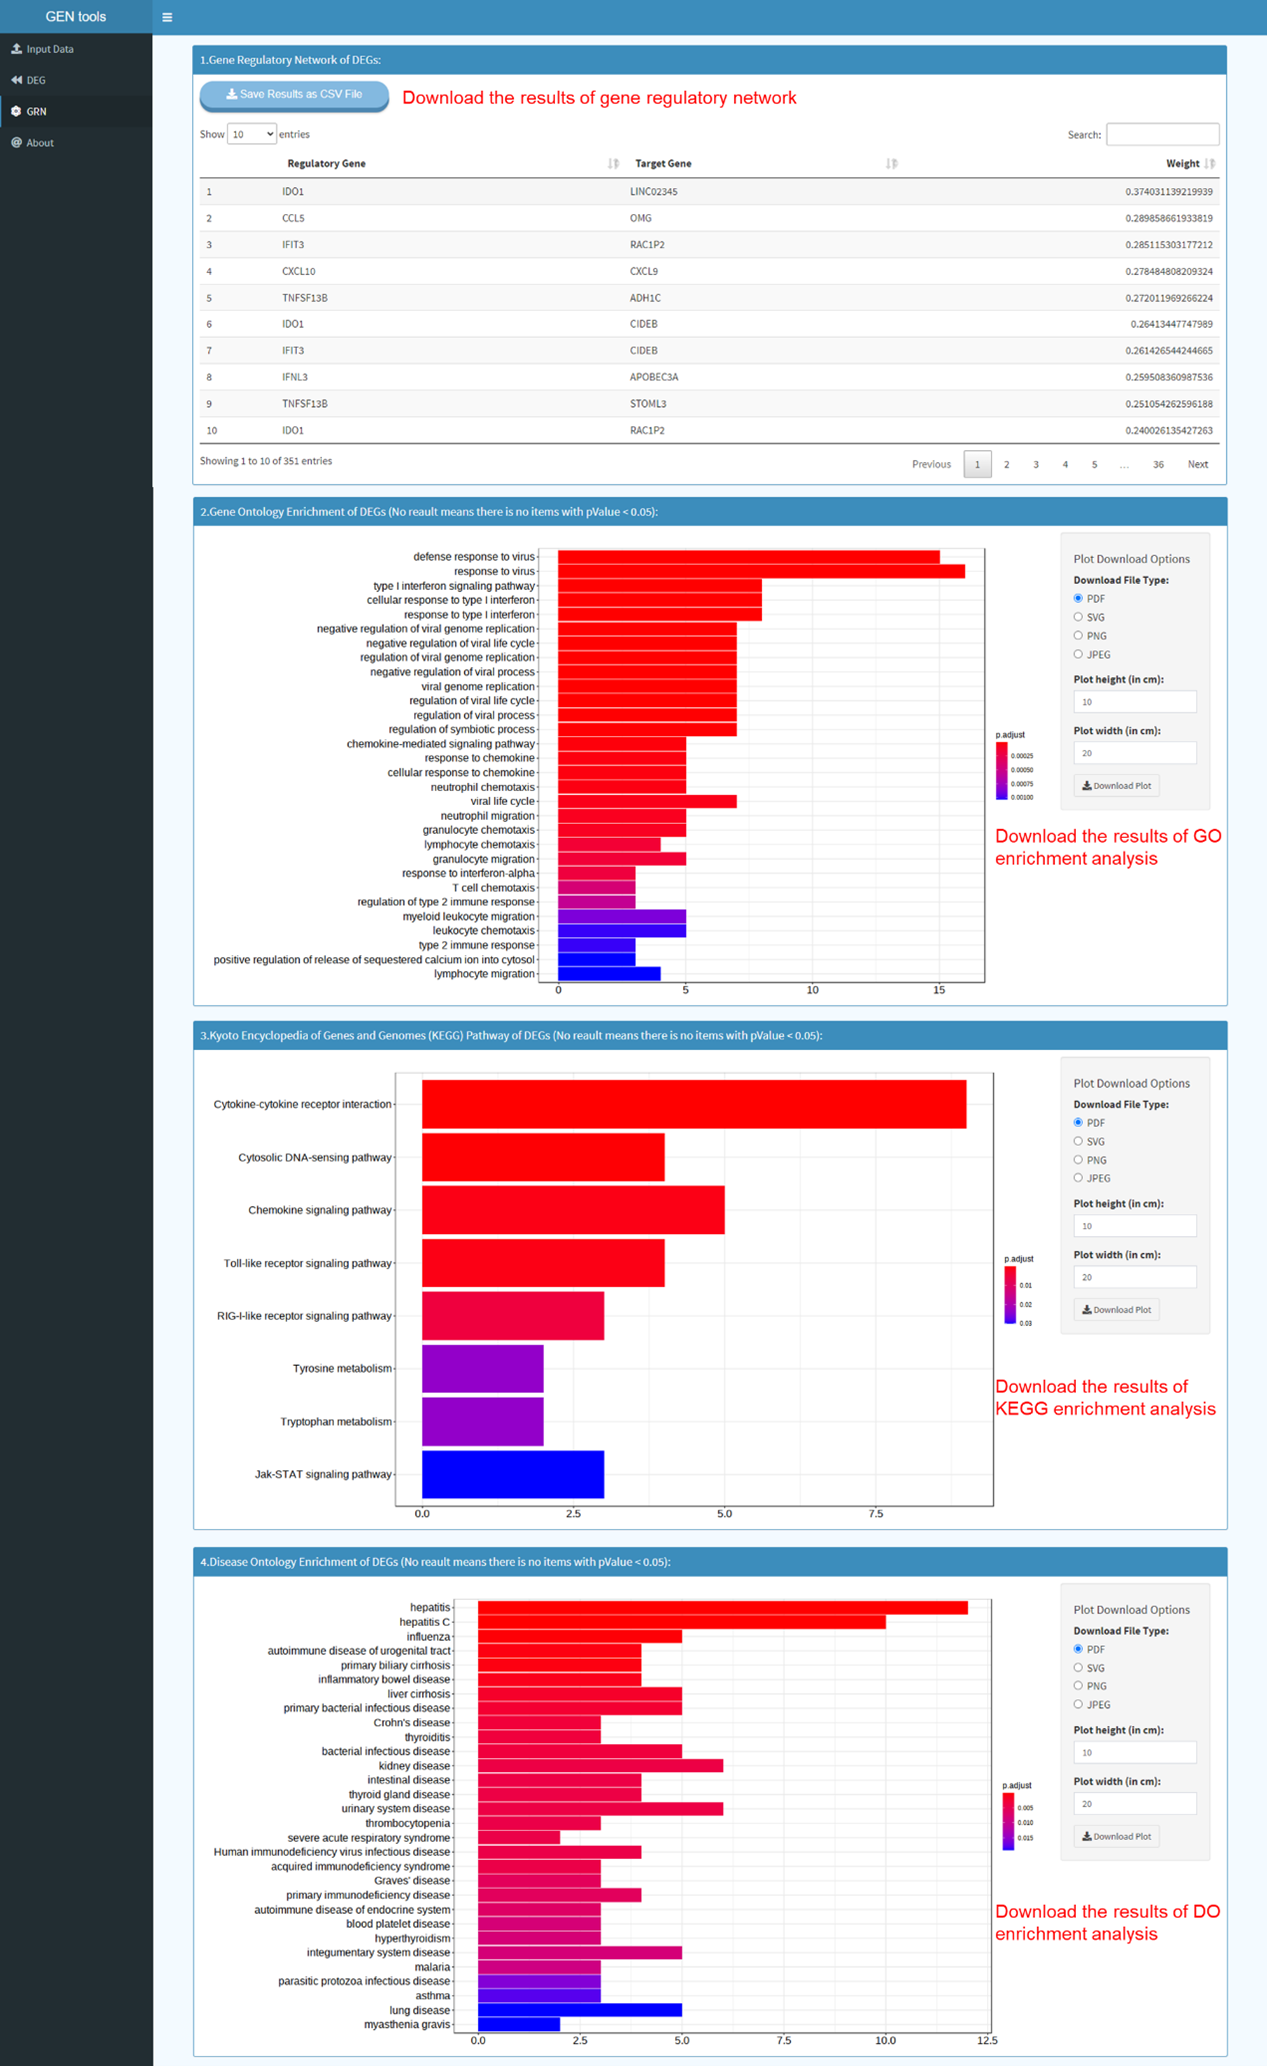
在此,我们采用
clusterProfiler
package,这是由 Yu Guangchuang 开发的通用富集分析工具,可用于功能和比较研究(Yu 等,2012)。
clusterProfiler 包提供一种基因分类方法,可根据基因在 GO 语料体系特定层级上的投影进行分类,并提供 enrichGO、enrichKEGG 和 enrichDO 函数,基于超几何分布分别计算 GO 术语、KEGG 通路和 DO 术语的富集检验。为避免多重检验中较高的错误发现率(FDR),还会估算 q 值以控制 FDR。此外,clusterProfiler 提供用于展示分析结果的可视化模块。
1. 基因本体(GO)
基因本体定义了用于描述基因功能的概念/类别及这些概念之间的关系,并从以下三个方面对功能进行分类:
MF:分子功能(基因产物的分子活动)
CC:细胞组分(基因产物发挥作用的位置)
BP:生物过程(由多个基因产物活动组成的通路和更大尺度的过程)
GO 术语以有向无环图组织,术语之间的边表示父子关系。
2. 京都基因与基因组百科全书(KEGG)
KEGG 是一组人工绘制的通路图,用于表示分子相互作用和反应网络。这些通路涵盖广泛的生化过程,可分为 7 大类:代谢、遗传信息处理、环境信息处理、细胞过程、个体系统、人类疾病和药物开发。
3. 疾病本体(DO)
疾病本体是一种标准化的人类疾病本体,旨在为生物医学界提供一致、可复用且可持续的人类疾病术语、表型特征及相关医学词汇疾病概念描述。
参考文献:
Yu G, Wang LG, Han Y, et al. clusterProfiler: an R
package for comparing biological themes among gene clusters. OMICS. 2012,16(5):284-287.
PMID:22455463
在此,我们采用
GENIE3
package (Huynh-Thu 等,2010),利用回归树集成方法从表达数据中推断基因调控网络(以加权邻接矩阵形式表示)。来自
TRRUST
package (Han 等,2018)的已知调控因子将被筛选,用于预测其靶基因。完成调控网络预测后,我们还会根据 TRRUST 的人工整理结果,对已知调控因子-靶基因相互作用进行进一步注释。
参考文献:
Huynh-Thu VA, Irrthum A, Wehenkel L, et al. Inferring
regulatory networks from expression data using tree-based methods. PLoS One.
2010,5(9):e12776.
PMID:20927193
Han H, Cho JW, Lee S, et al. TRRUST v2: an expanded
reference database of human and mouse transcriptional regulatory interactions. Nucleic Acids
Res. 2018,46(D1):D380-D386.
PMID:29087512
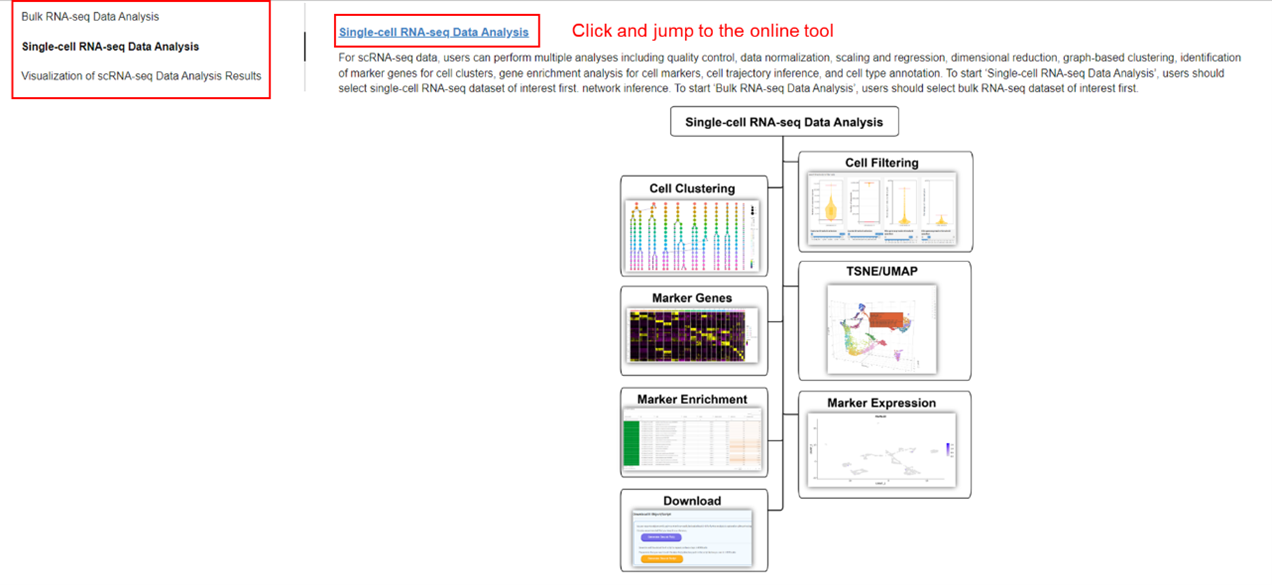
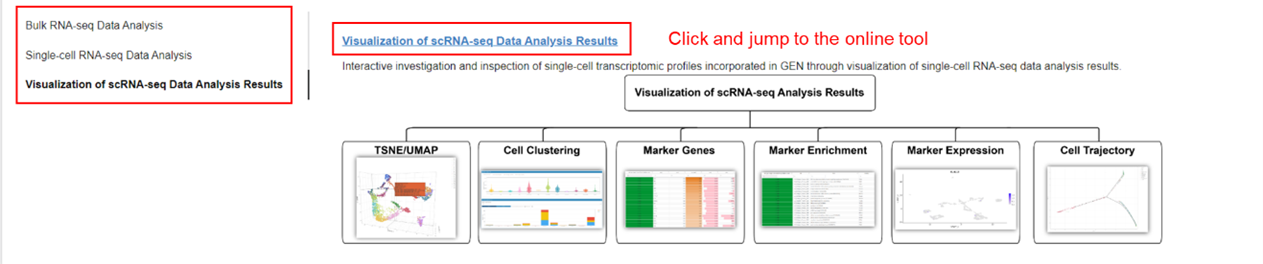
本工具旨在分析单细胞 RNA-seq 数据,并推断每个细胞簇的细胞类型。Seurat 聚类流程的主要组成部分基于
Seurat
3.12 package实现,包括质量控制和数据过滤、高变基因计算、降维、基于图的聚类以及细胞簇标记基因识别(Stuart 等,2019)。此外,我们还基于
SingleR package (Aran 等,2019)提供的纯细胞类型参考转录组数据集,对每个细胞簇进行无偏细胞类型识别。
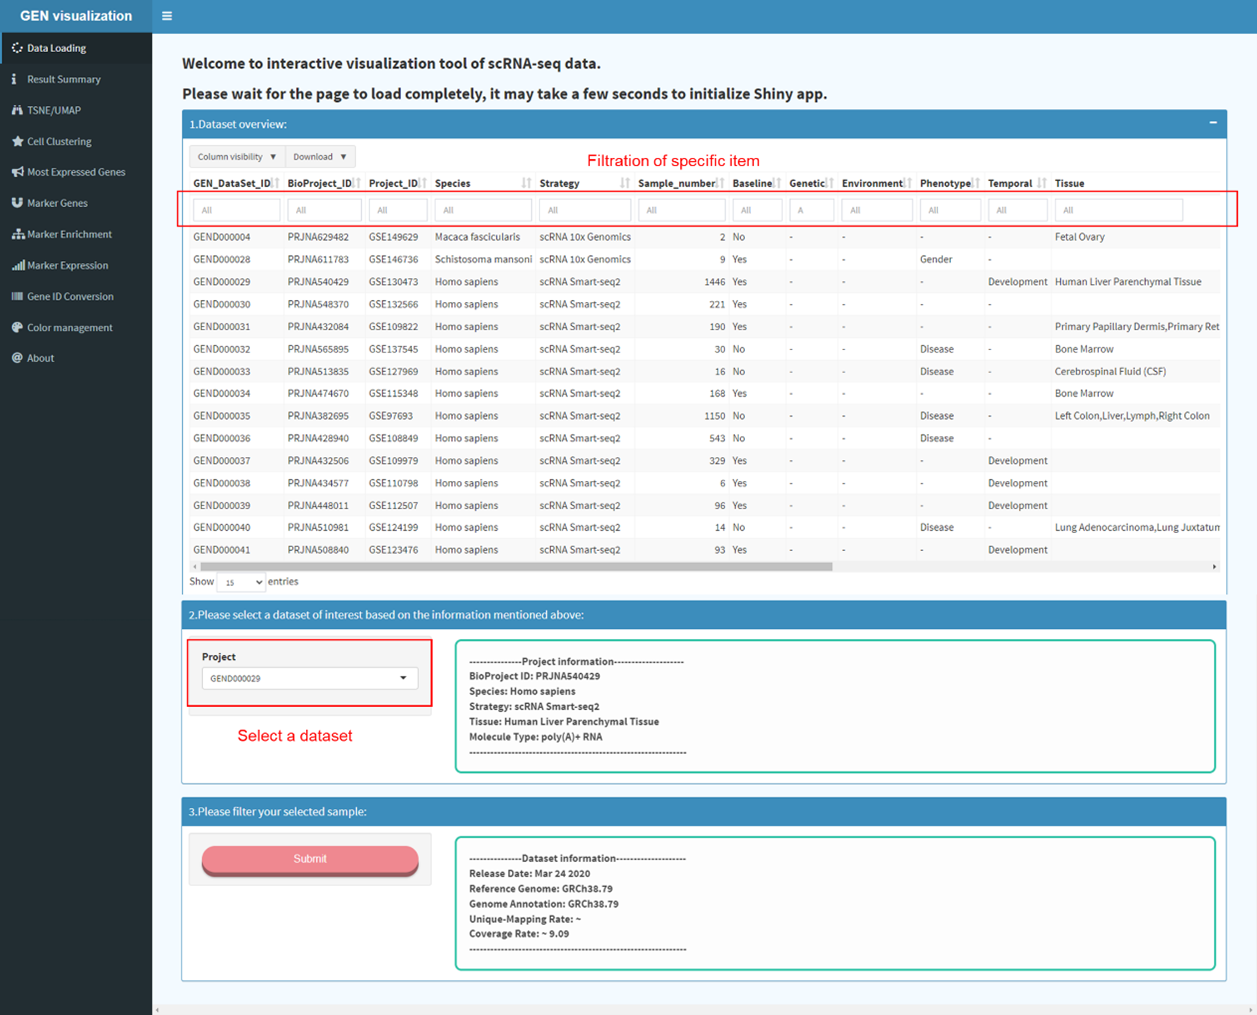
当前版本支持来自单个样本或单个项目的 SMARTer(Fluidigm C1)、Smart-seq2 或 10X Genomics 单细胞 RNA-seq 数据。由于跨不同条件和技术生成的单细胞数据集整合分析耗时较长,目前暂不支持。用户可下载数据并在本地计算机上进行分析。
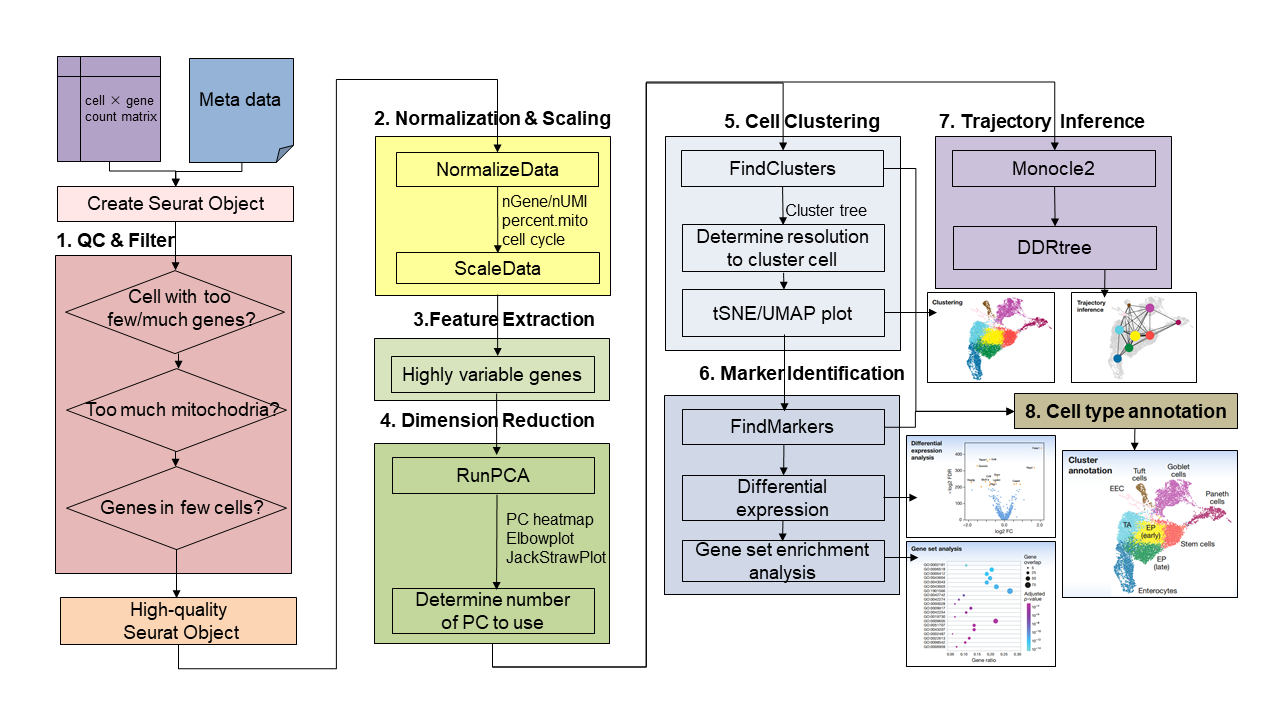
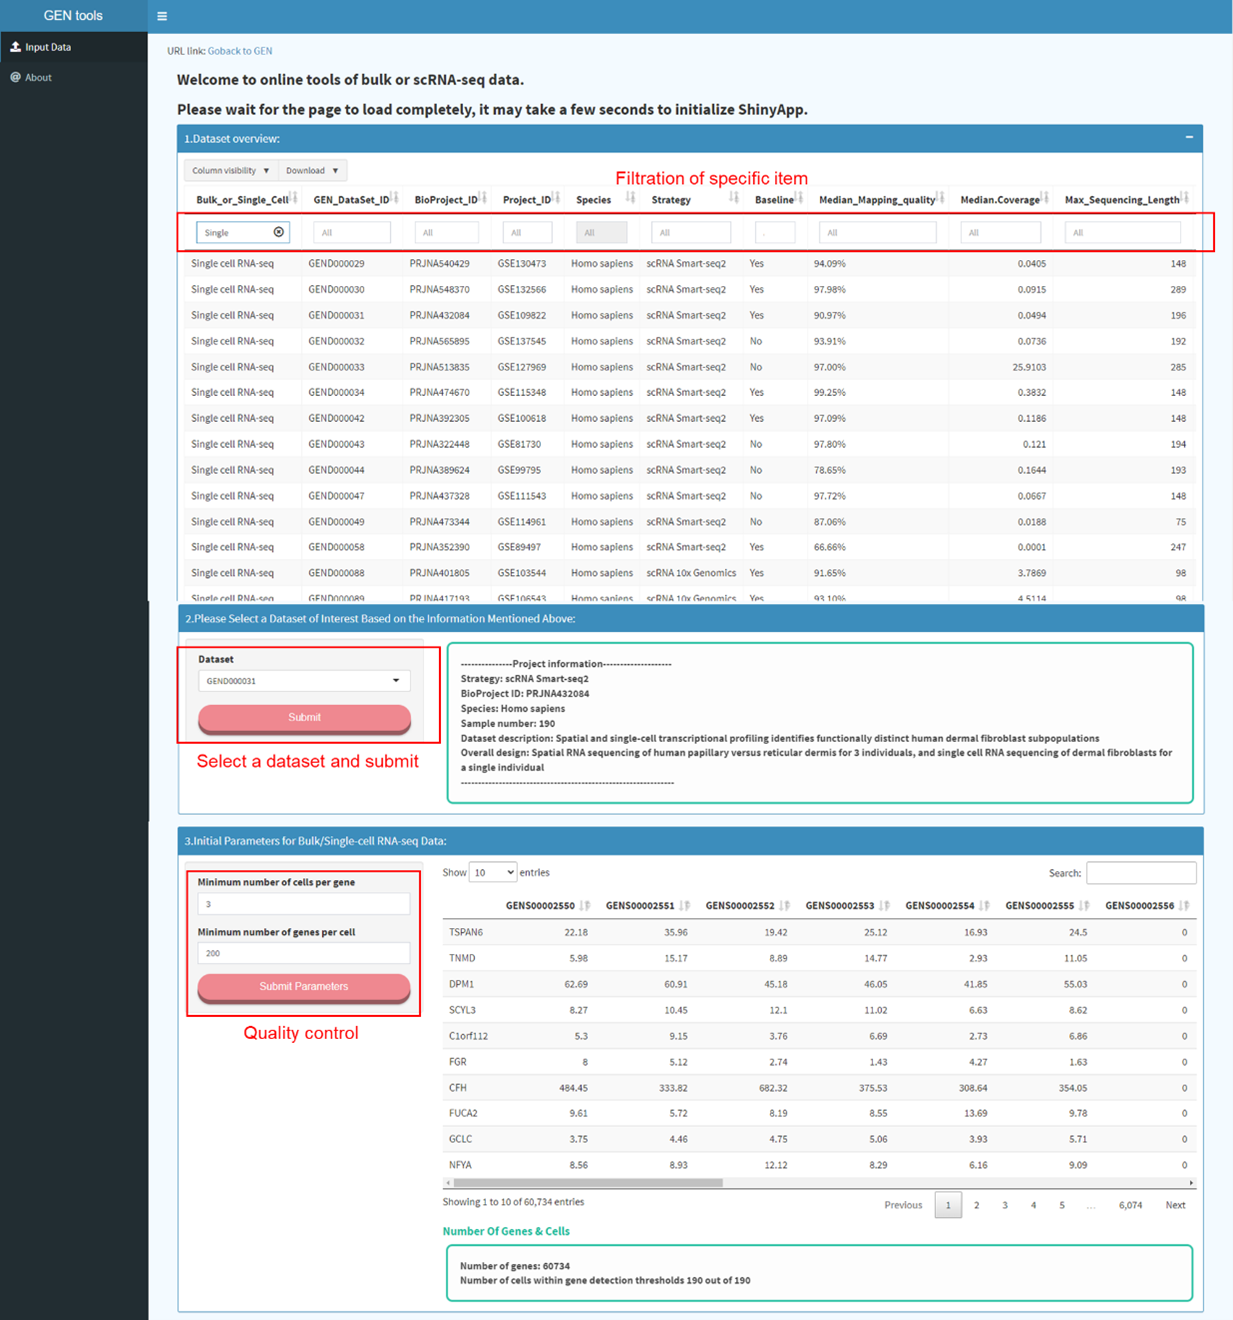
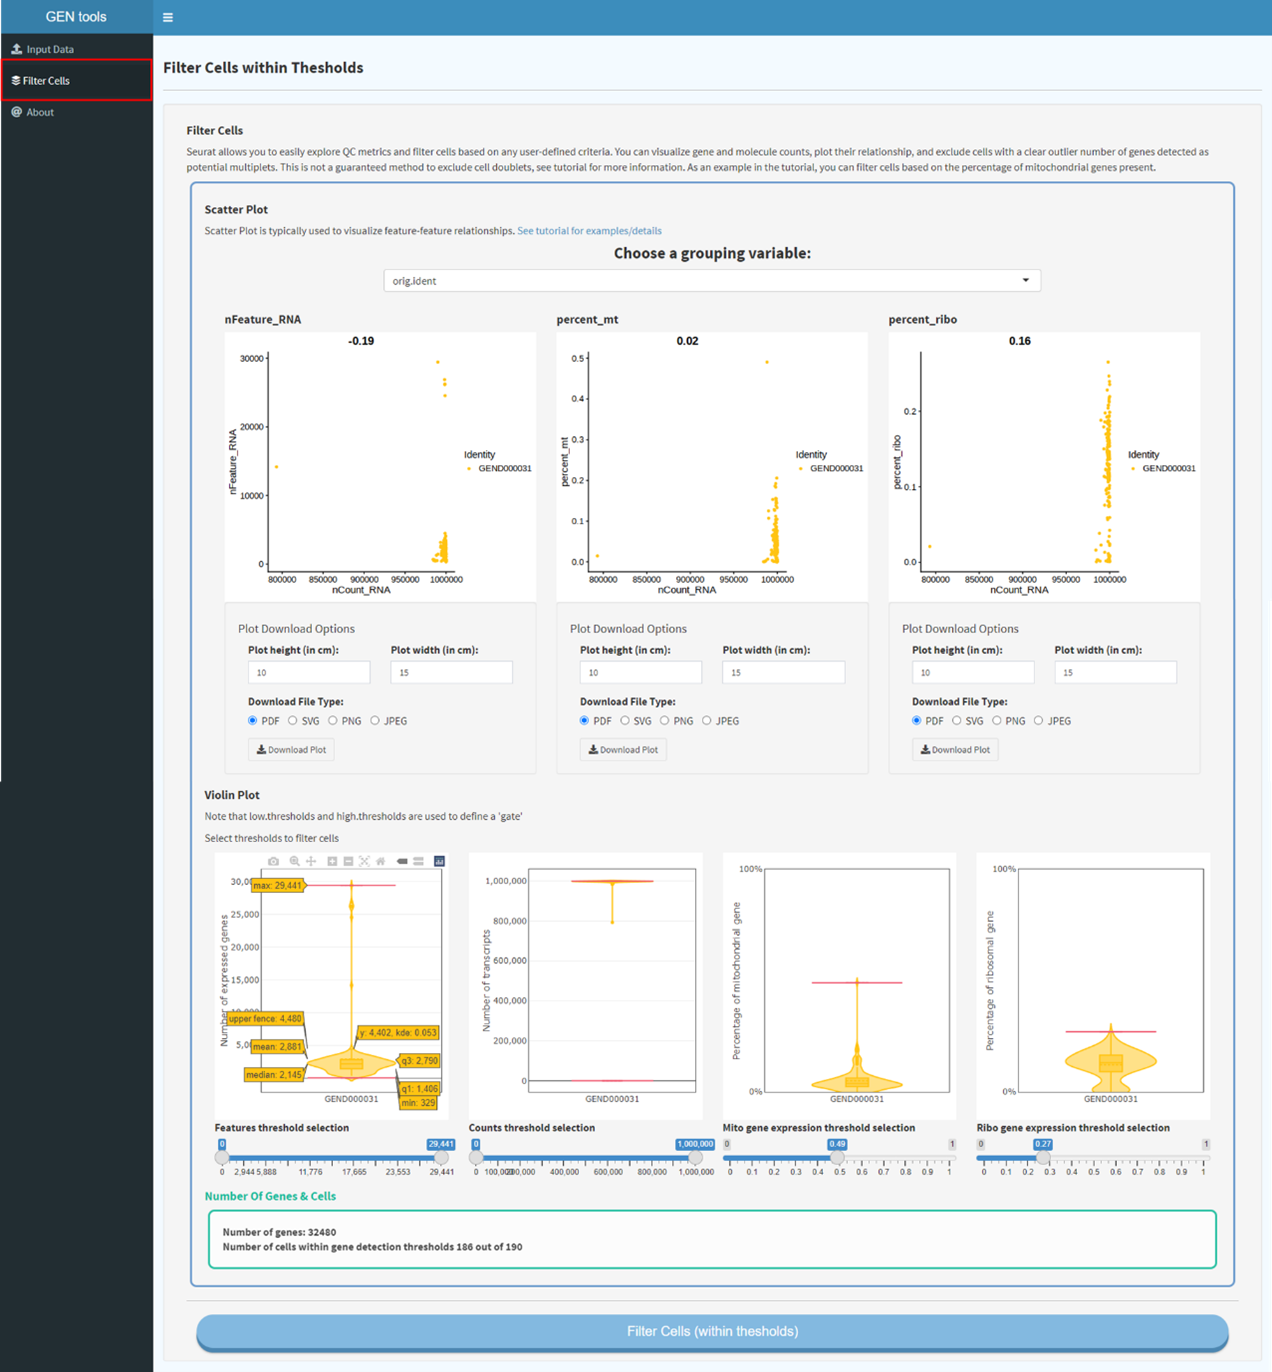
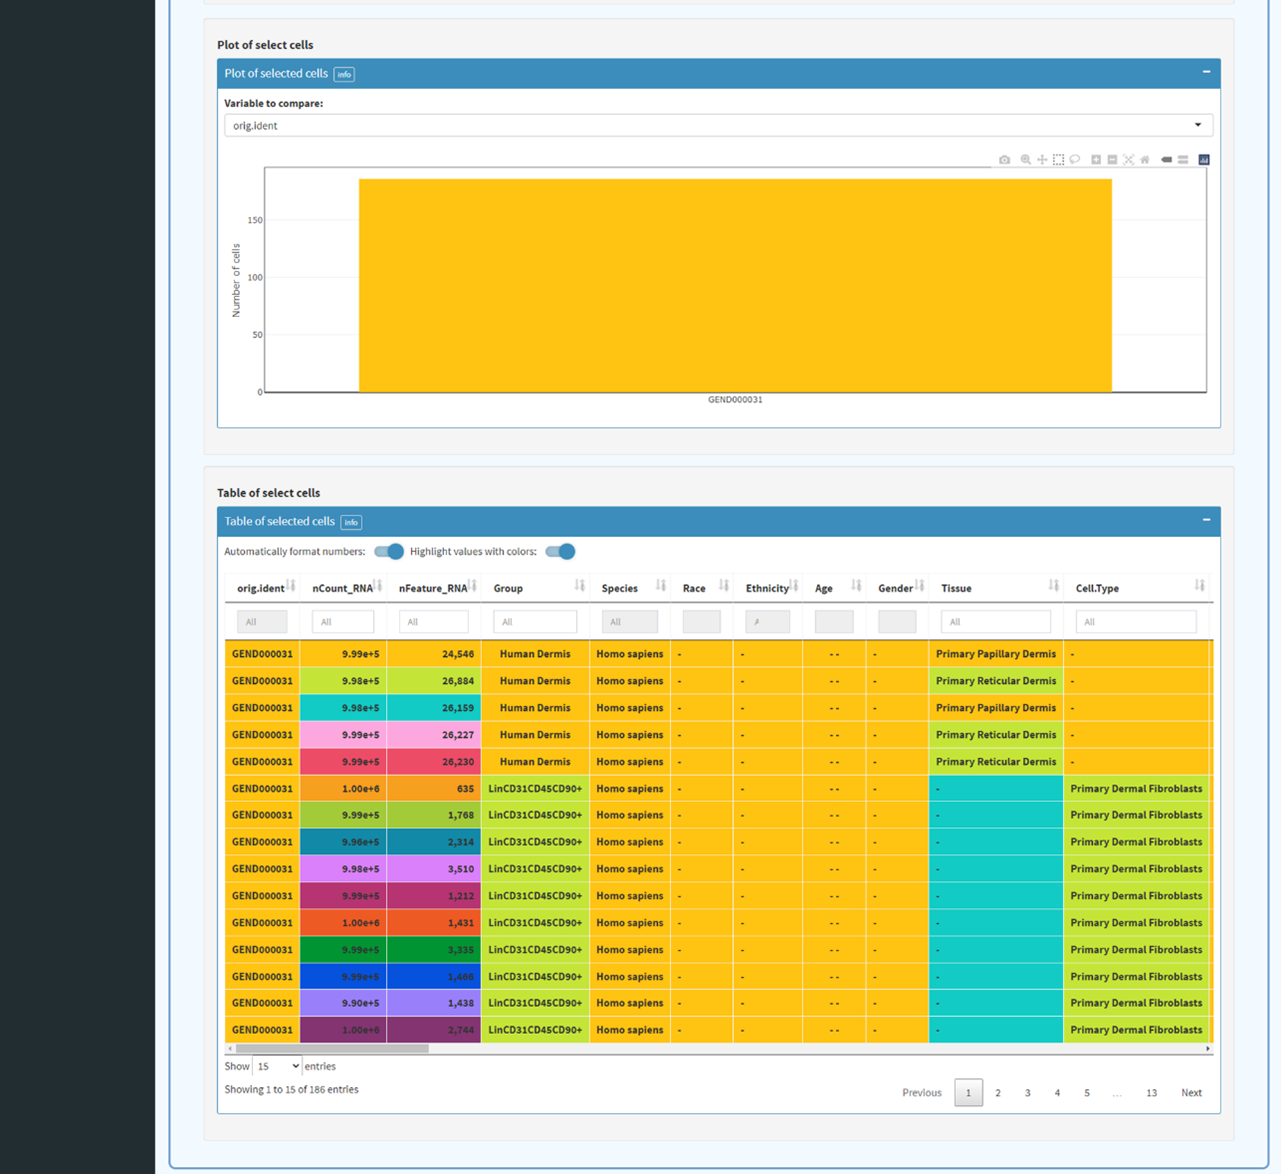
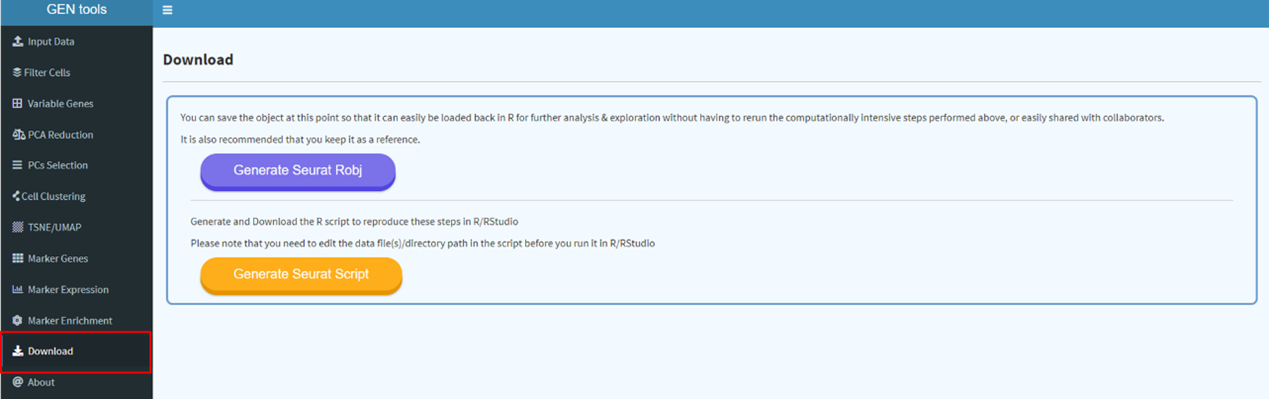
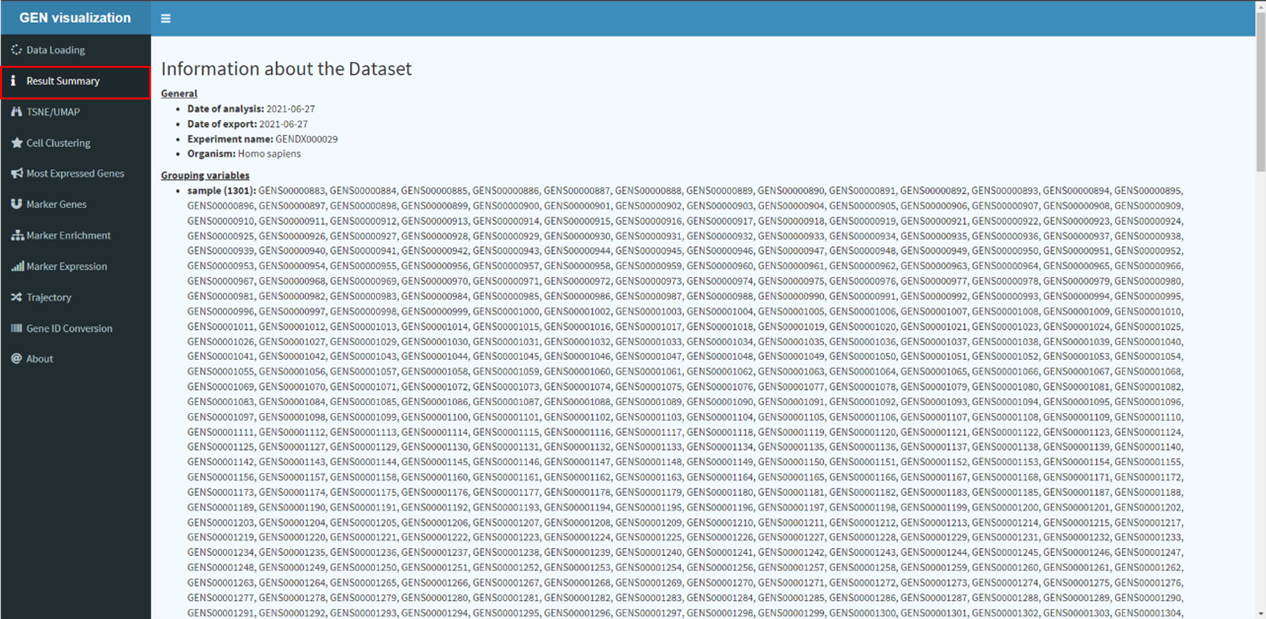
步骤 1
数据输入(包括表达谱和元信息)。根据质量控制指标选择并过滤细胞。
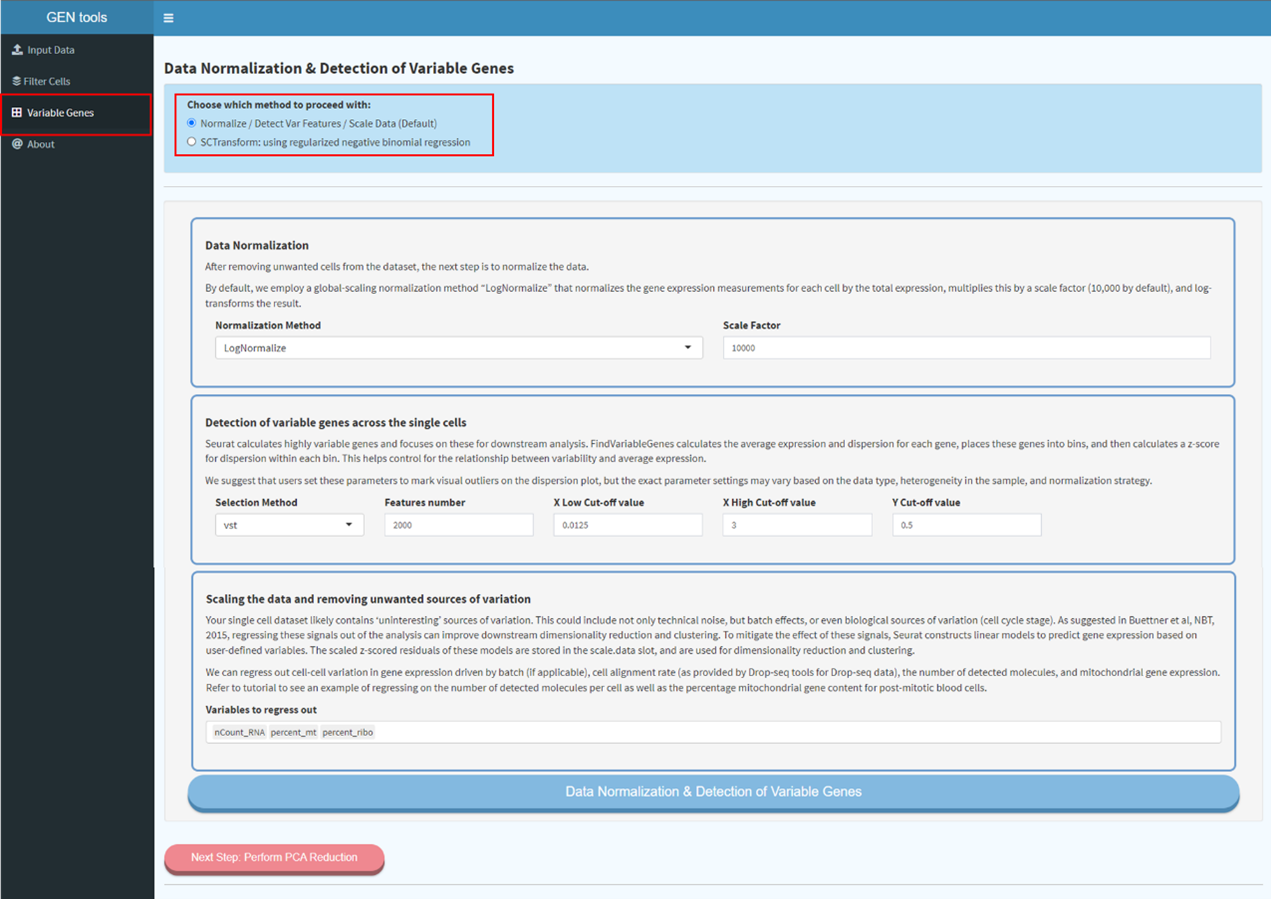
步骤 2
数据归一化和缩放。默认采用全局缩放归一化方法“LogNormalize”:以每个细胞的总表达量对该细胞的基因表达测量值进行归一化,再乘以缩放因子(默认为 10,000),最后进行对数转换。也可根据不同需求选择其他方法。
步骤 3
计算高变基因,用于后续下游分析。FindVariableGenes 会计算每个基因的平均表达量和离散度,将基因分箱,然后计算各箱内离散度的 z-score,从而有助于控制变异性与平均表达量之间的关系。
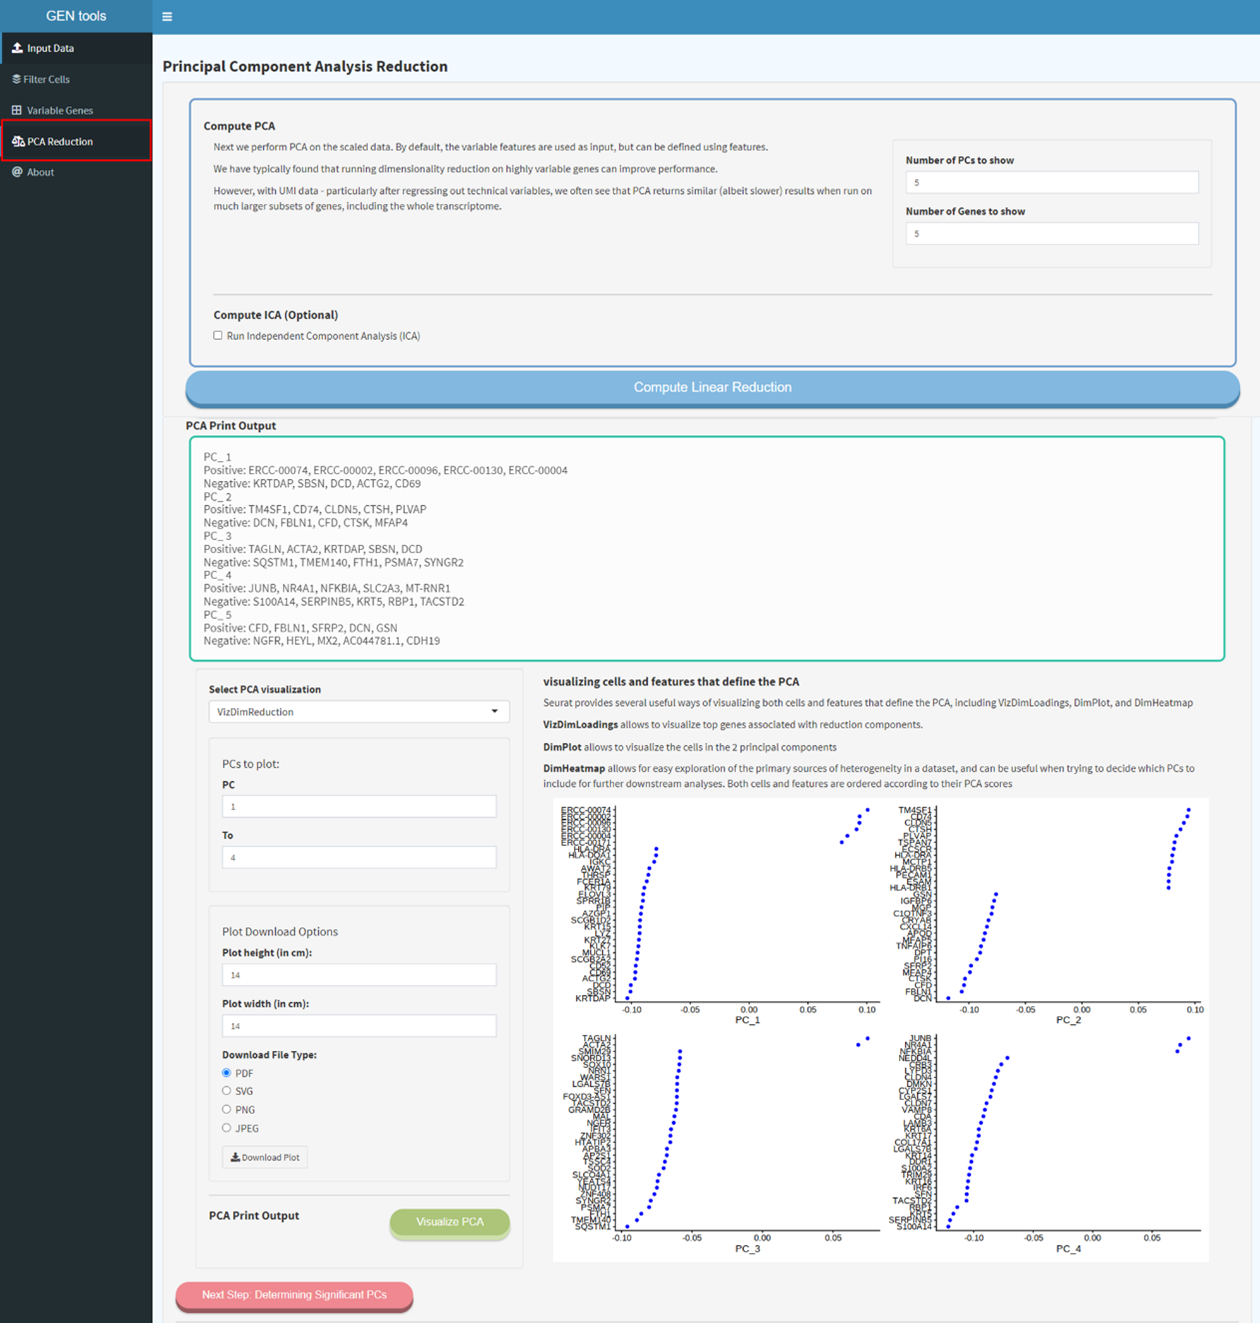
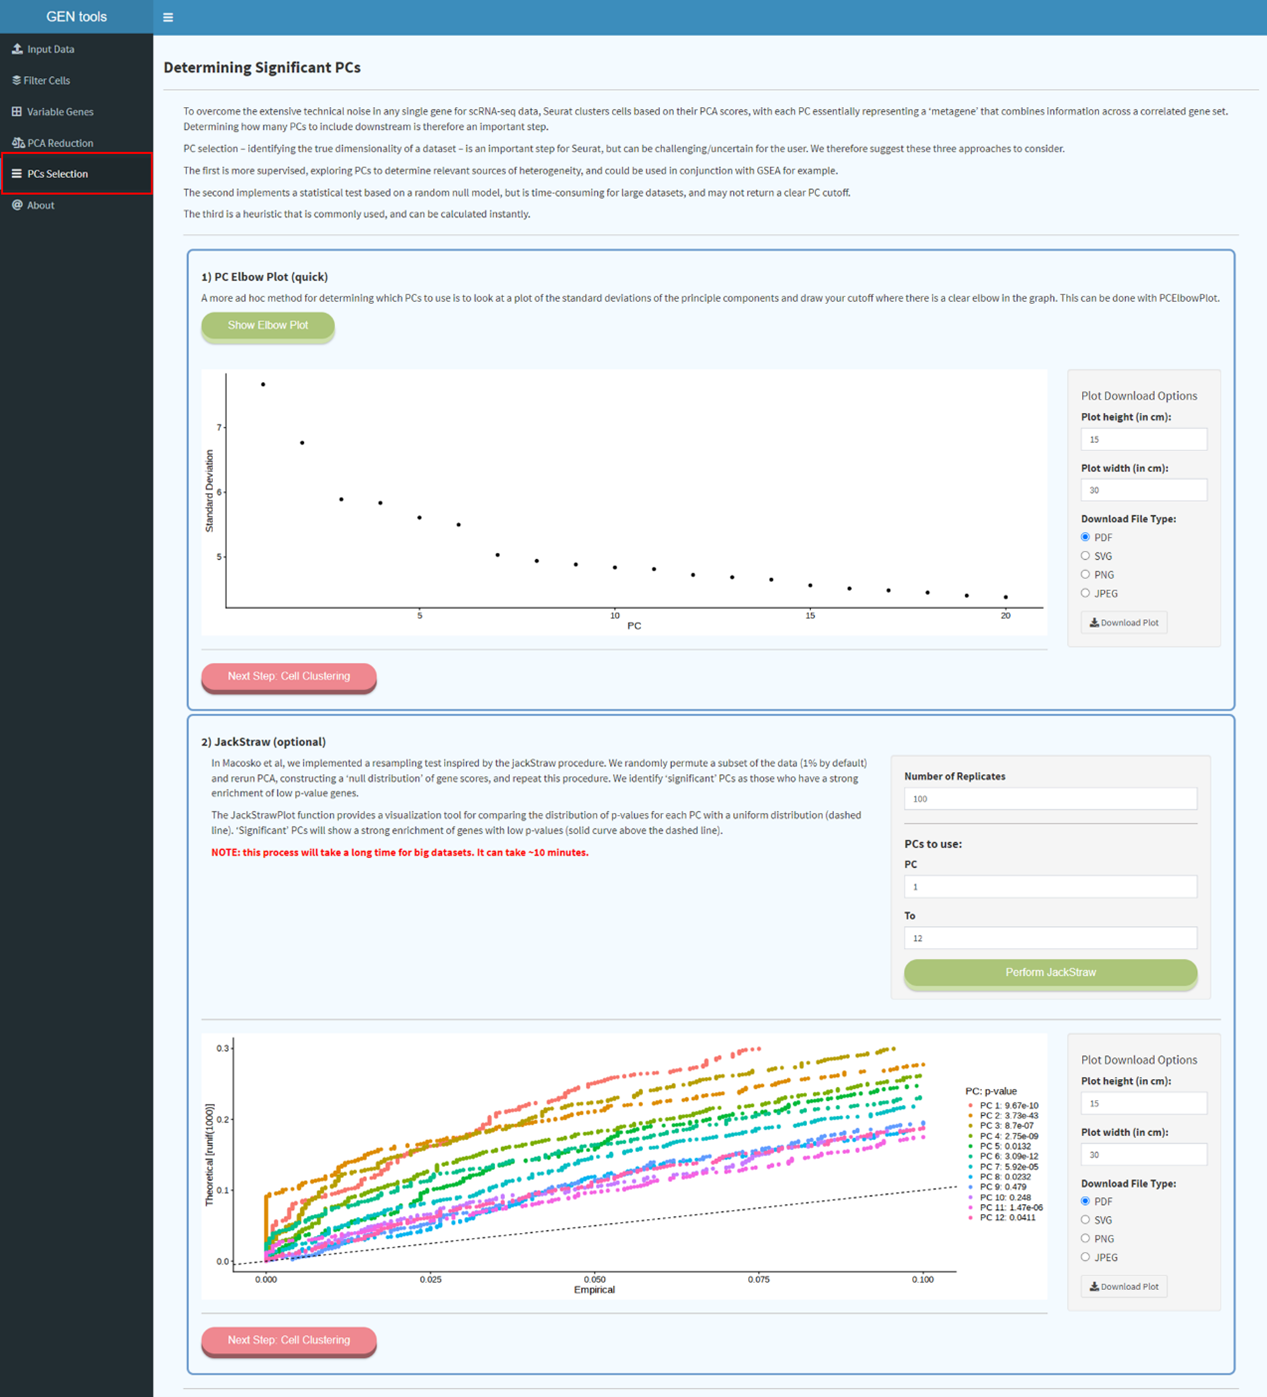
步骤 4
根据 PCA 得分确定数据集的维度。每个 PC 本质上代表一个“元特征”,整合了一组相关特征的信息。ElbowPlot 可用于判断前多少个 PC 已捕获大部分真实信号。
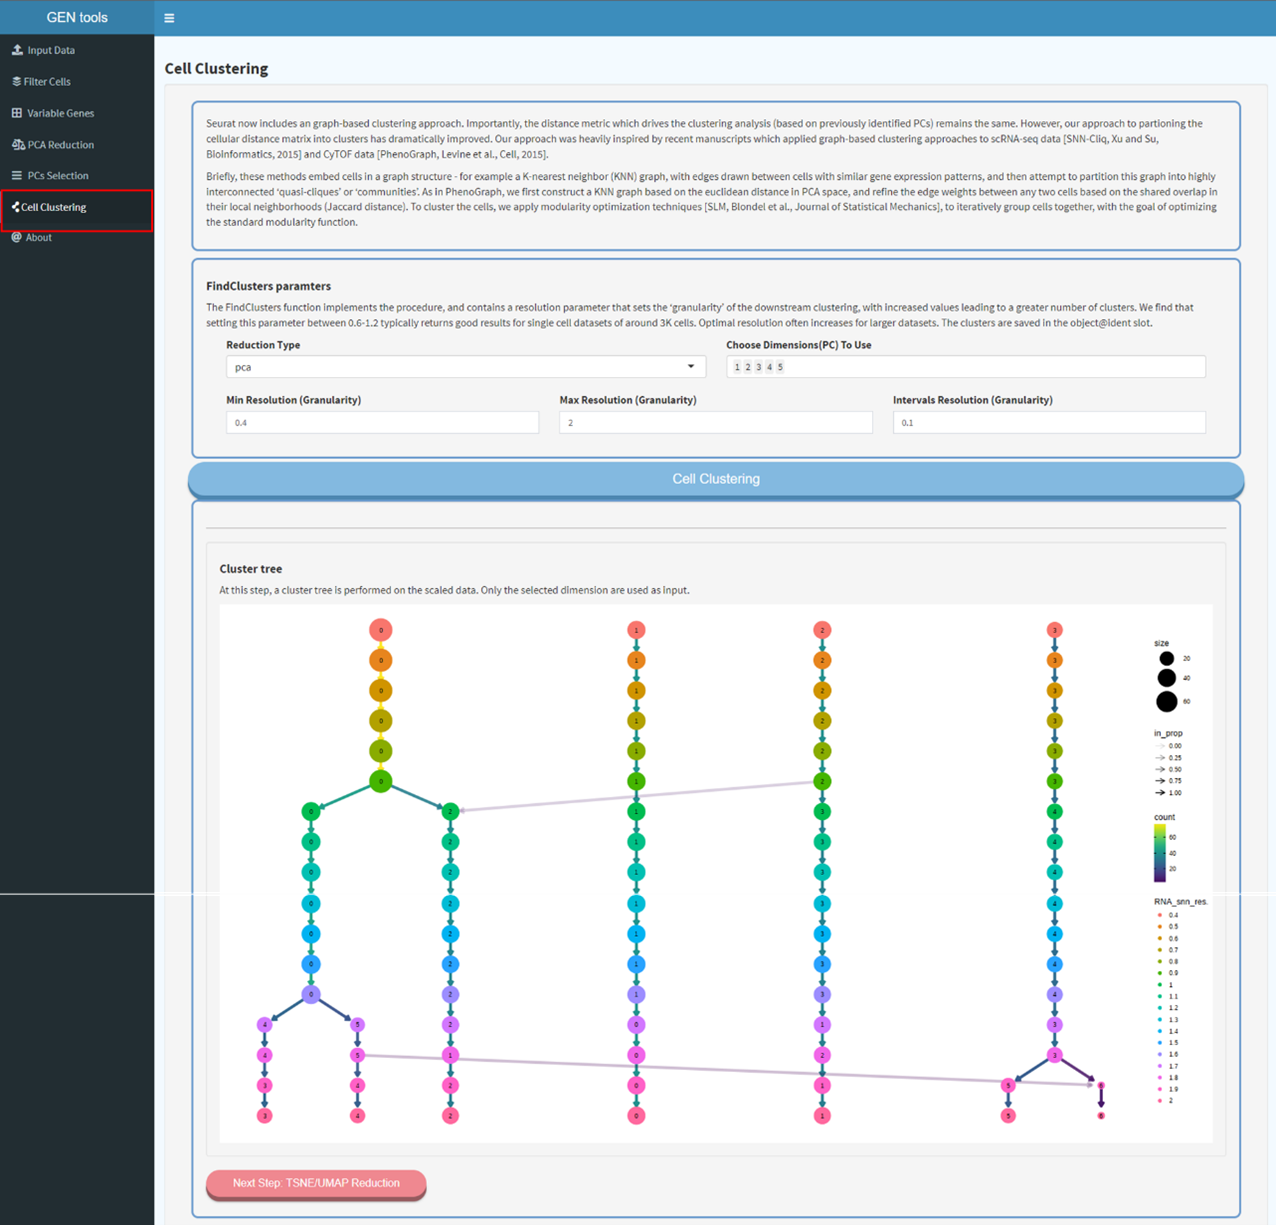
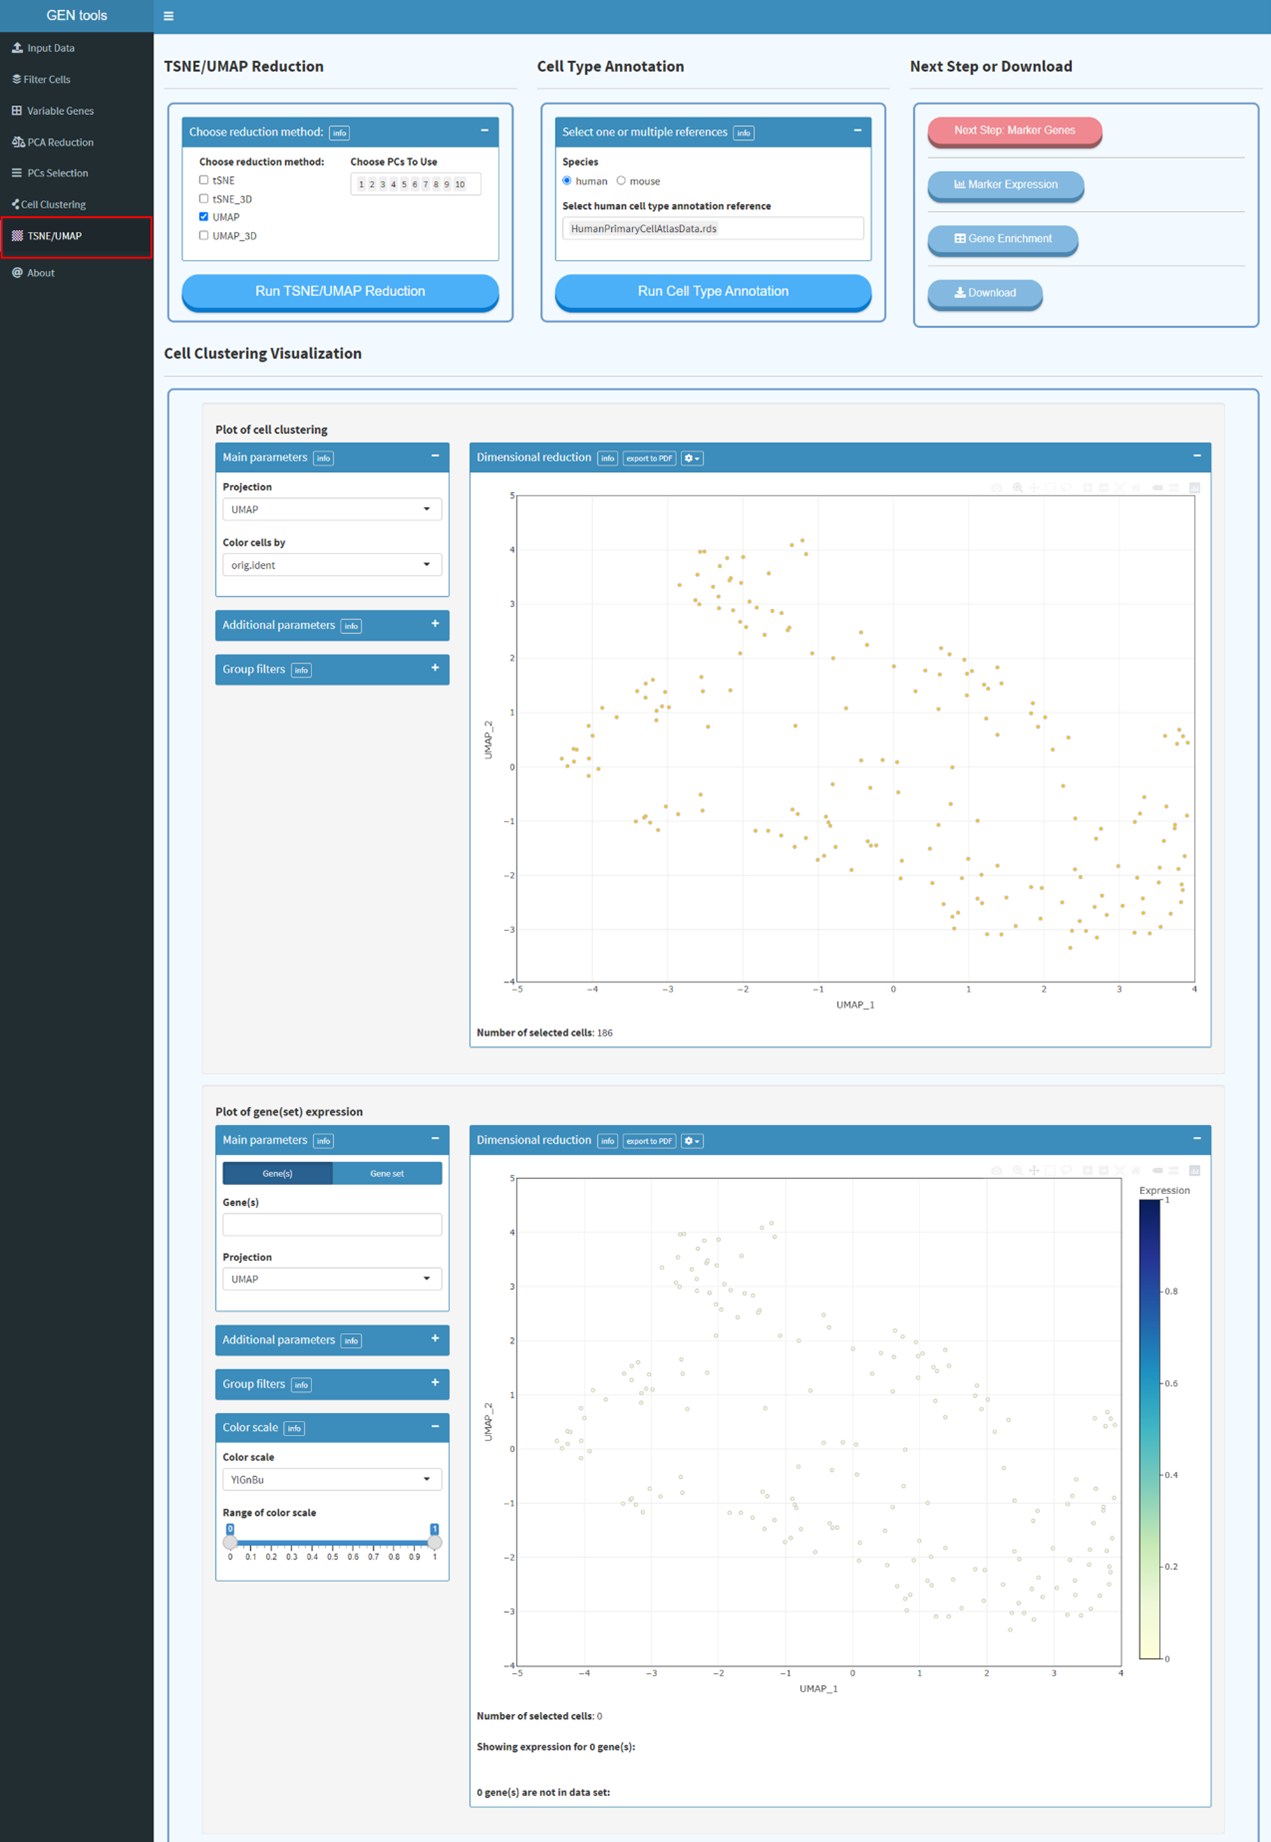
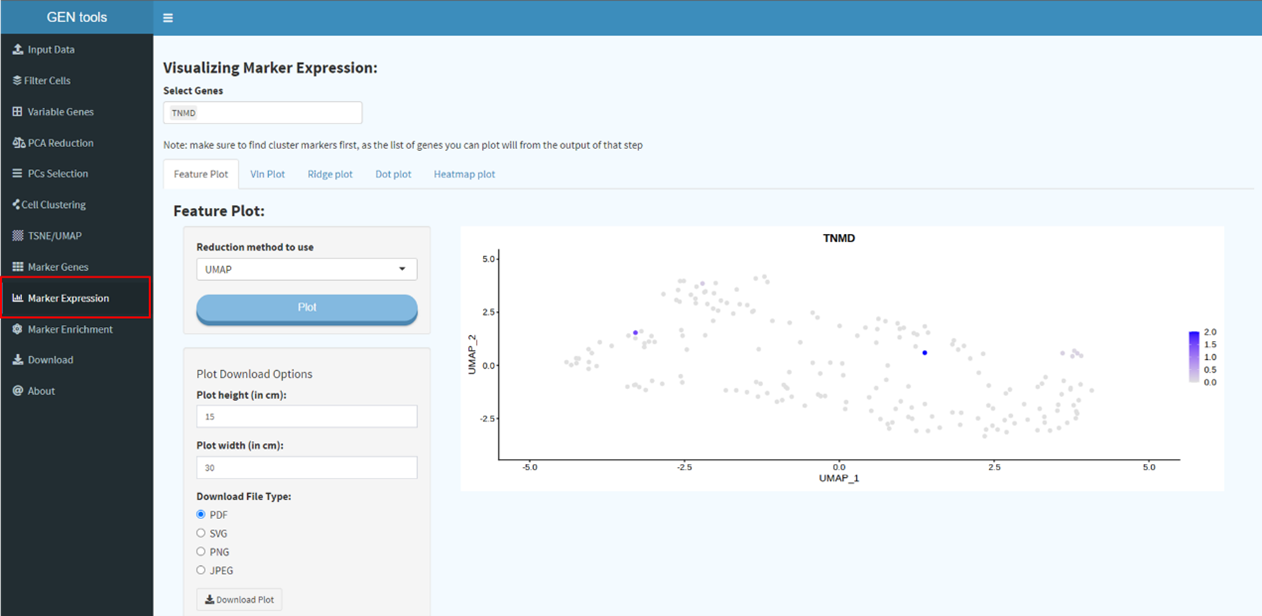
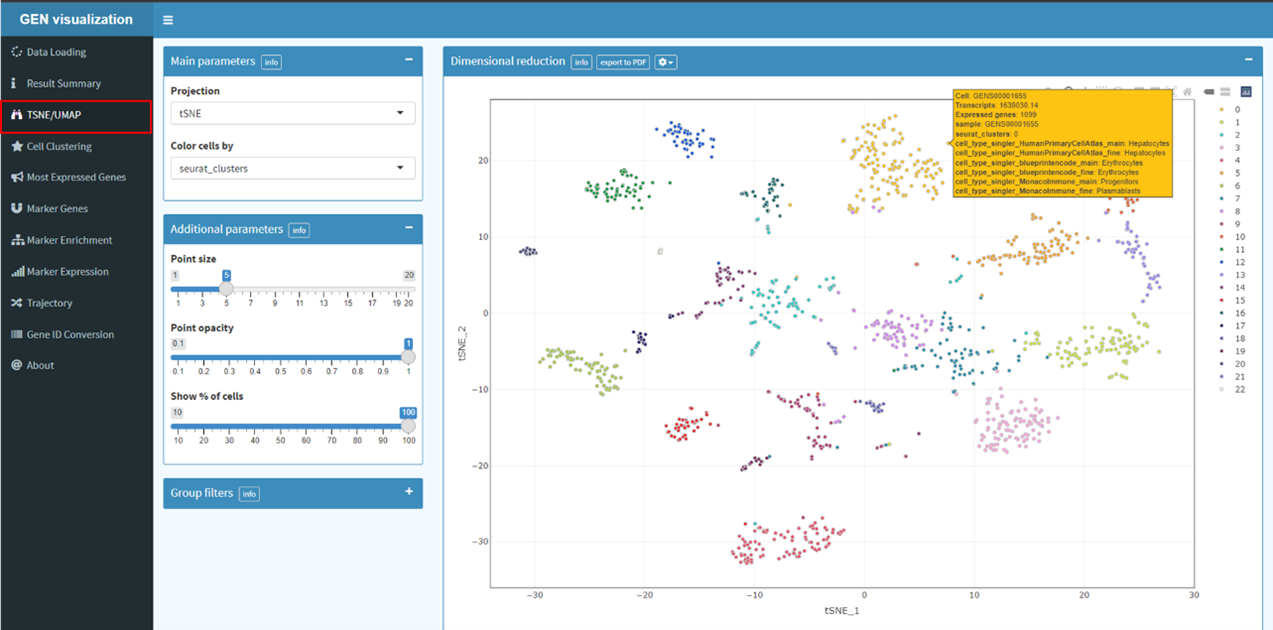
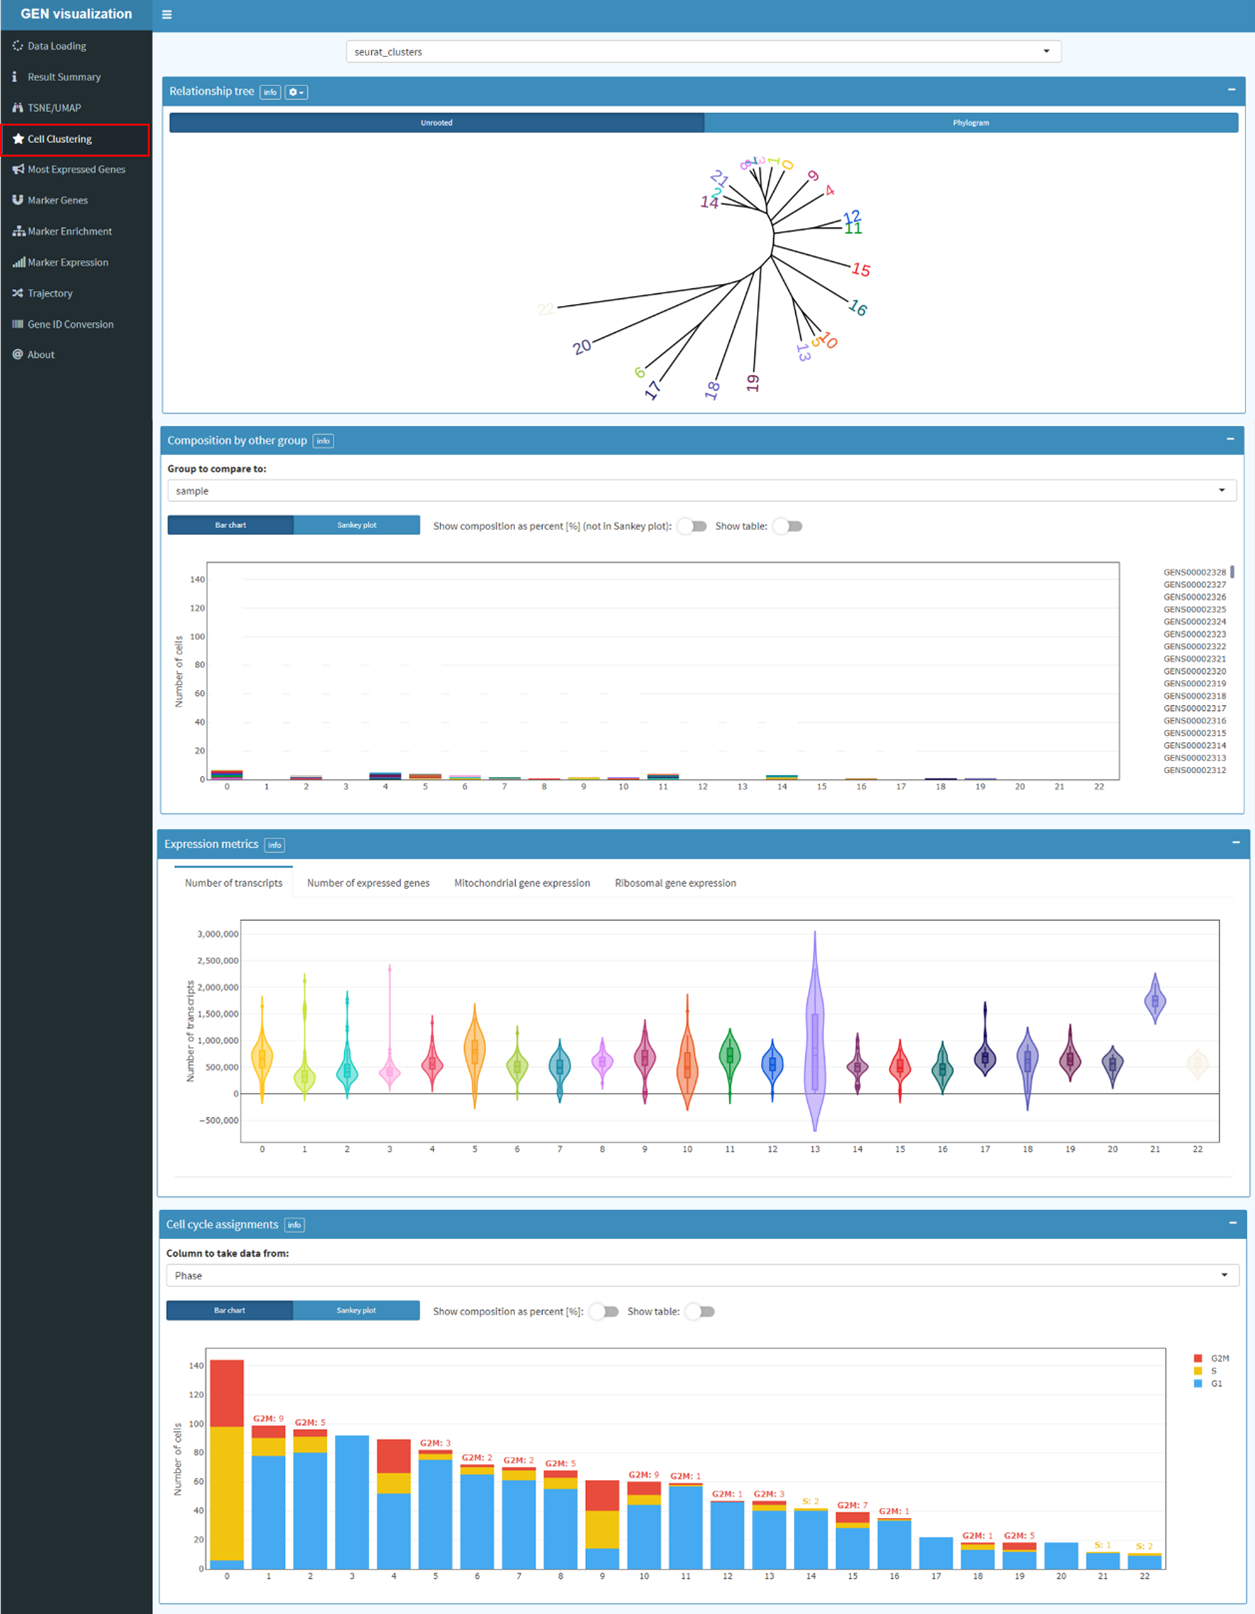
步骤 5
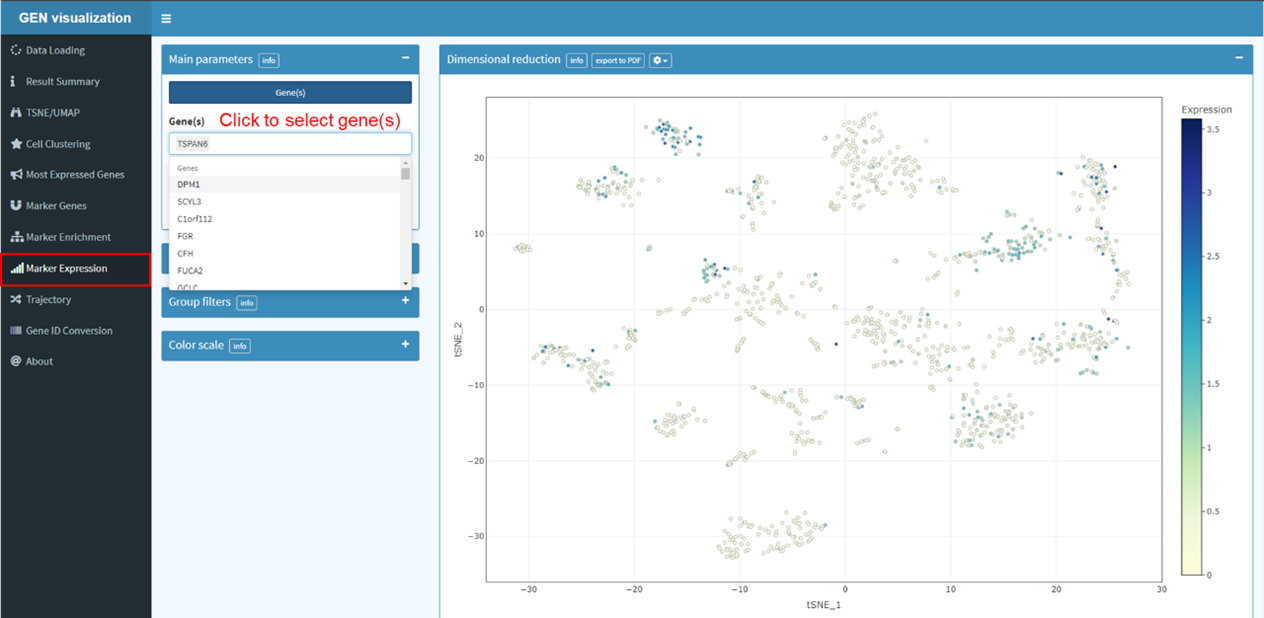
聚类树展示随着分辨率提高,细胞簇如何分裂、哪些簇彼此清晰独立、哪些簇相互关联,以及随着簇数量增加样本如何改变分组。根据聚类树结果推断的分辨率进行聚类,执行非线性降维(UMAP/tSNE),并识别差异表达特征(细胞簇生物标志物)。降维技术可将单细胞 RNA-seq 计数矩阵原本极高维度的数据(例如约 30,000 个基因 × 10,000 个细胞)表示为二维 xy 坐标。每个基因的表达水平均可在 tSNE 或 UMAP 图中可视化。
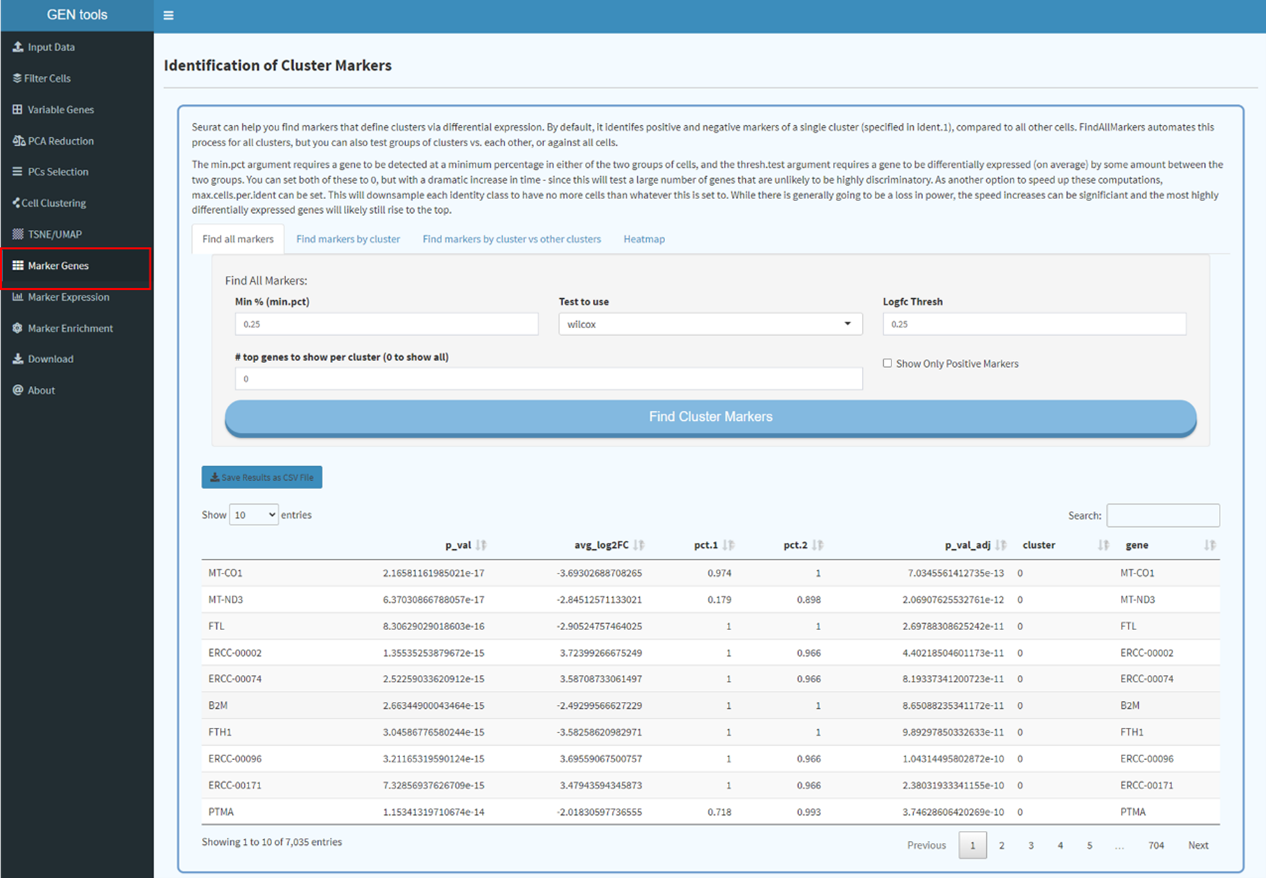
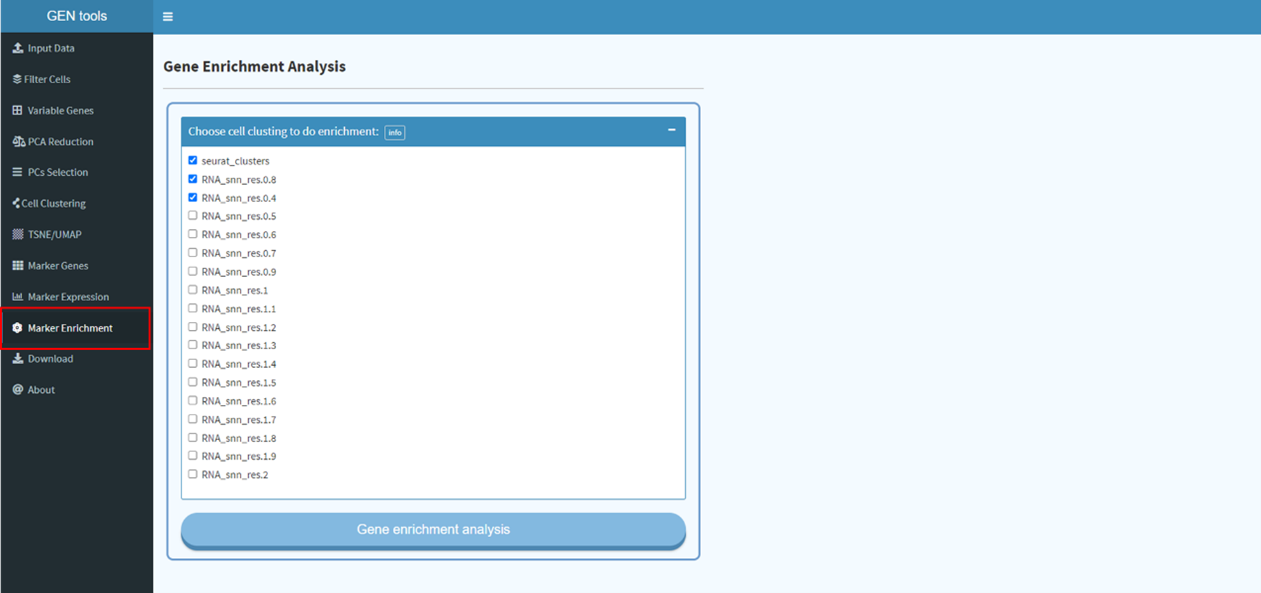
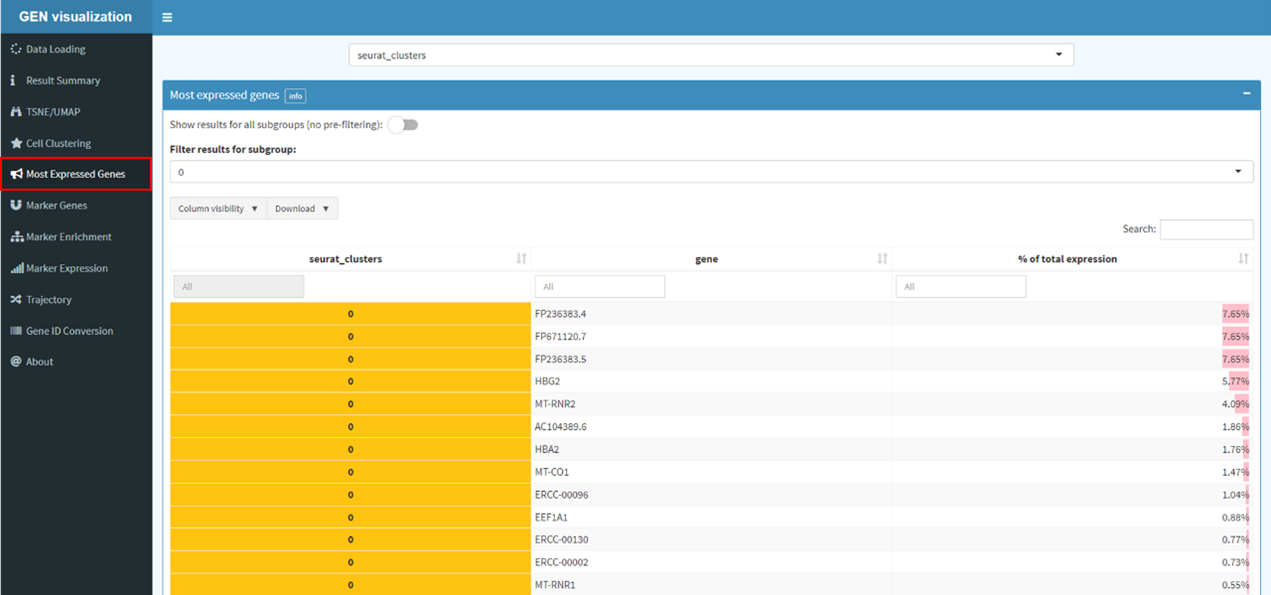
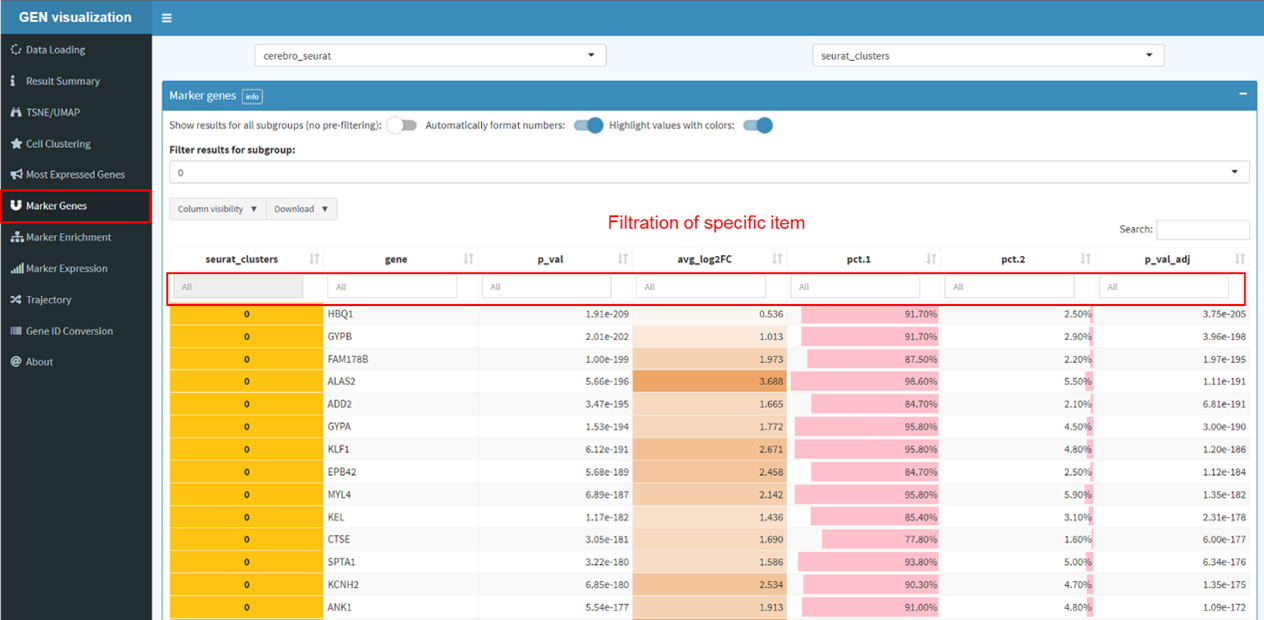
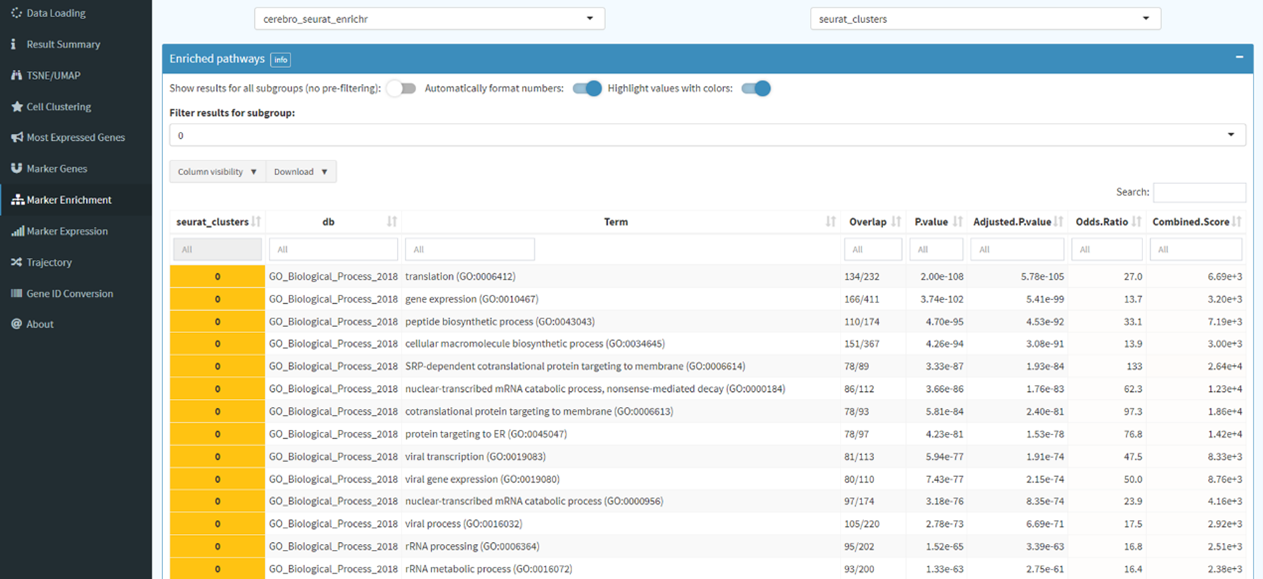
步骤 6
查找所有细胞簇的标记基因,并进行基因集富集分析。
步骤 7
轨迹推断功能由 Monocle 提供。该工具先通过差异表达检验减少基因数量,再使用独立成分分析进一步降维。构建轨迹时,Monocle 会计算最小生成树,然后找到该树中最长的连通路径。
步骤 8
细胞类型注释通常是分析 scRNA-seq 数据集的主要目标。GEN 配备 SingleR,根据某些基因仅在特定细胞簇中表达(标记基因)的规则为细胞分配标签,从而推断“细胞类型”。内置参考转录组数据集包括 5 个人类数据集和 2 个小鼠数据集,具体如下:
(1) Human Primary Cell Atlas(Mabbott 等,2013):基于 713 个微阵列数据样本,包含 37 种主要非特异性细胞类型和 157 种精细细胞类型;Consortium 2012 数据集:基于 259 个 RNA-seq 样本,包含 24 种主要非特异性细胞类型和 43 种精细细胞类型。
(2) Blueprint(Martens 和 Stunnenberg,2013)与 ENCODE(The ENCODE Project Consortium,2012)数据集:基于 259 个 RNA-seq 样本,包含 24 种主要非特异性细胞类型和 43 种精细细胞类型。
(3) Monaco Immune Dataset(Monaco 等,2019):基于 114 个 RNA-seq 样本,包含 11 种主要免疫细胞类型和 29 种精细细胞类型。
(4) Novershtern Hematopoietic Dataset(Novershtern 等,2011;Monaco 等,2019):基于 211 个微阵列数据样本,包含 17 种主要免疫细胞类型和 38 种精细细胞类型。
(5) Database Immune Cell Expression Dataset(Schmiedel 等,2018):基于 1,561 个 RNA-seq 样本,包含 5 种主要造血和免疫细胞类型及 15 种精细细胞类型。
(6) Immunological Genome Project(ImmGen)(Heng 等,2008):基于 830 个微阵列数据样本,包含 20 种主要造血和免疫细胞类型及 253 种精细细胞类型。
(7) Mouse RNA-seq Dataset(Benayoun 等,2019):基于 358 个 RNA-seq 样本,包含 18 种非特异性细胞类型和 28 种精细细胞类型。
参考文献:
Stuart T, Butler A, Hoffman P, et al. Comprehensive
Integration of Single-Cell Data. Cell. 2019, 177(7):1888-1902. e21.
PMID:31178118
Aran D, Looney AP, Liu L, et al. Reference-based
analysis of lung single-cell sequencing reveals a transitional profibrotic macrophage.
Nat Immunol. 2019,20(2):163-172.
PMID:30643263
Mabbott N A, Baillie J K, Brown H, et al. An expression atlas of human
primary cells: inference of gene function from coexpression networks.
BMC genomics. 2013, 14(1): 1-13.
PMID:24053356
Martens J H A, Stunnenberg H G. BLUEPRINT: mapping human blood cell
epigenomes.
Haematologica. 2013, 98(10): 1487.
PMID:24091925
Monaco G, Lee B, Xu W, et al. RNA-Seq signatures normalized by mRNA abundance
allow absolute deconvolution of human immune cell types.
Cell reports, 2019, 26(6): 1627-1640. e7.
PMID:30726743
Novershtern N, Subramanian A, Lawton L N, et al. Densely interconnected
transcriptional circuits control cell states in human hematopoiesis.
Cell, 2011, 144(2): 296-309.
PMID:21241896
Schmiedel B J, Singh D, Madrigal A, et al. Impact of genetic polymorphisms on
human immune cell gene expression.
Cell, 2018, 175(6): 1701-1715. e16.
PMID:30449622
Heng T S P, Painter M W, Elpek K, et al. The Immunological Genome Project:
networks of gene expression in immune cells.
Nature immunology, 2008, 9(10): 1091-1094.
PMID:18800157
Benayoun B A, Pollina E A, Singh P P, et al. Remodeling of epigenome and
transcriptome landscapes with aging in mice reveals widespread induction of inflammatory
responses.
Genome research, 2019, 29(4): 697-709.
PMID:30858345
使用手册
请下载 GEN 使用手册。
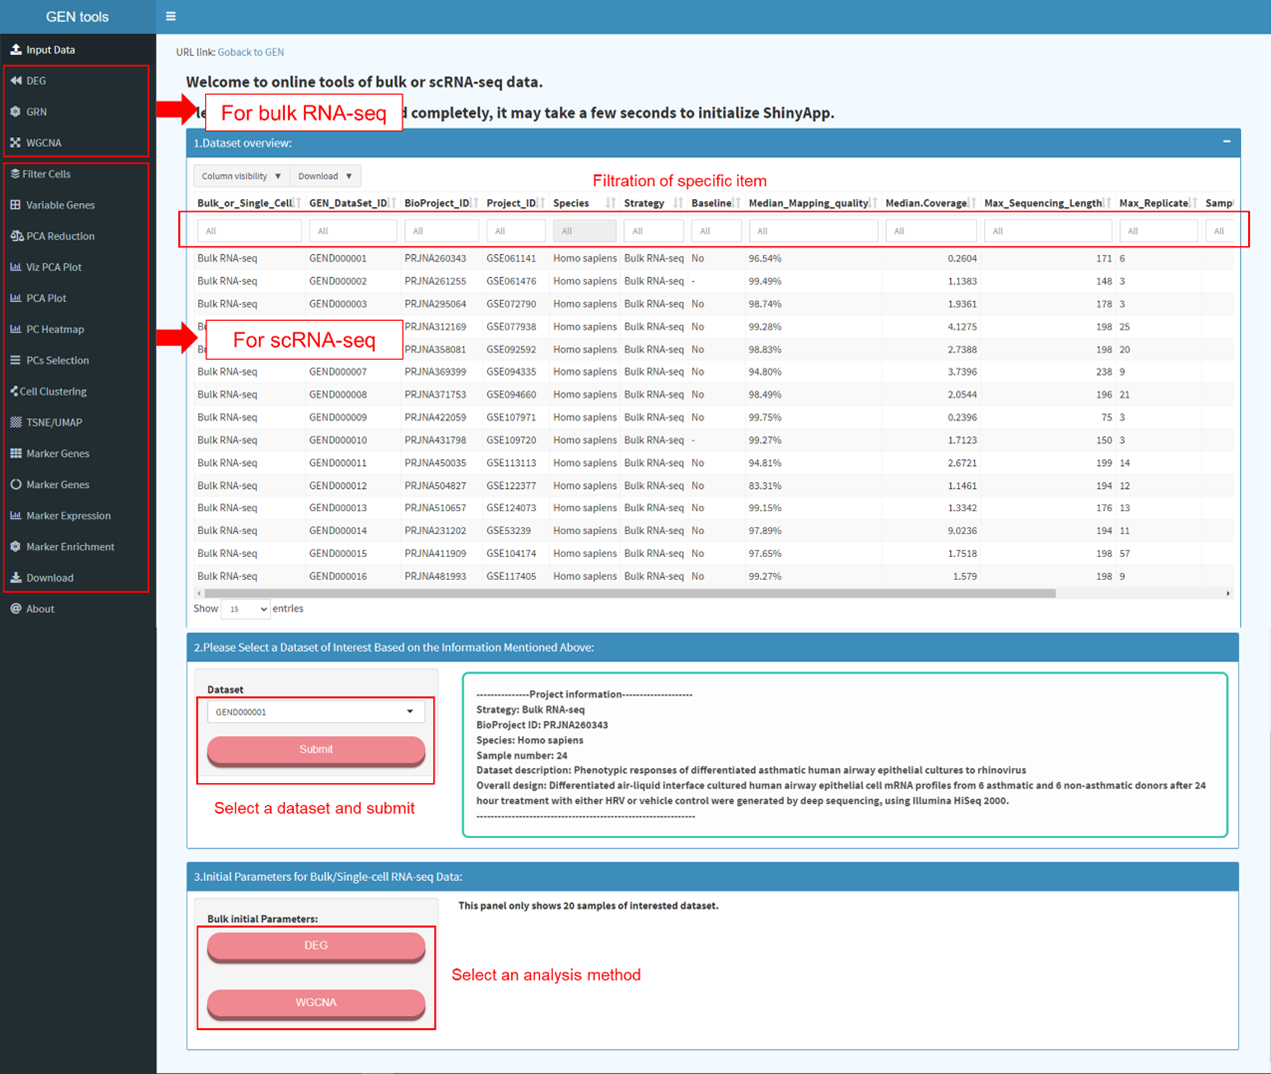
首页概述 GEN 已整合的全部基因表达数据或元数据,以及已实现的主要功能。用户可点击导航栏中的各项内容,或在查询框中输入关键词以检索感兴趣的信息。 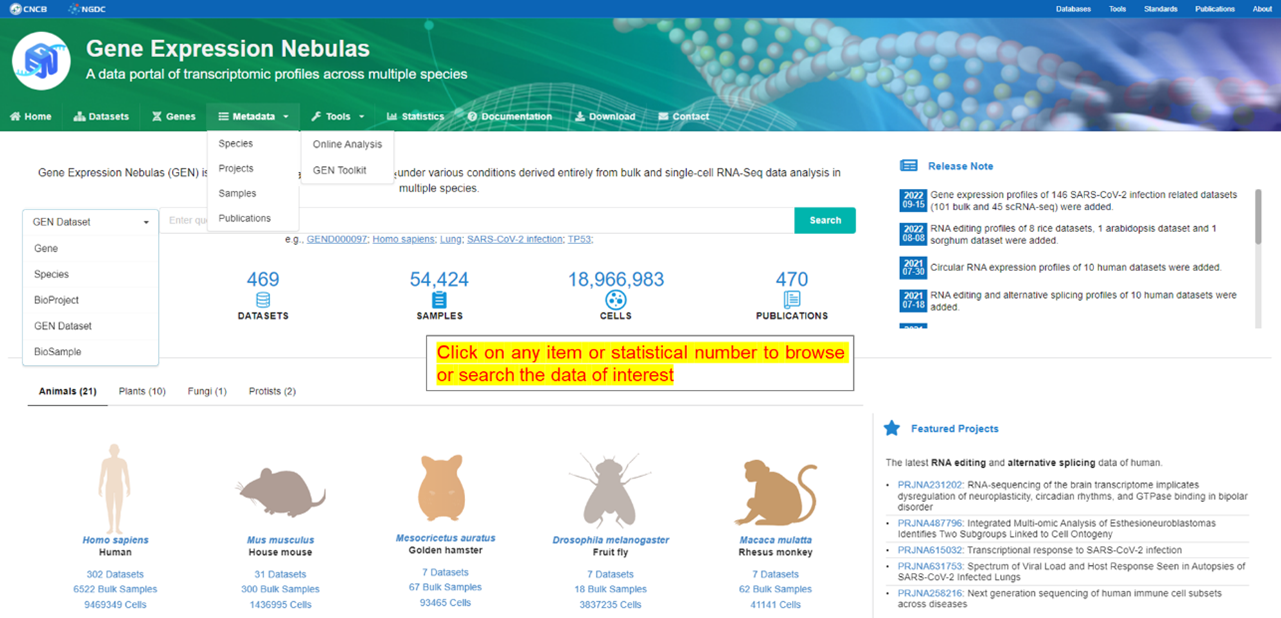
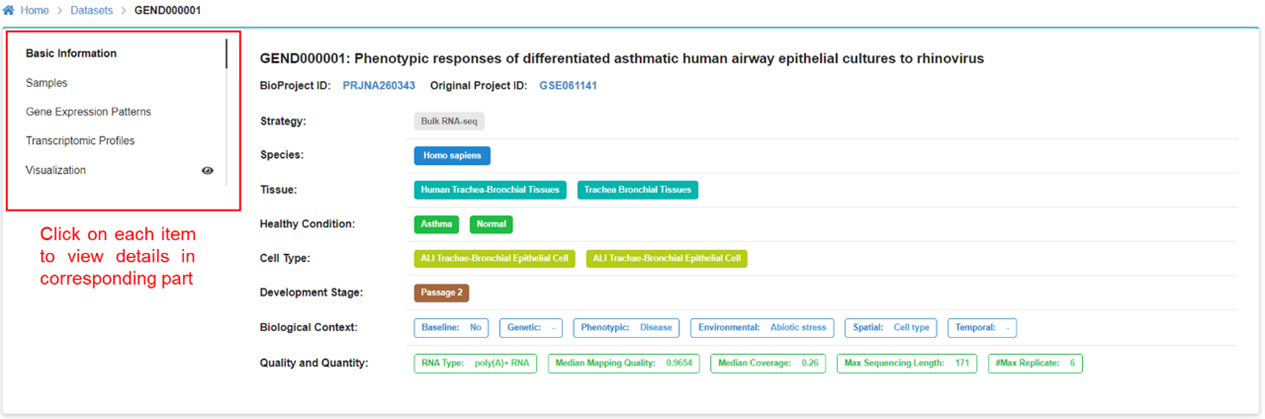
数据集页面展示 GEN 中各数据集的详细描述性元信息。用户可通过上方筛选框筛选特定数据集。 在左侧面板中,用户可通过自定义的“生物学背景”“动物组织”“人类疾病”和“转录组谱”等项目筛选感兴趣的数据集
。用户可以点击相应项目,快速查找相关的目标数据集。 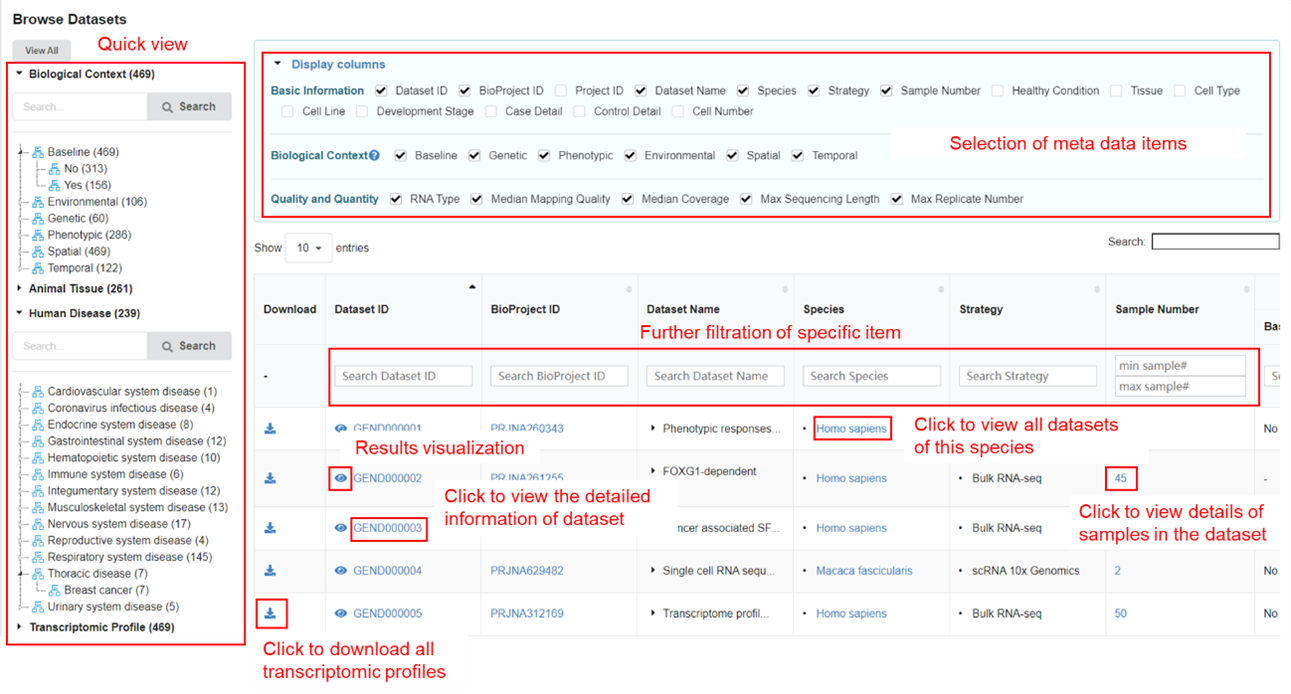
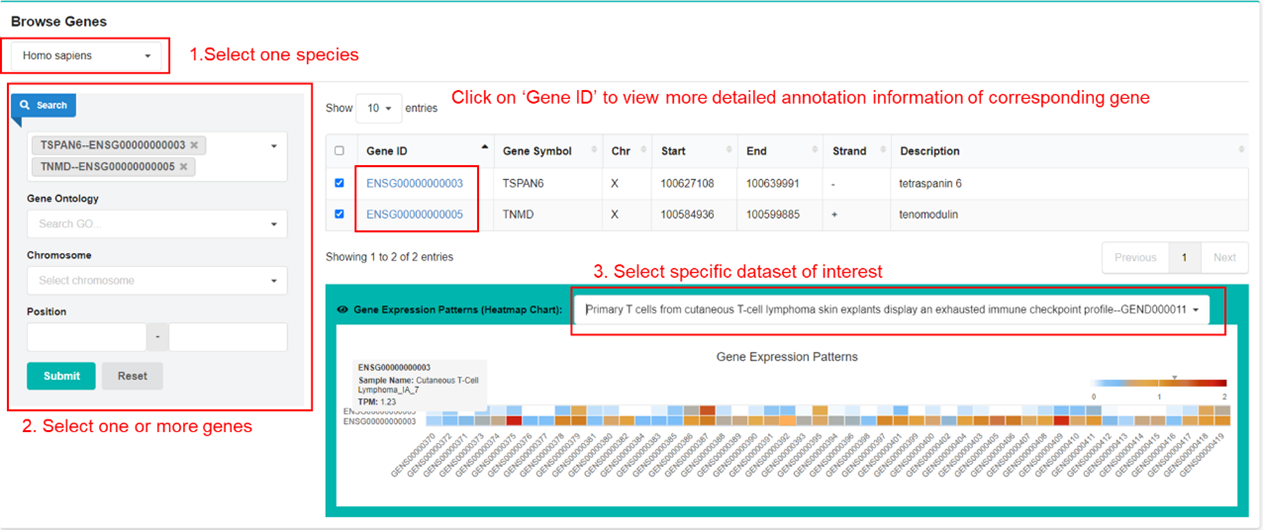
用户可浏览 GEN 数据集中不同样本的基因表达模式。首先,点击选择一个物种;其次,选择一个或多个感兴趣的基因,默认选择全部基因;最后,选择一个感兴趣的数据集以查看基因表达谱。
物种页面介绍 GEN 中已整理物种的元数据。用户可查看 GEN 中特定物种的数据集总数和样本总数。

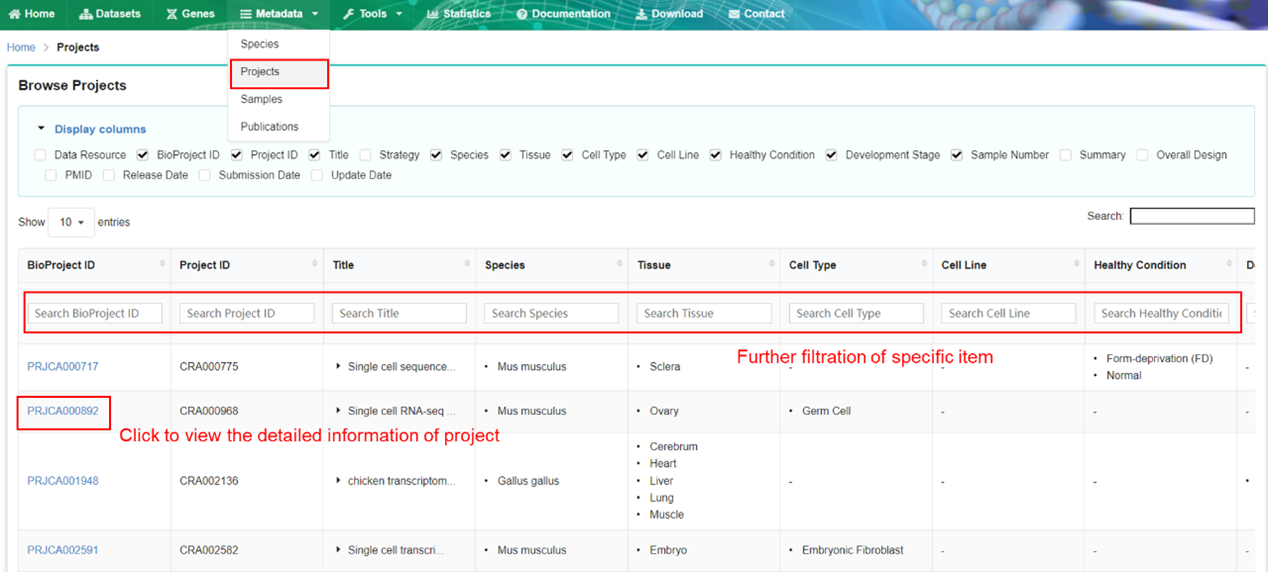
项目页面提供 GEN 中各项目的详细元数据。用户可通过指定感兴趣的术语进一步筛选项目元数据。
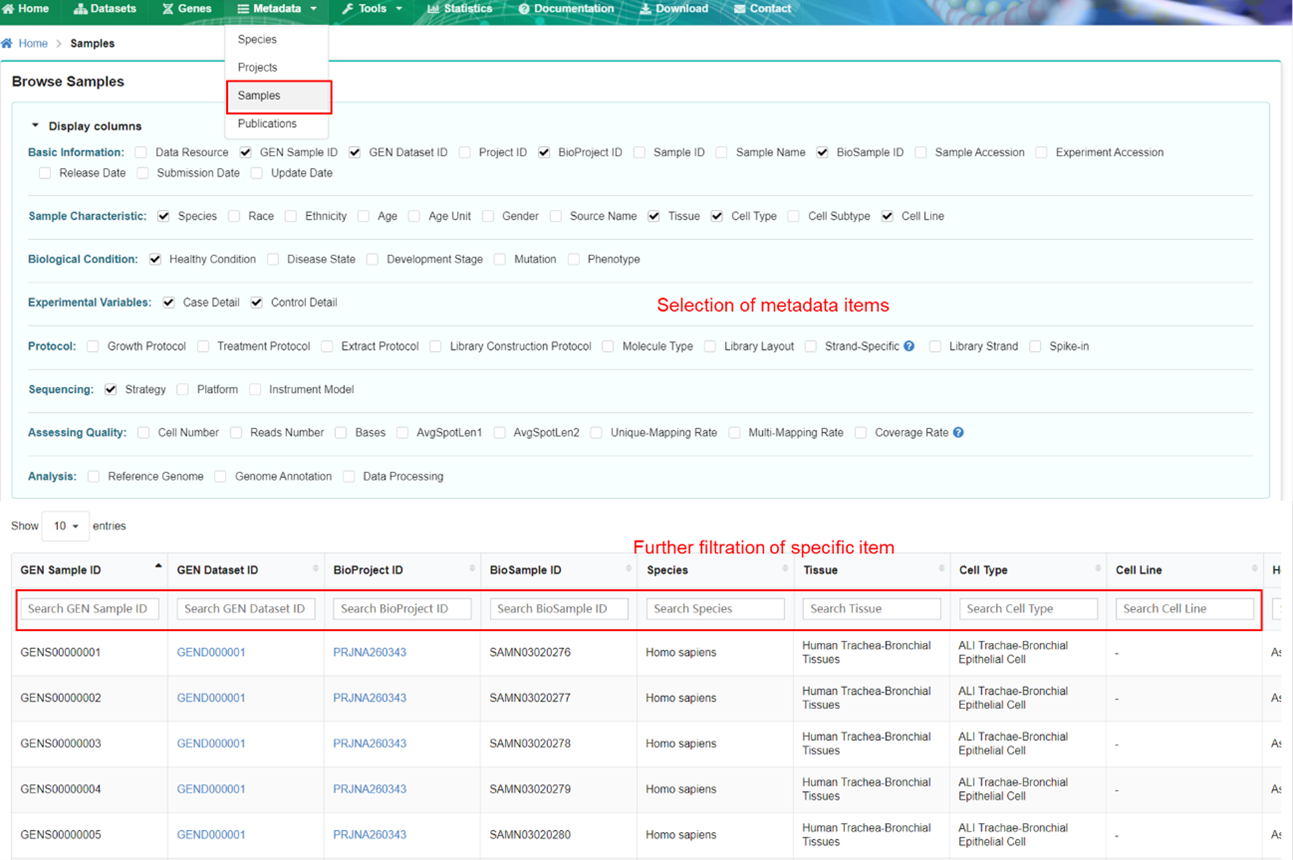
样本页面介绍 GEN 中各样本的详细元数据。用户可通过指定感兴趣的术语进一步筛选样本元数据。
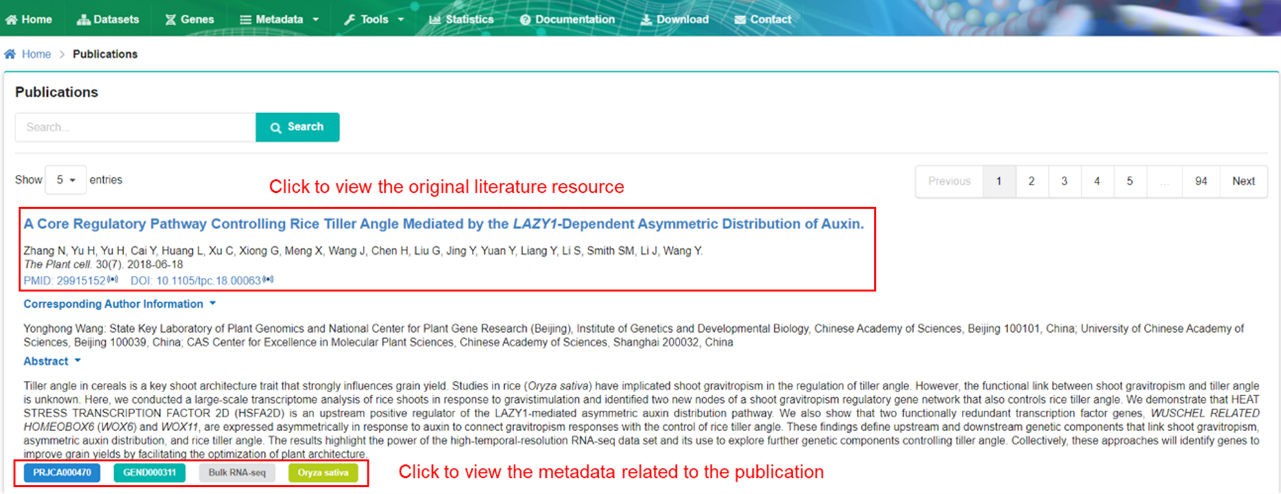
文献页面提供与数据集相关出版物的基本信息。