About
LeukAtlas provides various CNV analysis tools, facilitating users to upload, download, and query leukemia CNV information, providing a comprehensive platform for CNV analysis in leukemia research.
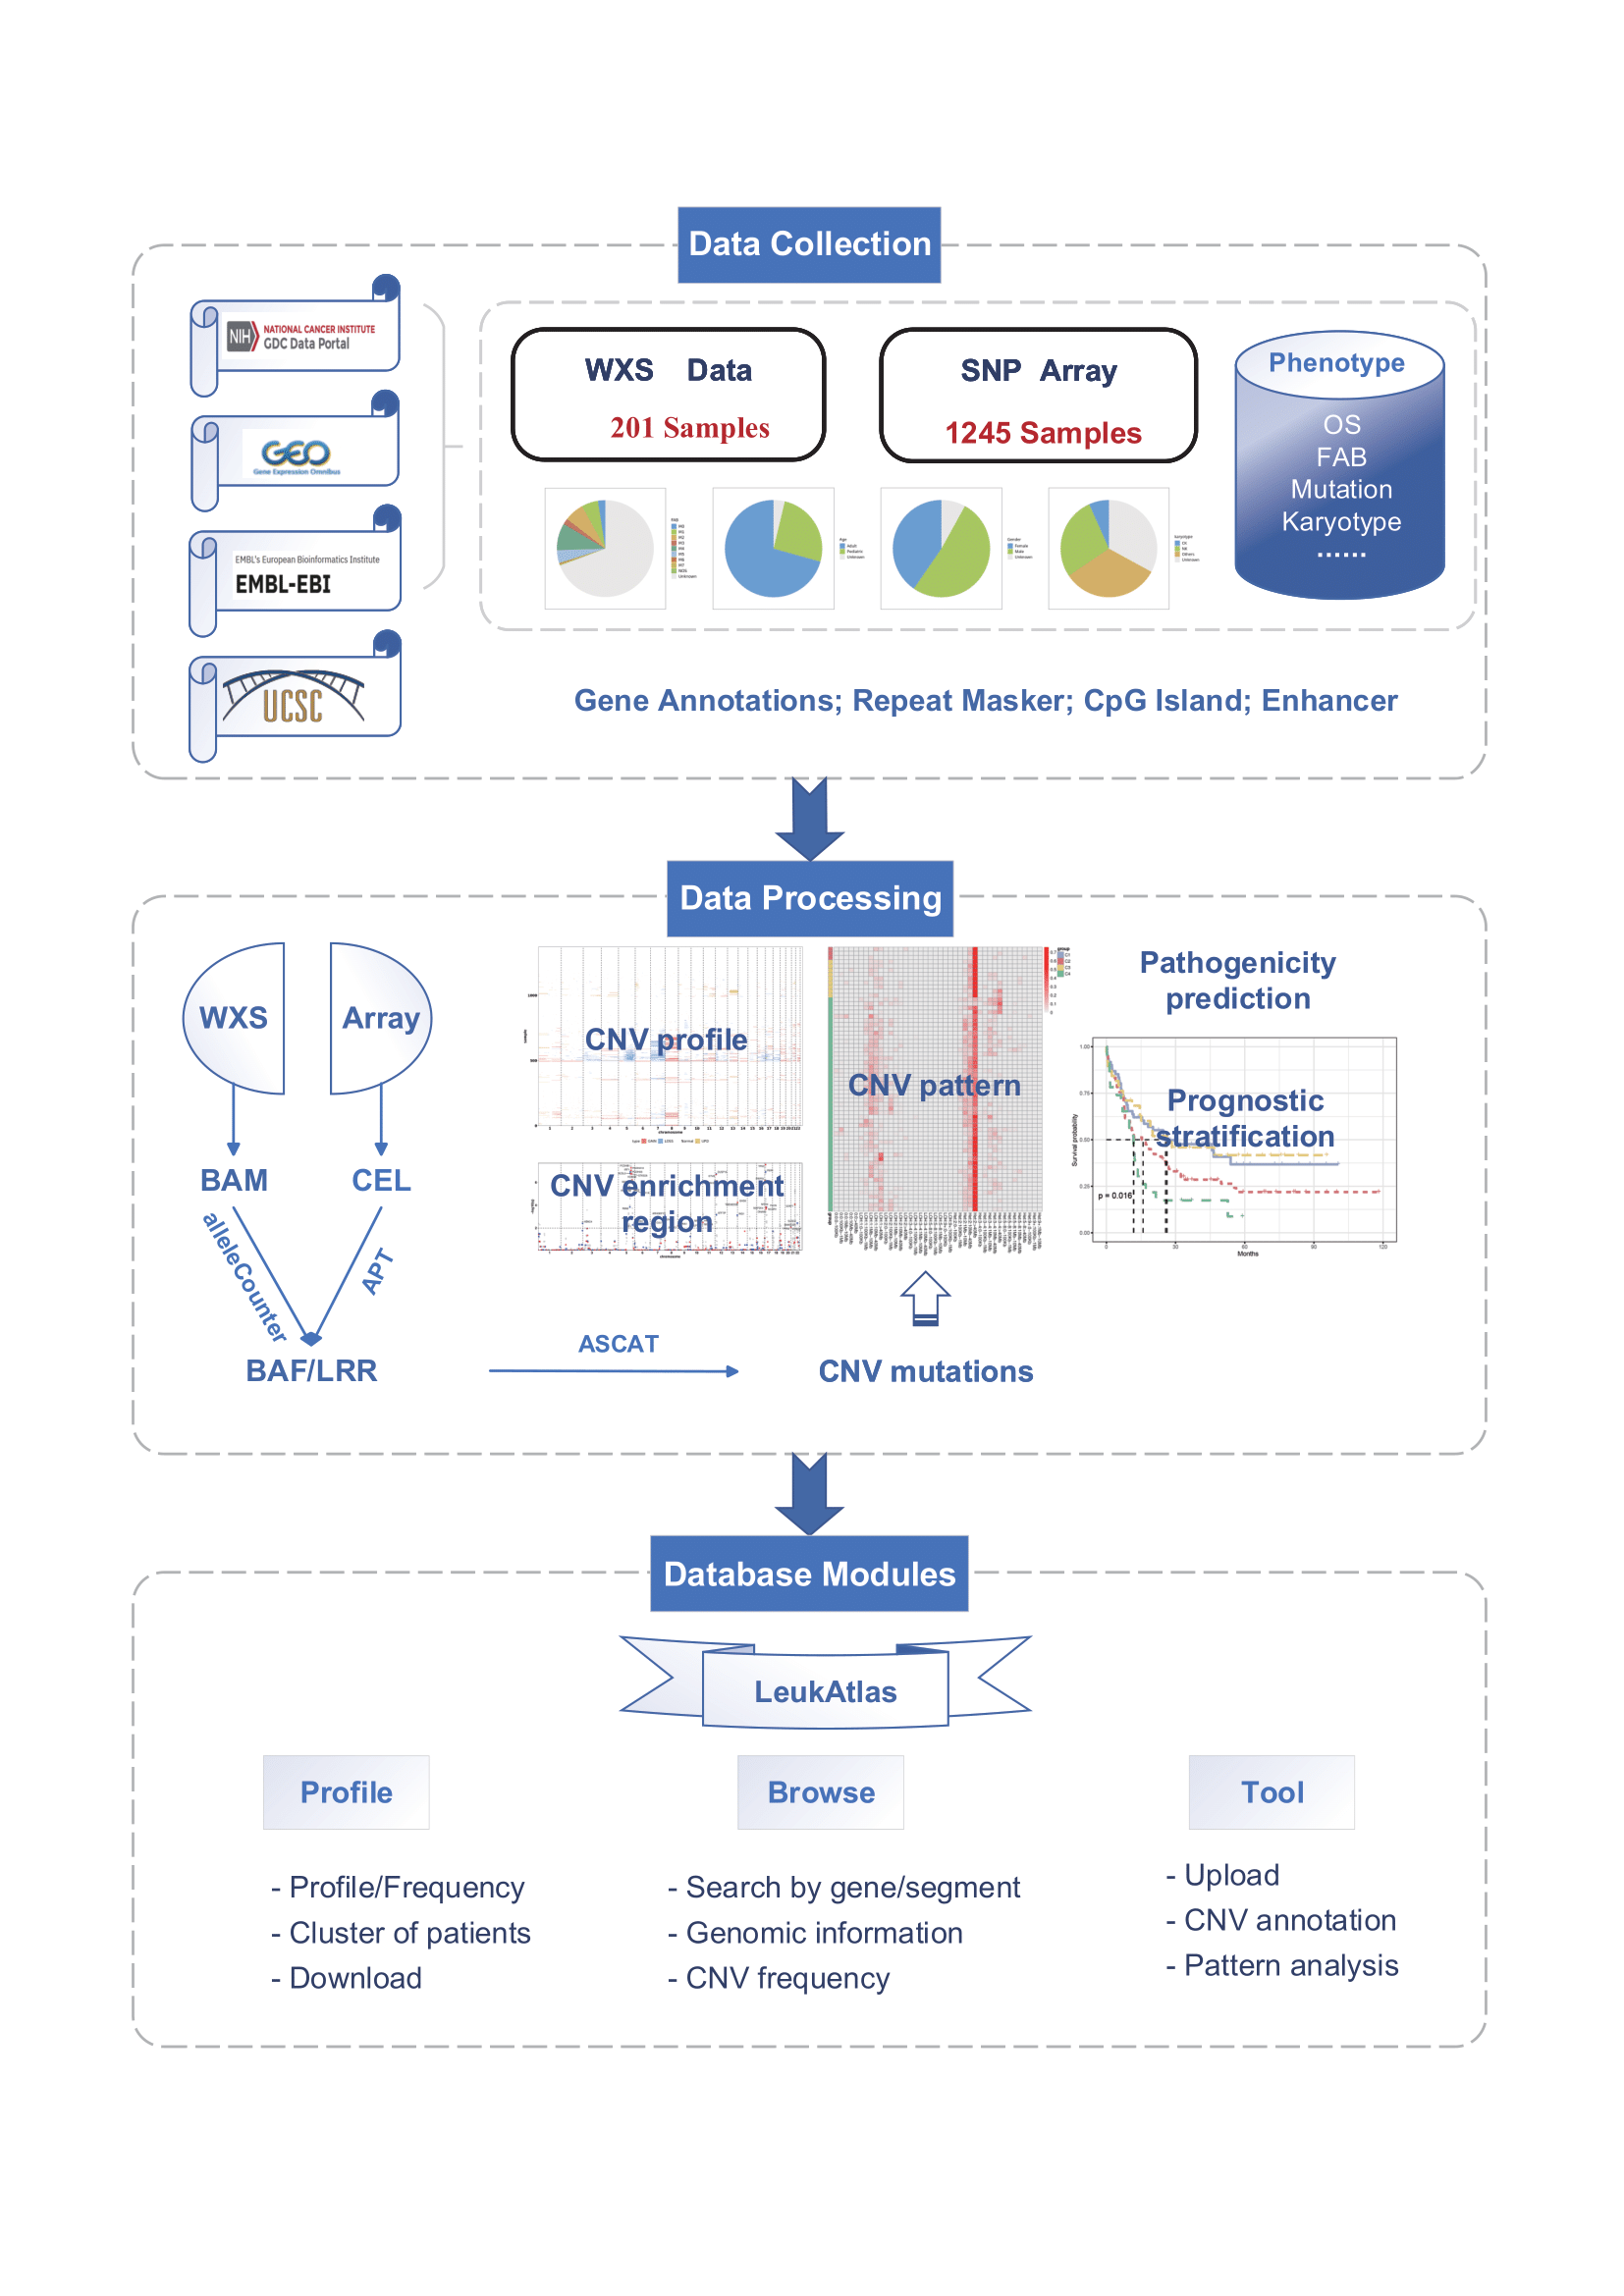
Data Collection. The WXS data and SNP Array data were obtained from public databases and literature, along with corresponding phenotype information.
Data Processing. The identified CNV mutations were mined for comprehensive analysis, including CNV patterns, profiles, pathogenicity, enrichment region, and prognosis stratification.
Database Modules. LeukAtlas includes three main function modules: Profile, Browse, and Tool.
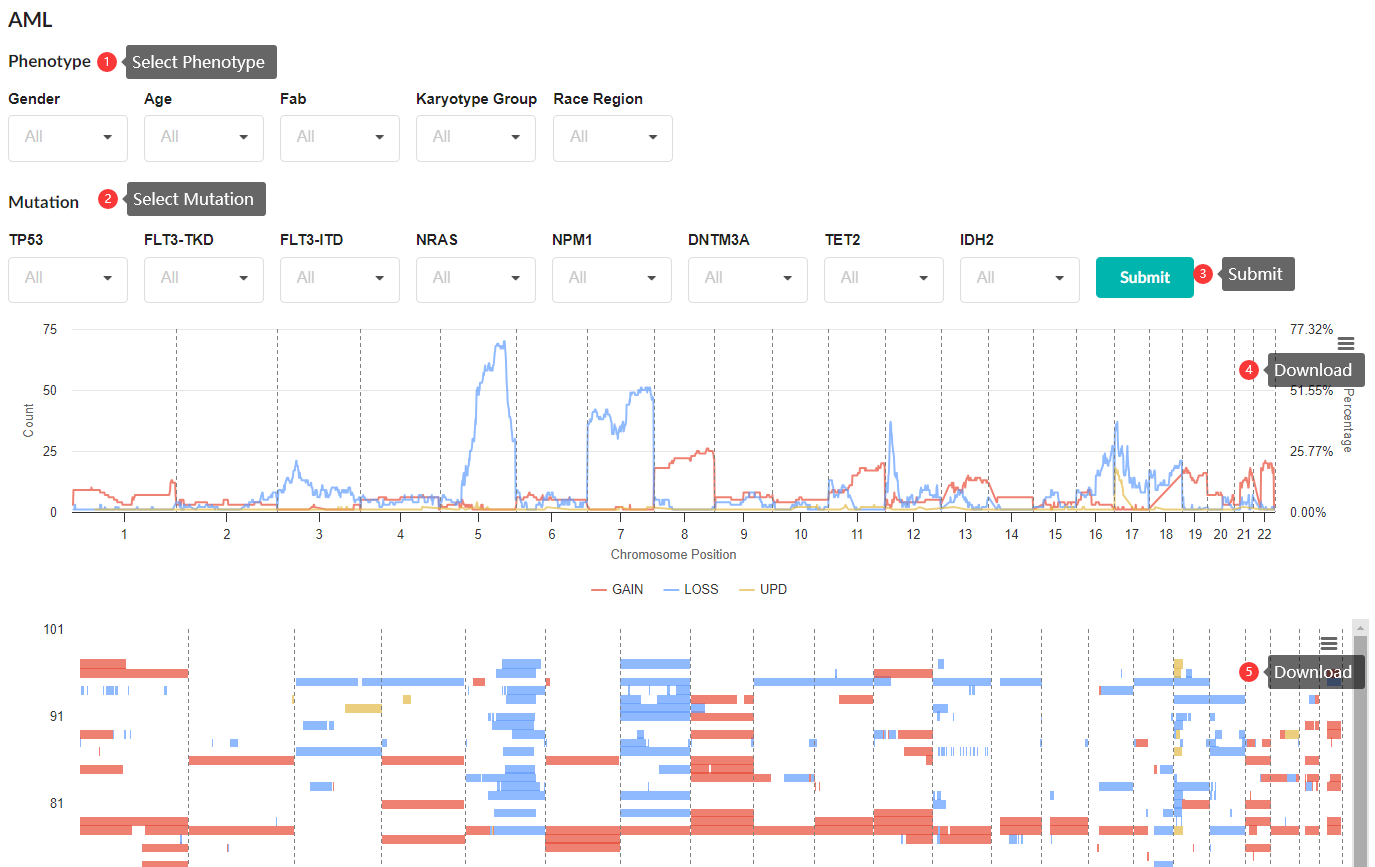
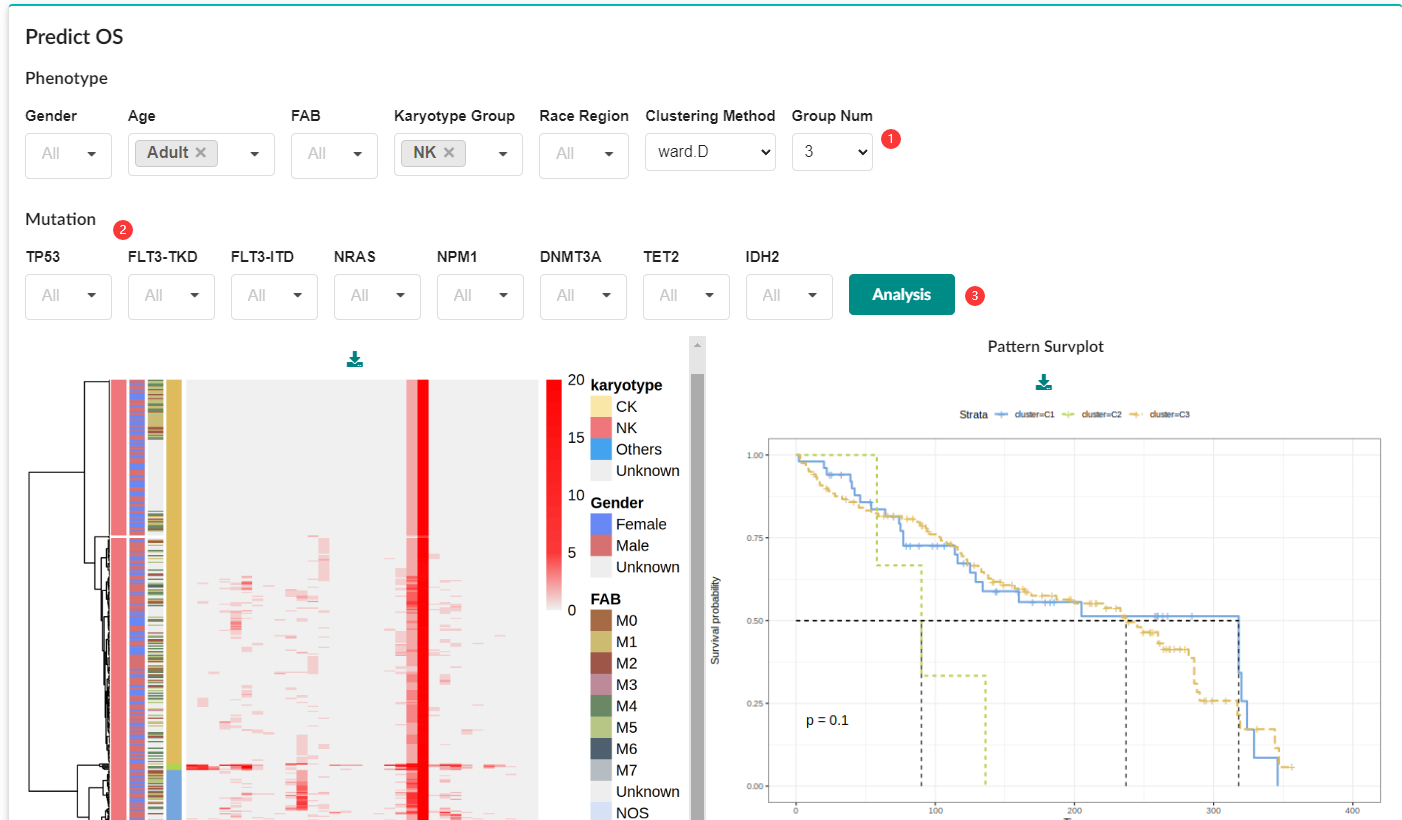
Filter the AML subgroups of interest
Users can filter different subgroups by the following filter options (Gender, Age, Fab, Karyotype Group, Race Region, TP53, FLT3-TKD, FLT3-ITD, NRAS, NPM1, DNMT3A) to generate corresponding CNV profiles, clinical information, segmentation information, and mutation information.
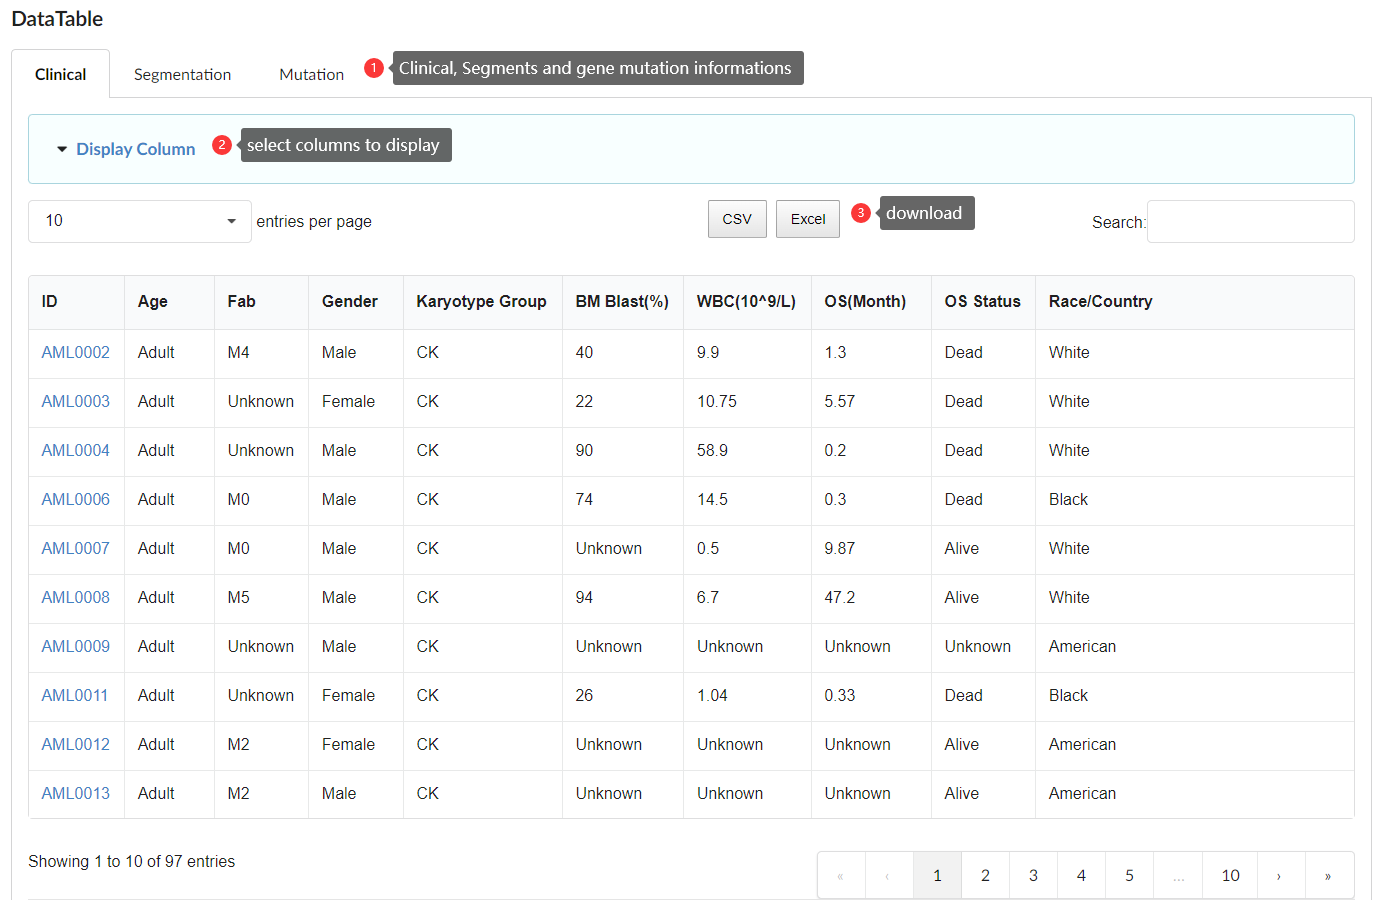
Download CNV and phenotype information
CNV segmentation data, phenotypic data, and clinical information in the database can be downloaded as Excel or CSV files from the Profile Module. Notably, by clicking on the display columns, the information you want to download is optional.
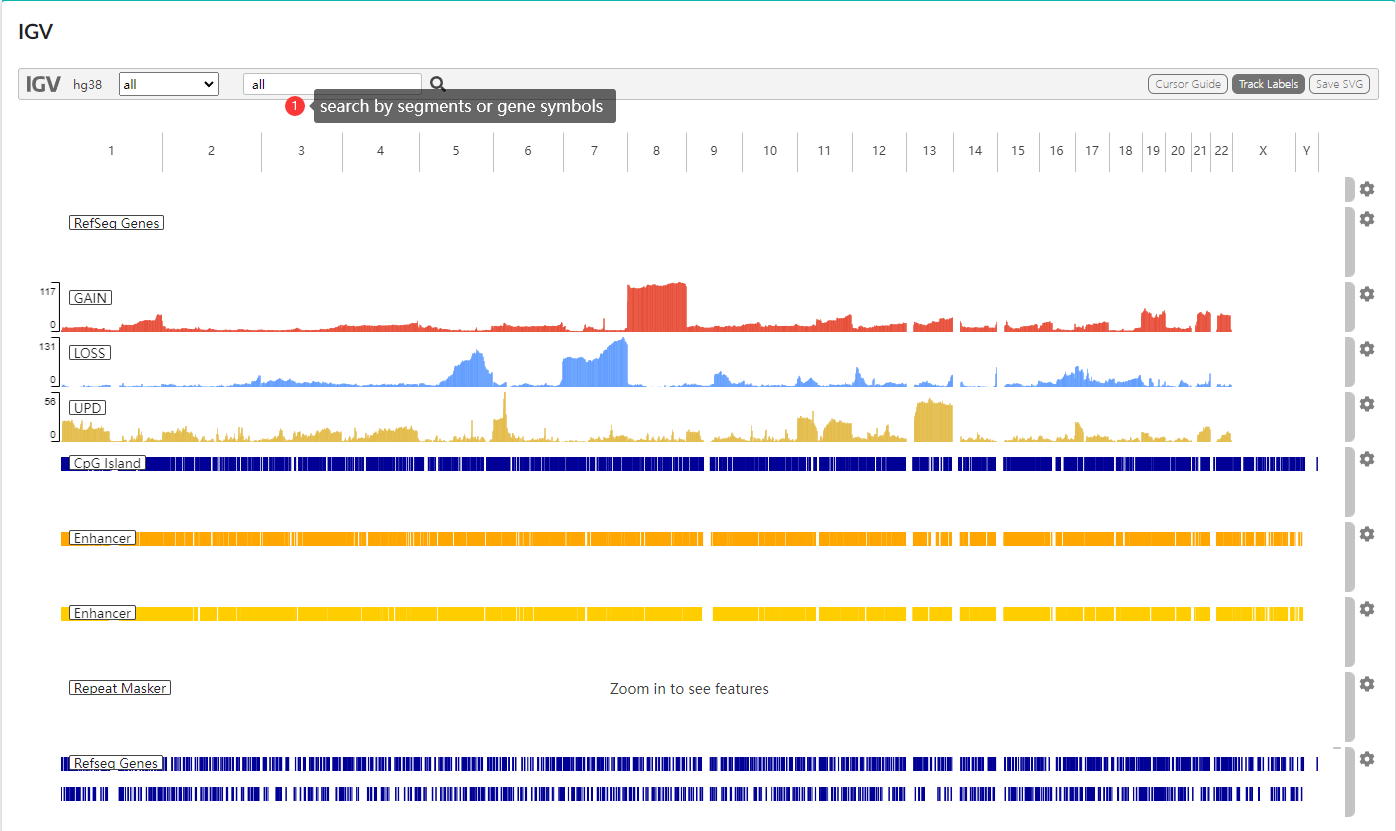
Browse Module provides a search interface where users can query specific genomic regions or genes. This module offers detailed genomic annotations and displays CNV mutation frequencies within the AML population.
The genome browser in the database is based on IGV: Integrative Genomics Viewer (https://www.igv.org). This module displays the frequency of mutations and CNVs (GAIN, LOSS, and UPD) at chromosomal loci, as well as the presence of CpG islands, Repeat Masker, distal enhancers, and proximal enhancers, along with annotation information of genes within the respective regions.
The annotation data for RefSeq genes, CpG islands, and Repeat sequences are sourced from the UCSC Genome Browser (https://genome.ucsc.edu). The annotation data for distal enhancers and proximal enhancers is sourced from the ENCODE database (https://www.encodeproject.org). You can enter specific chromosomal segments or gene symbols to search for and display the relevant information within that segment.
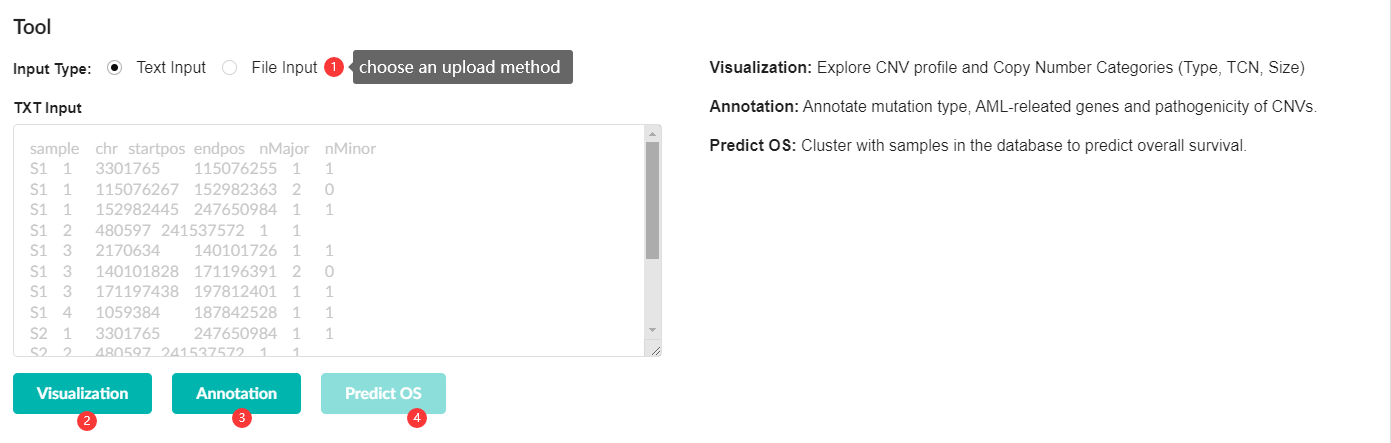
Here is a standard example of an input file:
| sample | chr | startpos | endpos | nMajor | nMinor |
|---|---|---|---|---|---|
| S1 | 1 | 3301765 | 247650984 | 1 | 1 |
| S1 | 2 | 480597 | 241537572 | 2 | 1 |
| S1 | 3 | 2170634 | 45186644 | 1 | 0 |
| S1 | 3 | 45187701 | 46886248 | 2 | 0 |
| S1 | 3 | 46889988 | 197812401 | 0 | 0 |
Quality Control and Genotyping.
For SNP array data in *.CEL format, quality control, and genotyping are conducted using the Birdseed algorithms in Affymetrix Power Tools (APT).
For WXS data in *.BAM format, alleleCounter is used to extract allele counts for each SNP locus, which generates Log R ratio (LRR) and B allele frequency (BAF) files.
CNV Analysis with ASCAT.
CNV calling is conducted by ASCAT (Allele-specific copy number analysis of tumors). ASCAT processes the input LRR/BAF files to identify allele-specific copy number variations for each region. ASCAT estimates tumor sample purity and ploidy and corrects the impact of tumor purity and ploidy on copy number estimation.
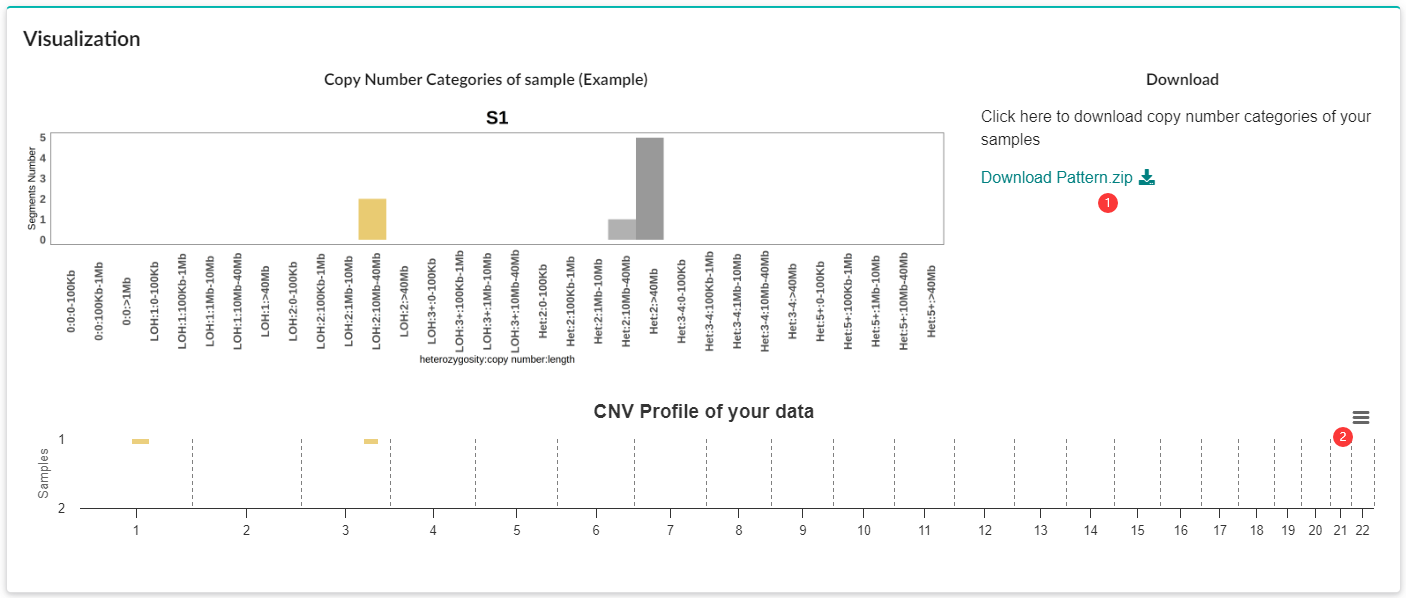
CNV Profiling.
R package ggplot2 is used to generate CNV profiles for each sample, with different colors representing different copy number states (LOSS, UPD, GAIN).
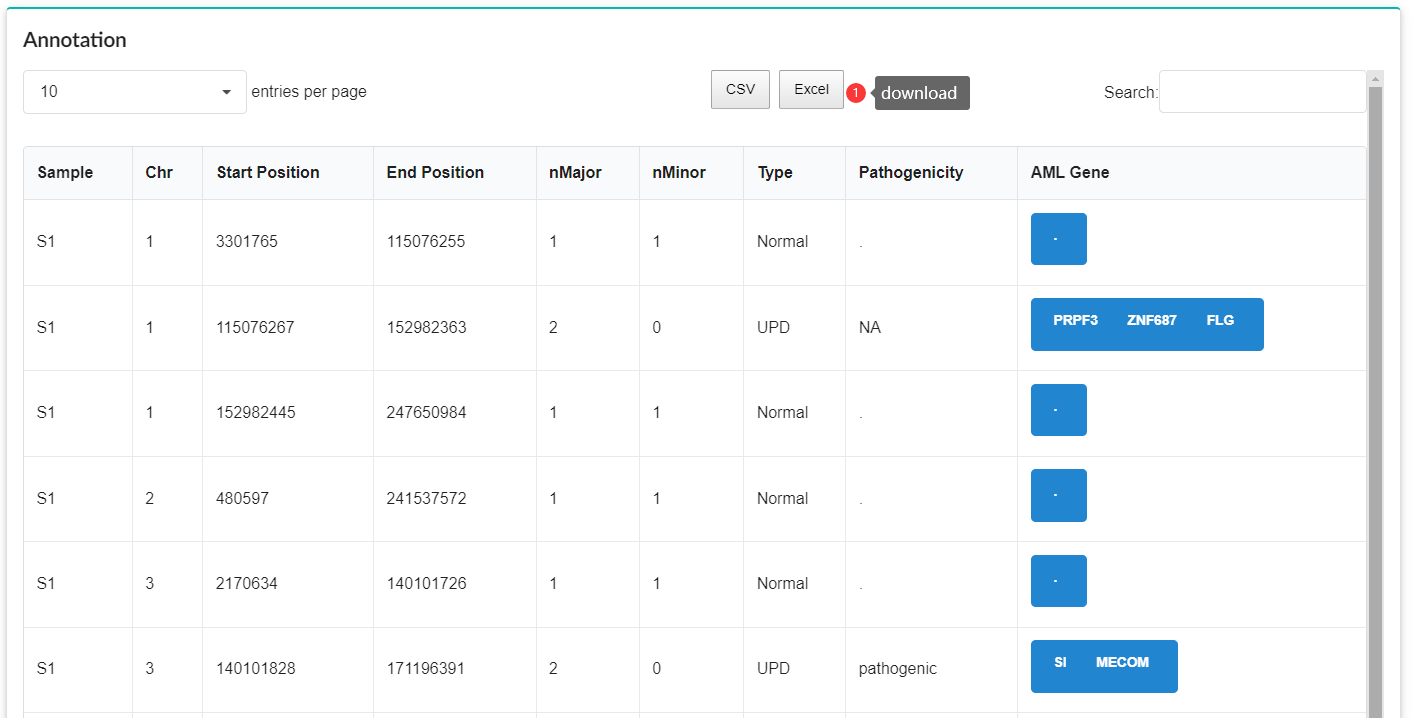
Pathogenicity Prediction.
Pathogenicity prediction of CNV is accomplished with X-CNV (http://www.unimd.org/XCNV). The XCNV's prediction results include pathogenicity scores and relevant annotations.
Address: No.1 Beichen West Road, Chaoyang District, Beijing 100101, China
Email: suyanxun2019m@big.ac.cn