MTD
Mammalian Transcriptomic Database
How to use the MTD database?
1. Browse
MTD enables browsing both the gene expression levels and read coverage information across tissues/cell lines with neighboring genomic coordinates or in a specific chromosomal cytoband.
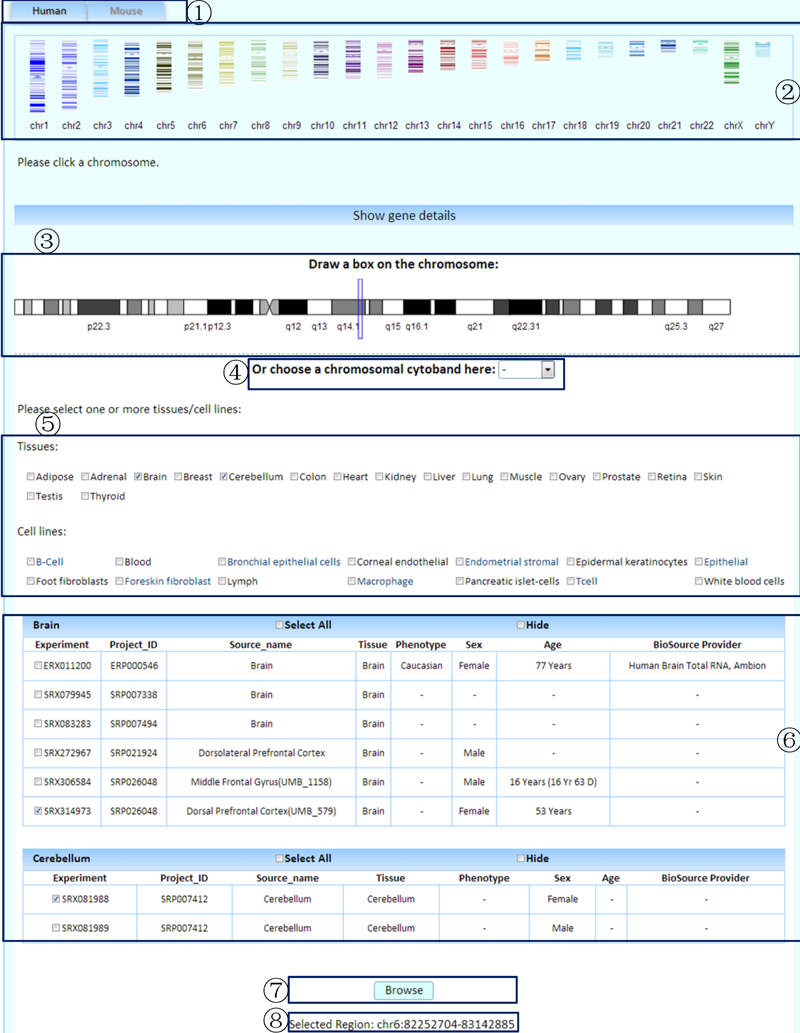
¢Ù Select a species to browse. (We only provide human and mouse data here because of the poor annotation of pig and rat genomes.)
¢Ú Click on the thumbnail of the chromosome of interest.
¢Û Drag the mouse to select a region on the detailed chromosome image.
¢Ü Or select a chromosomal cytoband.
¢Ý Select one or more tissues/cell lines to compare.
¢Þ Select the related experiments.
¢ß Click the browse button to submit the query.
¢à Tips of the genomic coordinates of the selected region.
Result1: the RPKMs of genes in the queried region.
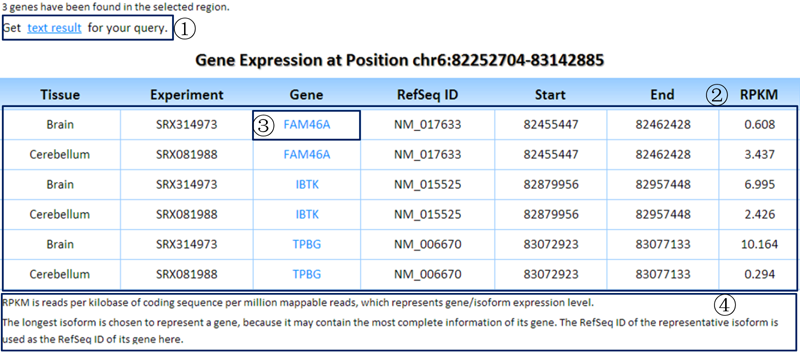
¢Ù Clicking on this link will show the tab-delimited text results of the query.
¢Ú Table showing the basic genomic positions and RPKMs of genes (in the queried region) in the selected experiments of tissues/cell lines of interest.
¢Û Each gene symbol can link to the detailed information page of its isoforms.
¢Ü Some related annotations of this table are listed here.
Result2: read coverage plots of genes (in the queried region) in the selected experiments of tissues/cell lines of interest.
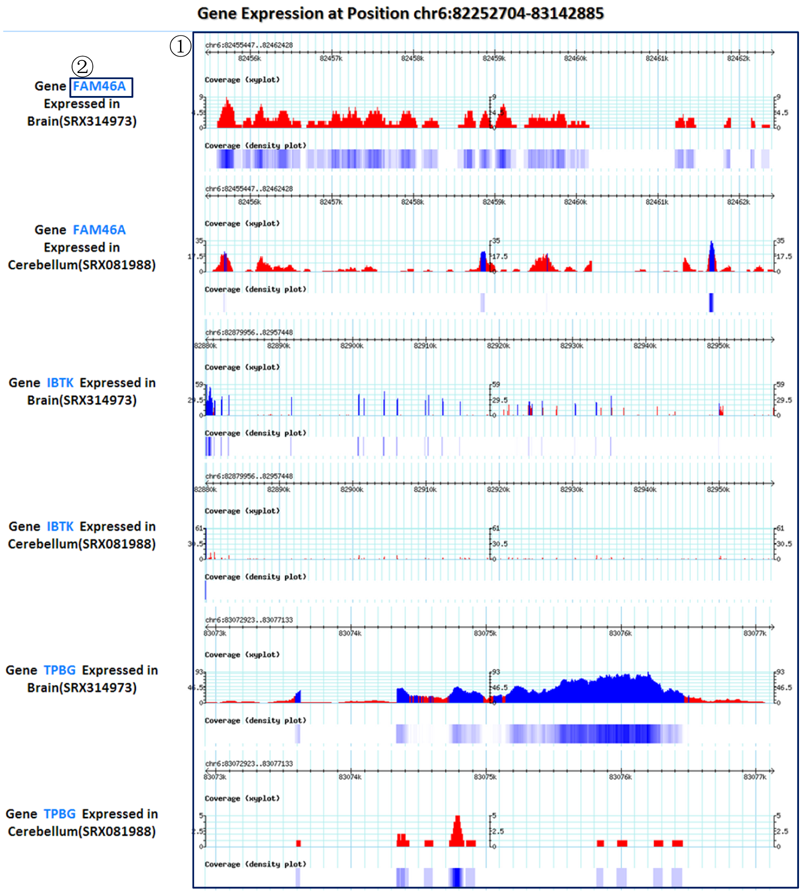
¢Ù Read coverage xy plots and density plots of genes (in the queried region) in the selected experiments of tissues/cell lines of interest.
¢Ú Each gene symbol can link to the detailed information page of its isoforms.
We embedded a genome browser (GBrowse) here to allow flexible searching for the transcriptional features of a chromosomal region.
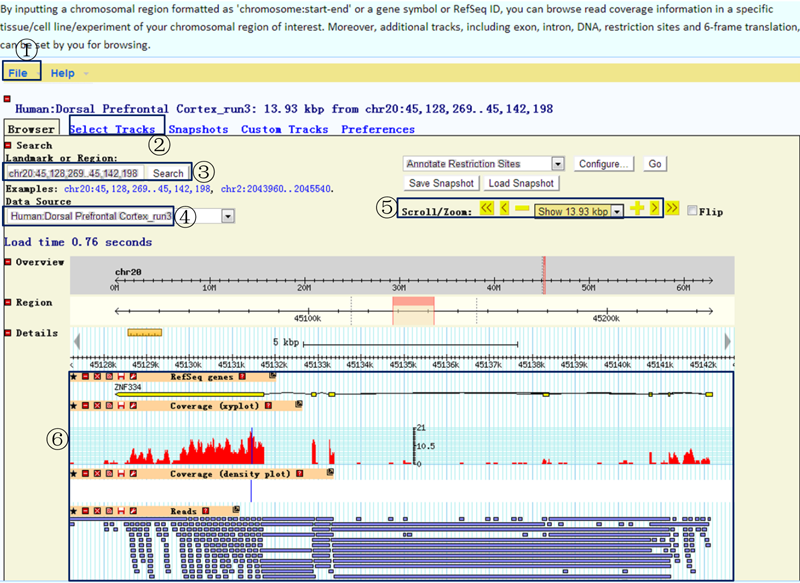
¢Ù Clicking on the 'File' menu will allow the queried results to be exported.
¢Ú Additional tracks, including exon, intron, DNA, restriction sites and 6-frame translation, can be browsed.
¢Û You can input a chromosomal region formatted as 'chromosome:start-end', a gene symbol or a RefSeq ID.
¢Ü Data sources formatted as "species:tissue (_runNo only for technical replicates)" are used to browse read coverage information in the experiment of a specific tissue/cell line. Data sources formatted as "species" are used to browse gene structures.
¢Ý Scrolling or zooming is allowed to investigate details.
¢Þ Gene structure plots, read coverage xy plots (any read depth below 20 is flagged in red), read coverage density plots and read details are available.
The MTD can be used to browse gene expression levels based on their joint KEGG pathway in selected tissues/cell lines.
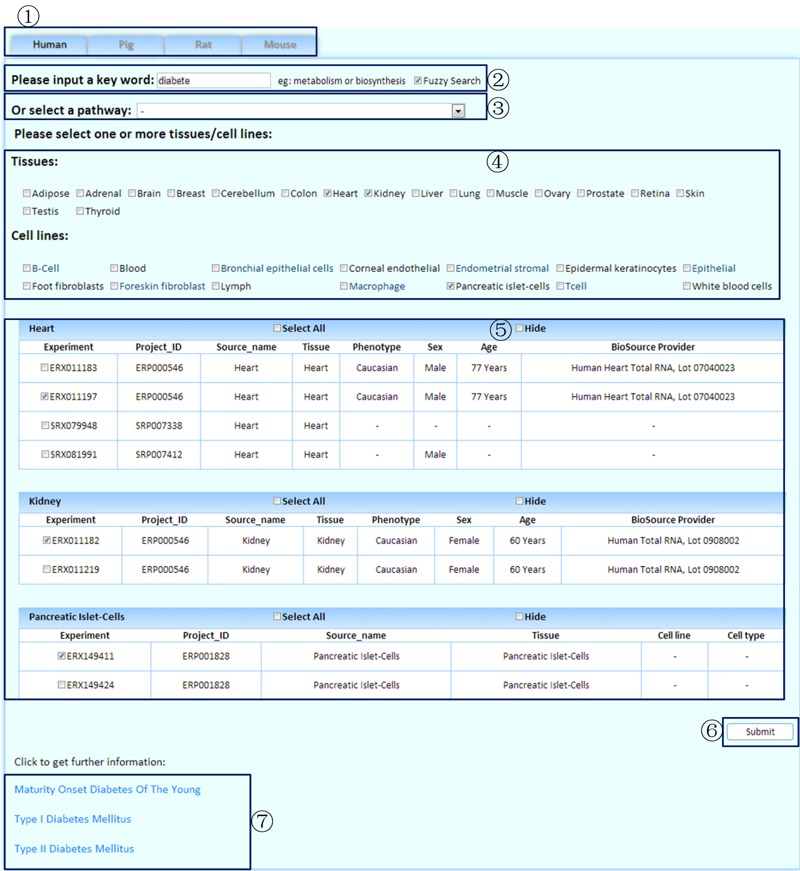
¢Ù Select a species to browse.
¢Ú Input a key word to perform a fuzzy search.
¢Û Or select a pathway to perform an alternative search.
¢Ü Select the tissues/cell lines of interest.
¢Ý Select the related experiments.
¢Þ Click to submit the query.
¢ß The matched names of the pathways by a fuzzy search.
The KEGG image of the queried pathway by KEGG API.
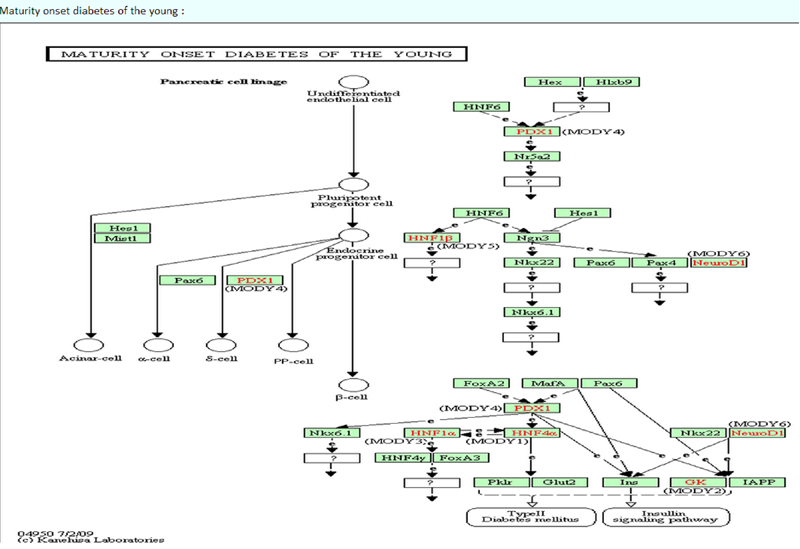
The detailed information page of the pathway in KEGG:

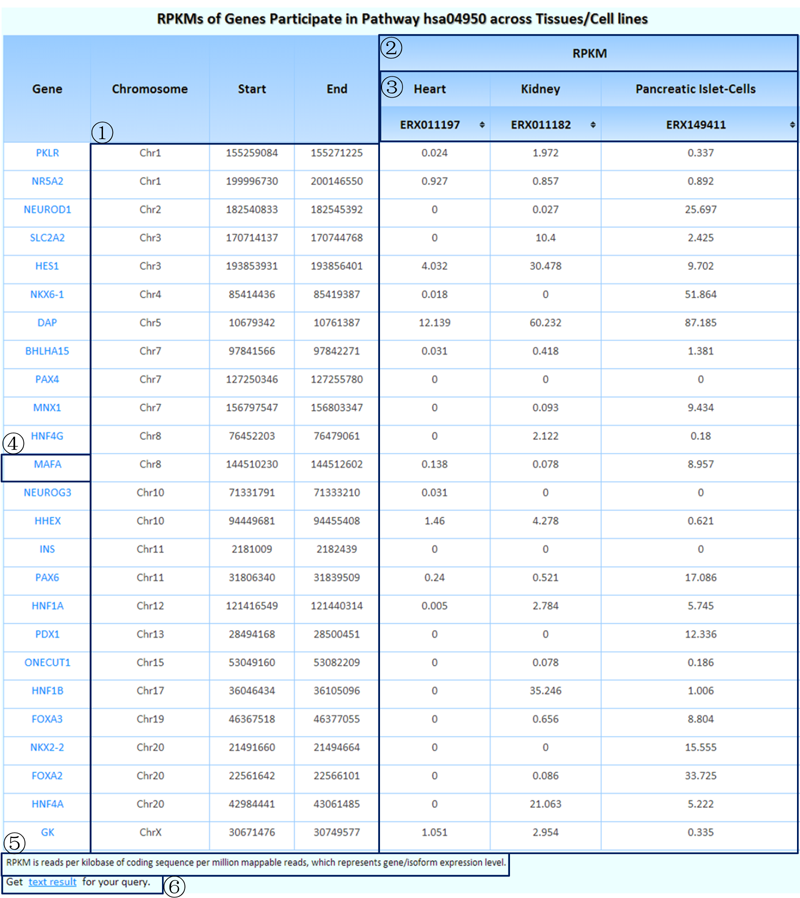
¢Ù Genomic coordinates of the genes participating in this pathway.
¢Ú RPKM values in the experiments of each selected tissue/cell line for these genes.
¢Û Click each tissue name/experiment number to rank the RPKM values, which makes it easy to find genes with high/low expression levels in the pathway of interest.
¢Ü Clicking on each gene symbol can link to the detailed information page of its isoforms.
¢Ý Some related annotations of this table are listed here.
¢Þ Clicking on this link will produce tab-delimited text results of the query that can be used in further research.
2. Search
The MTD allows the identification of HK genes or HK isoforms with user-defined cutoffs of RPKM or CV online. Genes with specific transcriptional features in the representative experiment of a particular tissue/cell line can also be obtained.
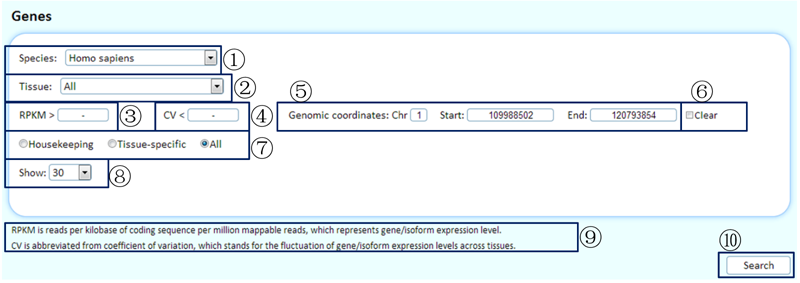
¢Ù Select the species of interest.
¢Ú Choosing the tissue/cell line of interest or choosing 'all' will display overviews of the expression levels in the representative experiments across tissues/cell lines for expressed genes.
¢Û Using a RPKM cutoff will filter data when selecting a specific tissue/cell line. You can cancel this limitation by inputting '-'.
¢Ü If 'housekeeping' is selected below, you can use the CV cutoff to filter the identified housekeeping genes (RPKM >0 in all representative experiments of tissues/cell lines with saturated data). Otherwise, you can cancel this limitation by inputting '-'.
¢Ý Limitation of the genomic region. You can cancel this limitation by inputting '-'.
¢Þ Selecting 'Clear' will cancel the limitation of the genomic region.
¢ß Show housekeeping genes/tissue-specific genes or all genes with the queried transcriptional features.
¢à Set the number of items to show on each page.
¢á Some related annotations of this table are listed here.
¢â Click to submit the query.
The queried results:
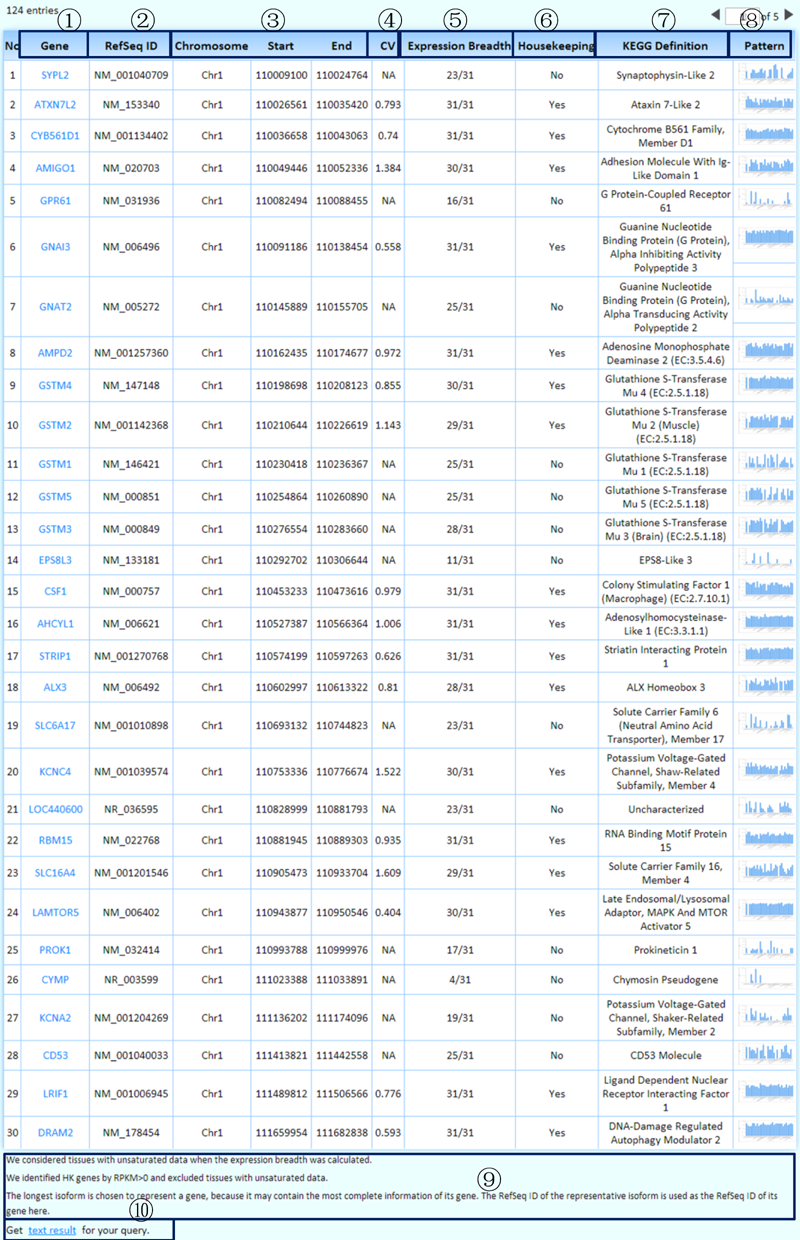
¢Ù Each well-characterized gene links to its KEGG page, which harbors its comprehensive information.
¢Ú We chose the longest isoform to represent a gene because it may contain the most complete information. We used the RefSeq ID of the representative isoform as the RefSeq ID of the gene here.
¢Û Genomic coordinates of genes with user-specified transcriptional features.
¢Ü CV: The coefficient of variation stands for the fluctuation of gene expression levels in the representative experiments across tissues/cell lines. We only calculated CV values for housekeeping genes.
¢Ý The expression breadth was calculated by considering the representative experiments of all the tissues/cell lines we collected (including tissues/cell lines with unsaturated data) for each gene.
¢Þ Is this a housekeeping gene? We identified housekeeping genes by considering the representative experiments of tissues/cell lines with saturated data.
¢ß KEGG definition of each well-characterized gene.
¢à The MTD enables an online real-time graphing histogram (by JPGraph), which provides an overview of the expression levels in the representative experiments across tissues/cell lines for each expressed gene.
¢á Some related annotations of this table are listed here.
¢â Clicking on this link will produce the tab-delimited text results of the query for further research.
The linked KEGG page:
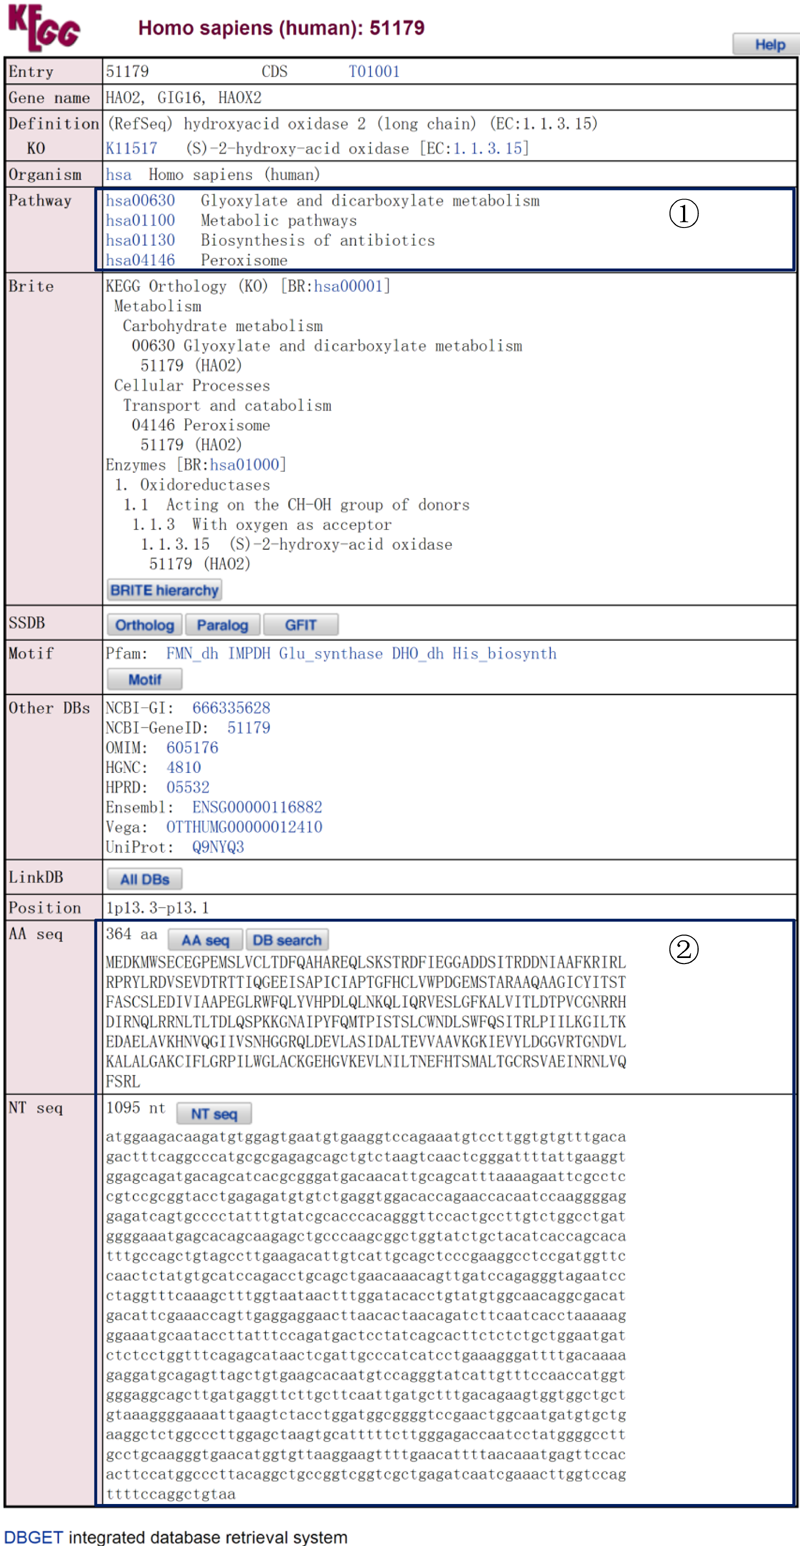
This page contains the comprehensive details of each well-characterized gene, such as:
¢Ù The participating KEGG pathways of the selected gene.
¢Ú The corresponding amino acid and nucleotide sequences of the selected gene.
If a specific tissue/cell line is chosen, the SRA links of the reference data sources will be listed below the table of the queried results. Additionally, each linked SRA page provides a record of the detailed information on the raw experiment and sample.
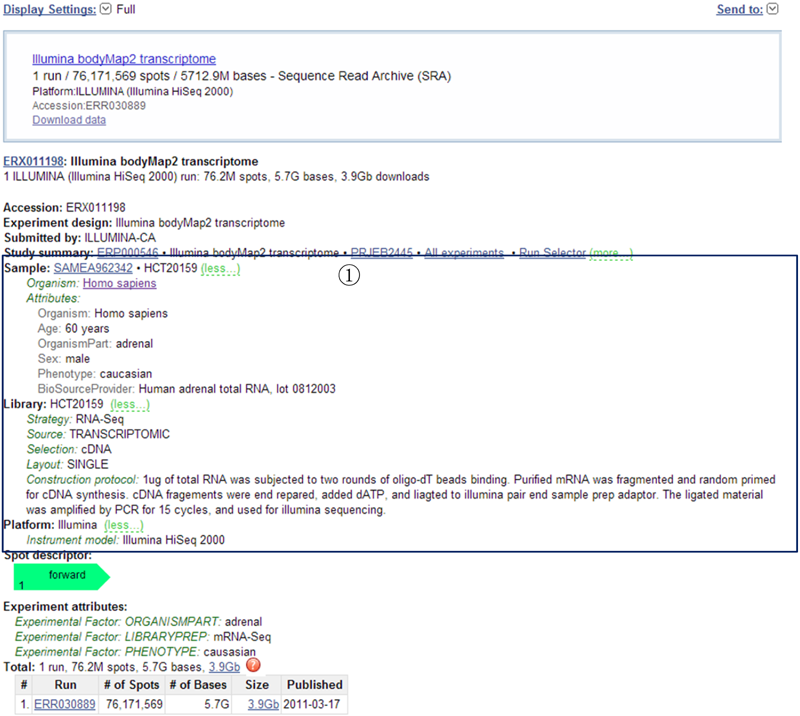
¢Ù This page provides a record of the detailed information on the sample and experimental conditions.
By considering the genomic position and transcriptional features (including alternative splicing types, transcriptional directions, and expression levels etc.) of each transcript, we assign each isoform a unique name. Based on this nomenclature, the MTD makes it convenient for users to search isoforms with specific transcriptional features.
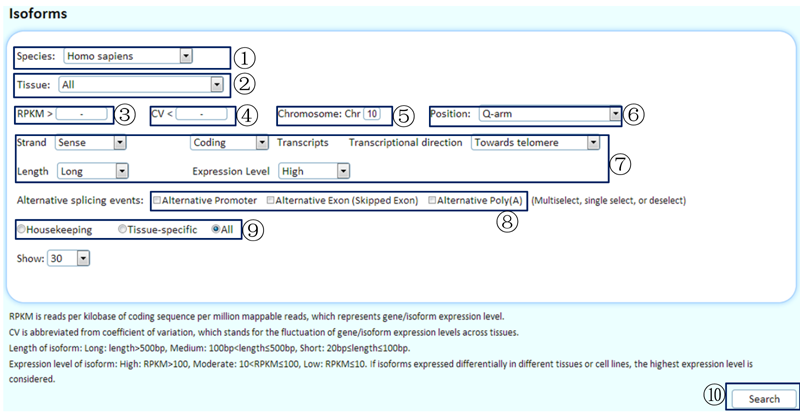
¢Ù Select the species of interest. (Because of the poorly annotated genome sequences of pigs, some information about the genomic locations of isoforms is not available to use as a limitation.)
¢Ú Choose the tissue/cell line of interest or choose 'all', which will display overviews of the expression levels in the representative experiments across tissues/cell lines for expressed isoforms.
¢Û Use a RPKM cutoff to filter data when selecting a specific tissue/cell line. You can cancel this limitation by inputting '-'.
¢Ü If 'housekeeping' is selected below, you can use a CV cutoff to filter the identified housekeeping isoforms (RPKM >0 in the representative experiments of all tissues/cell lines with saturated data). Otherwise, you can cancel this limitation by inputting '-'.
¢Ý Limitation of chromosome. You can cancel this limitation by inputting '-'.
¢Þ Choose a chromosomal arm to filter the data.
¢ß Transcriptional features include whether the isoforms reside in sense or antisense strands, coding or noncoding transcripts, transcriptional direction, the lengths of isoforms, and the expression levels.
¢à Use the alternative splicing events to filter the data. Here, an 'alternative exon (skipped exon)' event means that a regulated exon is sometimes included or spliced out of the mRNA, like a cassette. An 'alternative 5' splice site' event is a switch of the 5'-terminal exon of an mRNA using alternative promoters and alternative splicing. Similarly, an 'alternative 3' splice site' event is a switch of the 3'-terminal exon by combining alternative splicing with alternative poly(A) sites.
¢á Show housekeeping isoforms/tissue-specific isoforms or all isoforms with the queried transcriptional features.
¢â Click to submit the query.
The queried results:
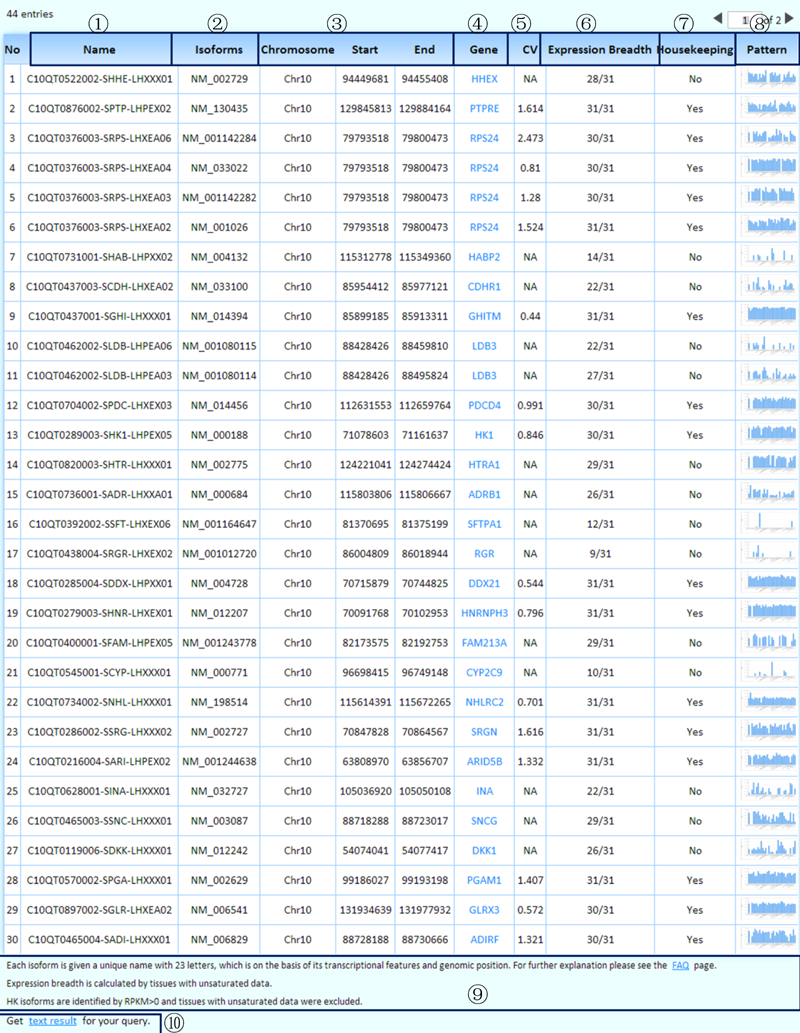
¢Ù We have given each isoform a unique name that consists of 23 letters and is based on its transcriptional features and genomic position. For further explanation, please see the 'FAQ' page.
¢Ú The RefSeq ID of each isoform.
¢Û Genomic coordinates of isoforms with user-specified transcriptional features.
¢Ü Each well-characterized gene links to its KEGG page, which harbors its comprehensive information.
¢Ý CV: The coefficient of variation stands for the fluctuation of isoform expression levels in the representative experiments across tissues/cell lines. We only calculated CV values for housekeeping isoforms.
¢Þ The expression breadth was calculated by considering the representative experiments of all the tissues/cell lines we collected (including tissues/cell lines with unsaturated data) for each isoform.
¢ß Is this a housekeeping isoform? We identified housekeeping isoforms by considering the representative experiments of tissues/cell lines with saturated data.
¢à The MTD enables an online real-time graphing histogram (by JPGraph), which provides an overview of the expression levels in the representative experiments across tissues/cell lines for each expressed isoform.
¢á Some related annotations of this table are listed here.
¢â Clicking on this link will produce the tab-delimited text results of the query for further research.
3. Analysis
An intraspecies interface allows the comparison of transcriptomes across tissues or cell lines or experiments on gene, transcript and exon levels.
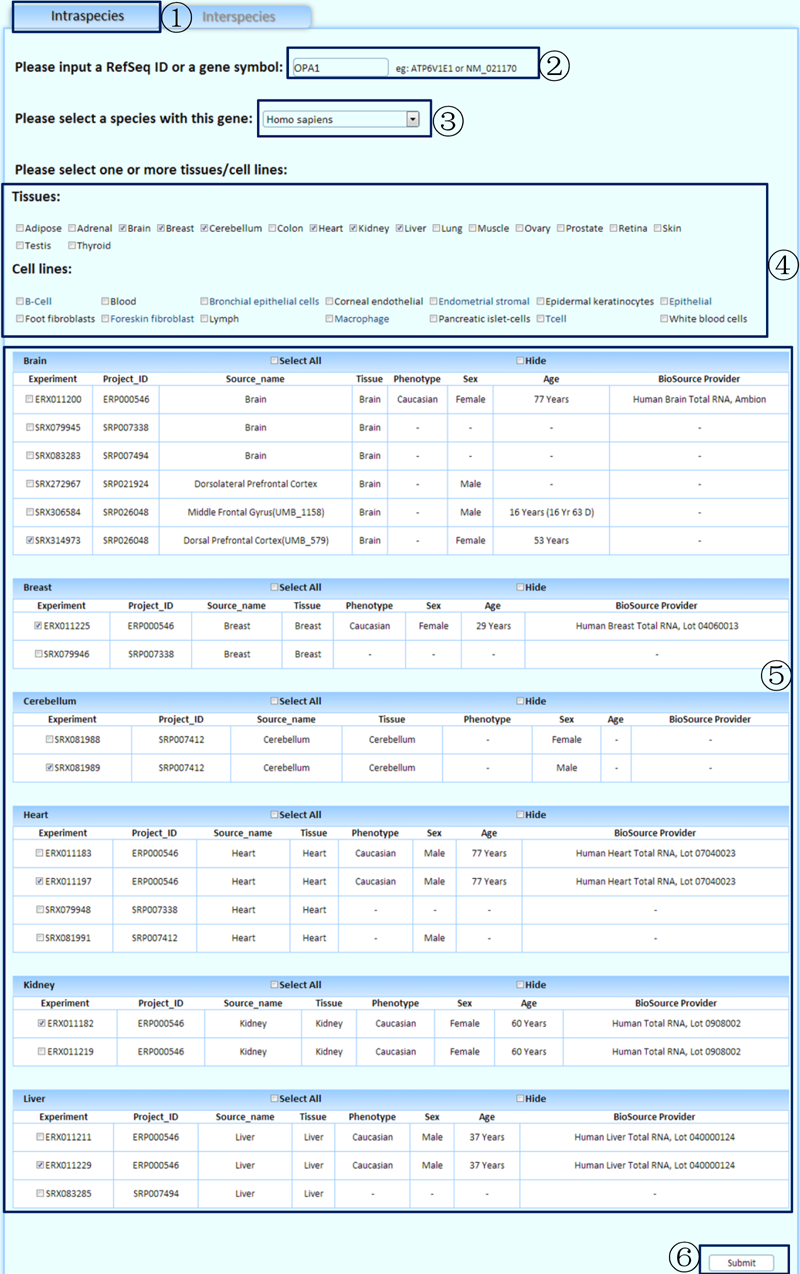
¢Ù Select the tab to perform a comparative analysis of different tissues/cell lines within a species.
¢Ú Input a gene symbol or a RefSeq ID to analyze. (If you are not sure which gene symbol or RefSeq ID should be used to search, the 'other data' section in our 'download page' provides a file named 'Gene Information', which lists all the gene symbols and RefSeq IDs in our database. However, we excluded genes with unclear genomic locations.)
¢Û Select a species with the queried gene.
¢Ü Choose one or more tissues/cell lines to perform the analysis.
¢Ý Select the related experiments.
¢Þ Click to submit the query.
Result1: the basic information for the queried gene.
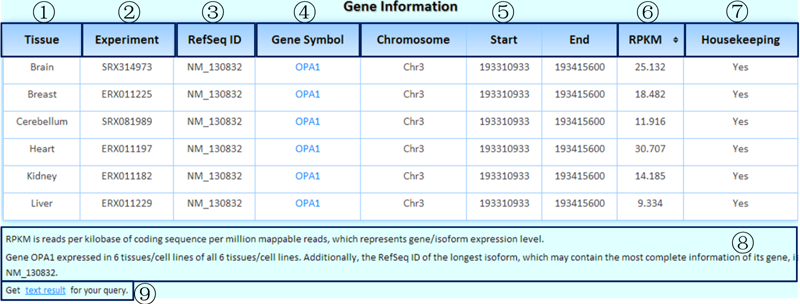
¢Ù The comparative tissues/cell lines (selected by users).
¢Ú The corresponding experiment IDs in the SRA.
¢Û We chose the longest isoform to represent a gene because it may contain the most complete information. We used the RefSeq ID of the representative isoform as the RefSeq ID of its gene here.
¢Ü Clicking on each gene symbol can link to the detailed information page on its isoforms (comparative analysis of its isoforms across tissues/cell lines).
¢Ý Genomic coordinates of the queried gene.
¢Þ RPKM value in the corresponding experiment for each tissue/cell line/experiment. If you select more than one tissue/cell line/experiment, this table becomes sortable. By clicking this title, it is easy to determine in which tissue/cell line/experiment the queried gene was expressed at the highest/lowest levels.
¢ß Is this a housekeeping gene? We identified housekeeping genes by considering the representative experiments of tissues/cell lines with saturated data.
¢à Some related annotations of this table are listed here.
¢á Clicking on this link will produce the tab-delimited text results of the query for further research.
Result2: the gene structure plots and the read coverage plots across tissues/cell lines/experiments.
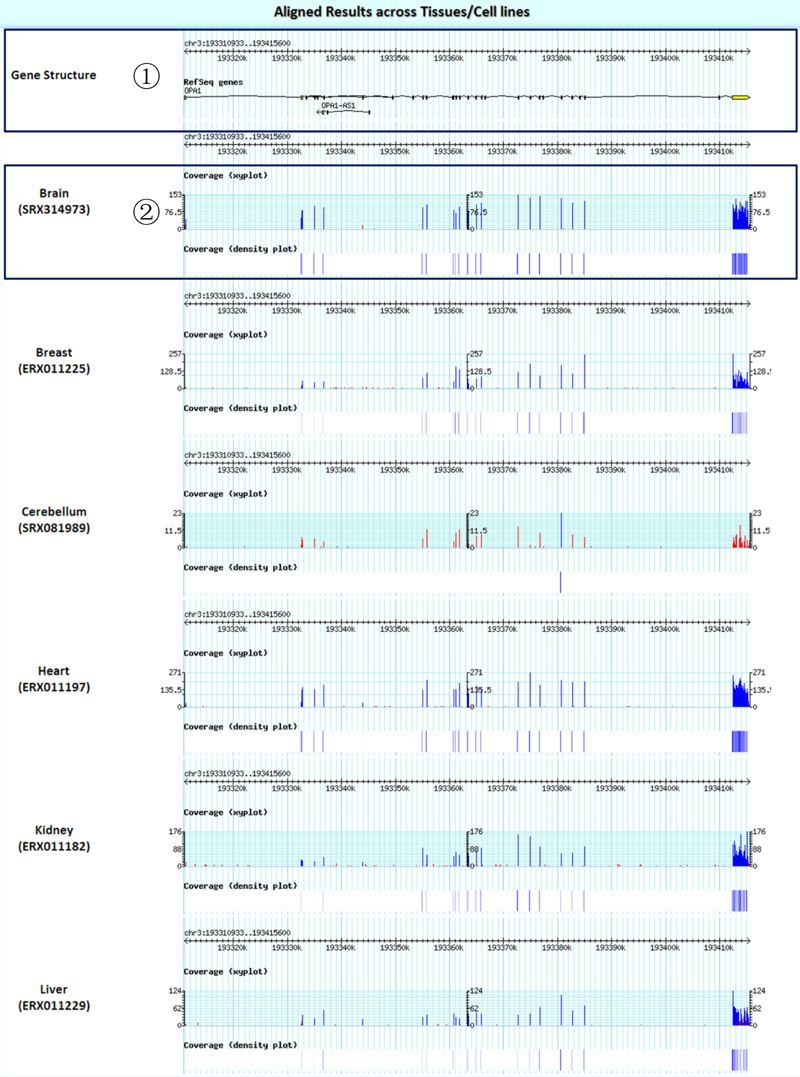
¢Ù The structure plots for the queried gene.
¢Ú Read coverage plots (any read depth below 20 is flagged in red in the coverage xy plot).
Clicking a gene symbol will link to the detailed page of its isoforms. This is the detailed isoform structures plot.
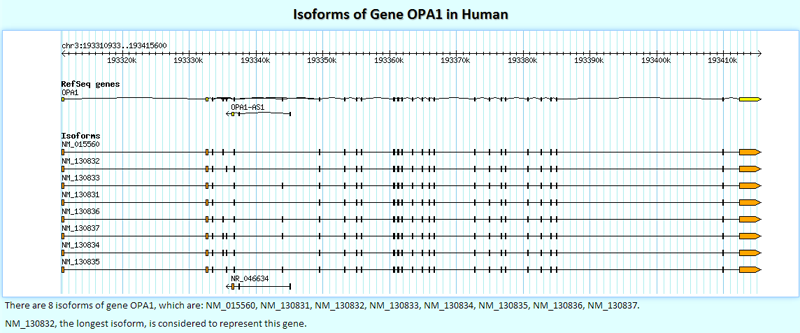
Below the isoform structures plot, there is a table that contains the basic information of the queried isoforms.
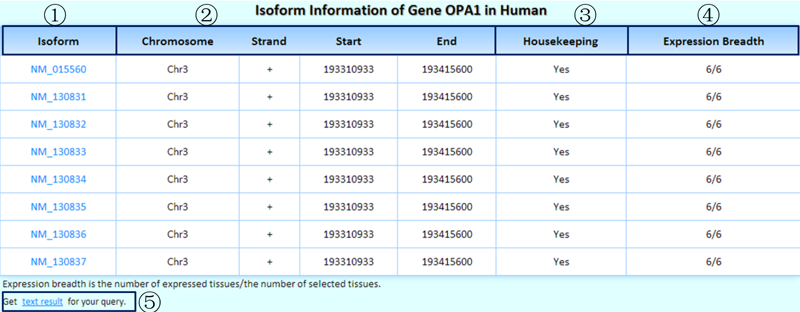
¢Ù The RefSeq ID of each isoform is shown. Clicking it will link to the detailed page on its exons.
¢Ú Genomic coordinates of the queried isoforms.
¢Û Is this a housekeeping isoform? We identified housekeeping isoforms by considering the representative experiments of tissues/cell lines with saturated data.
¢Ü The dynamic isoform expression breadth, which is described as the number of expressed tissues/the number of selected tissues (only considering the representative experiment of each tissue/cell line), is shown.
¢Ý Clicking on this link will produce the tab-delimited text results of the query for further research.
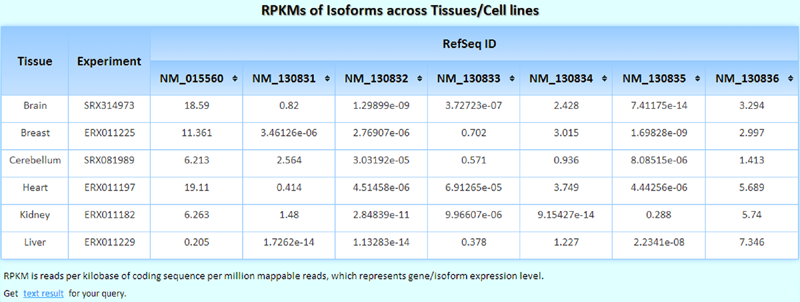
The RPKMs of isoforms across tissues/cell lines/experiments. If you select more than one tissue/cell line/experiment, this table becomes sortable, and you can easily determine in which tissue/cell line/experiment the queried isoform is expressed at the highest/lowest levels.
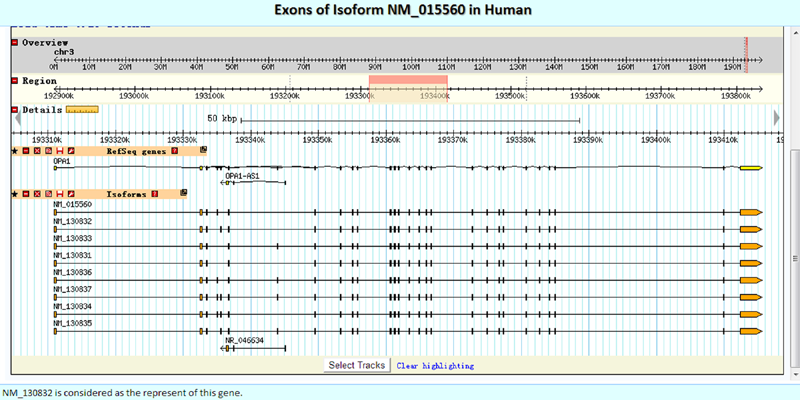
Here, we embedded GBrowse directly to facilitate the intuitive presentation of the detailed exon structures.
Below the embedded frame, there is a table containing the basic information of the queried exons.
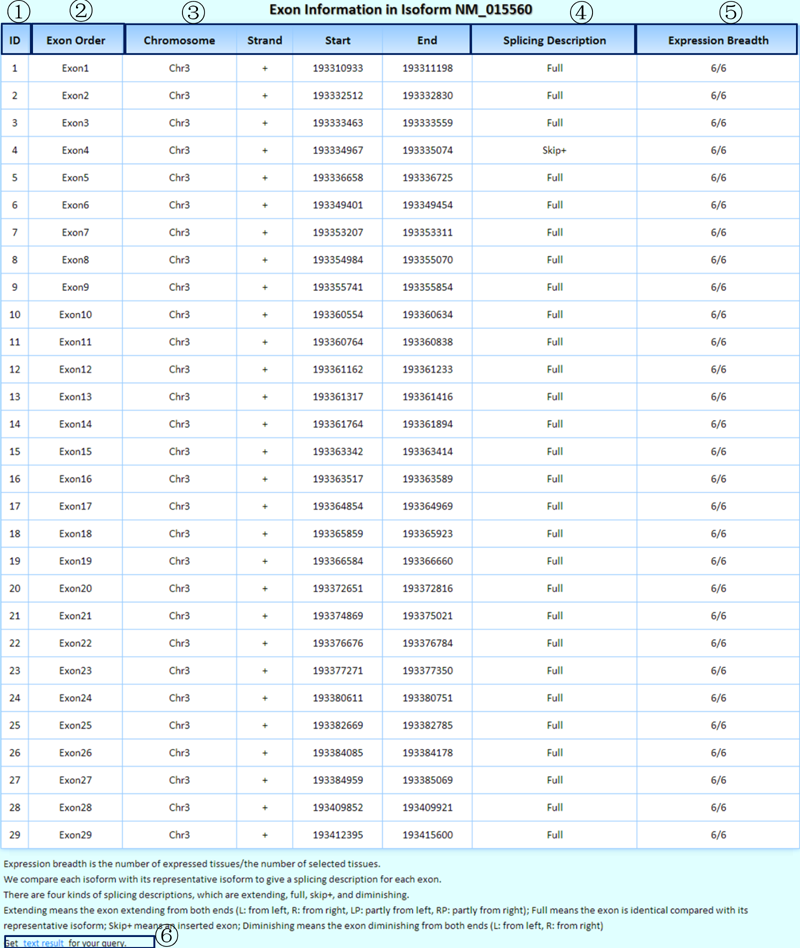
¢Ù The exon order in the queried isoform.
¢Ú The corresponding (or nearest) exon order in the representative isoform.
¢Û Genomic coordinates of the queried exons.
¢Ü We gave each exon a splicing depiction and compared it with the corresponding exon in the representative isoform. This text depiction is consistent with the structures of exons shown in the embedded window above. Additionally, the details are shown below the table.
¢Ý The dynamic exon expression breadth is described as the number of expressed tissues/the number of selected tissues (only considering the representative experiment of each tissue/cell line).
¢Þ Clicking on this link will produce the tab-delimited text results of the query for further research.
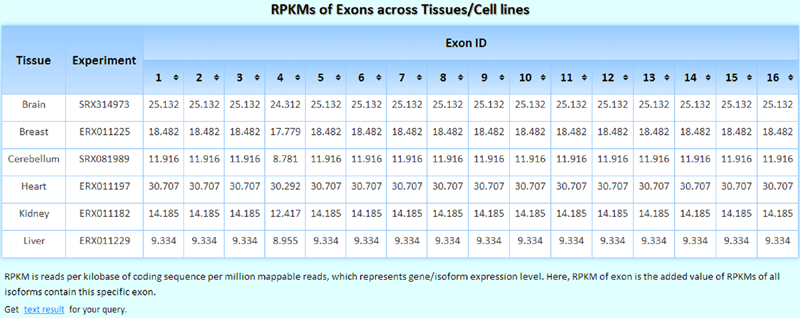
The RPKMs of exons in the experiments across tissues/cell lines are shown. If you select more than one tissue/cell line/experiment, this table becomes sortable, and you can easily determine in which tissue/cell line/experiment the queried exon was expressed at the highest/lowest levels.
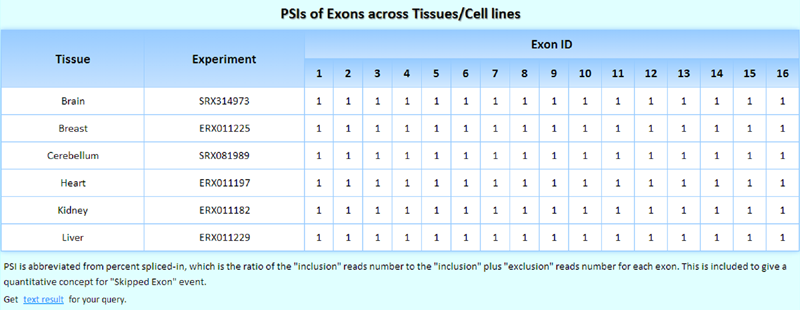
The widely used 'inclusion ratio', which is the percent spliced in (PSI) value and was defined as the ratio of the number of 'inclusion' reads to the 'inclusion plus exclusion' reads for each exon, is included in the MTD to facilitate the quantification of skipped exon (SE) events.
An interspecies interface allows comparison of the transcriptomic details of homologous genes in the experiments of physiologically equivalent tissues across species.
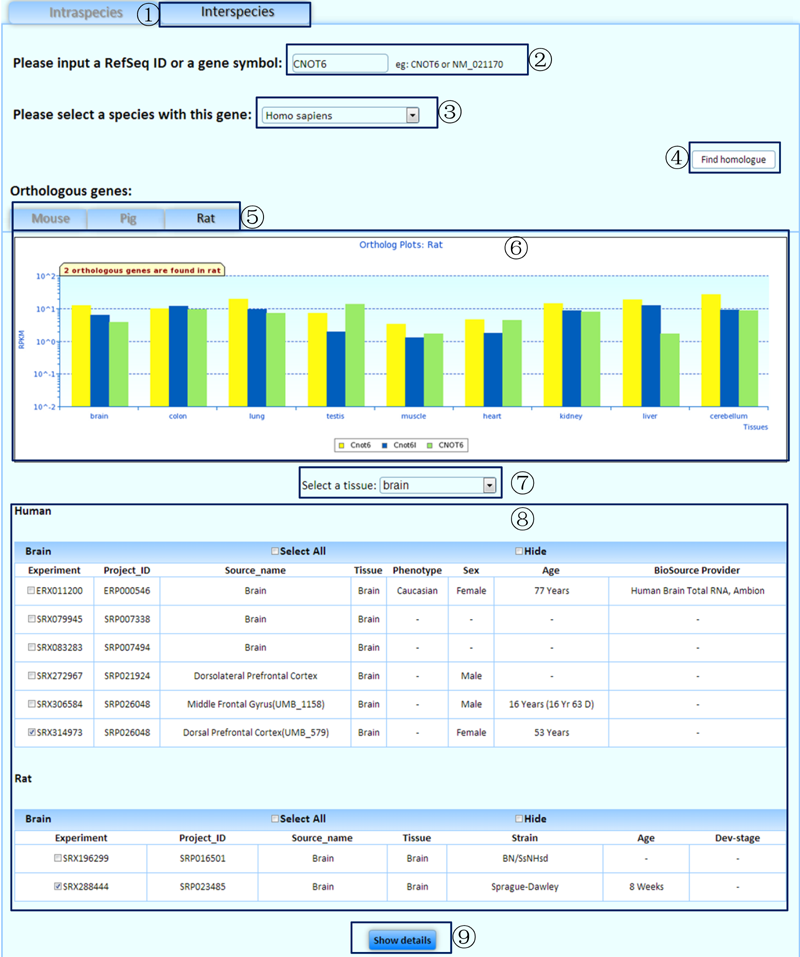
¢Ù Select the tab to compare the transcriptomic details of homologous genes in the experiments of physiologically equivalent tissues/cell lines across species.
¢Ú Input a gene symbol or a RefSeq ID to analyze. (If you are not sure which gene symbol or RefSeq ID should be used to search, the 'other data' section on our 'download' page provides a file named 'Gene Information', which lists all the gene symbols and RefSeq IDs in our database. However, we excluded genes with unclear genomic locations.)
¢Û Select a species with the queried gene.
¢Ü Click to find the homologous genes of your queried gene in the other three species.
¢Ý Select a tab to obtain further information on the species of interest with homologous genes.
¢Þ An overview of the expression levels of homologous genes in the representative experiments of physiologically equivalent tissues is shown between your queried species and the species that contains the homologous genes.
¢ß Select a tissue/cell line of interest.
¢à Select the related experiments.
¢á Click on the 'show details' button to view detailed information in a specific tissue/cell line.
Result1: the basic information for the homologous genes.

¢Ù The comparative species with homologous genes.
¢Ú The corresponding experiment IDs in the SRA.
¢Û We chose the longest isoform to represent a gene because it may contain the most complete information. Additionally, we used the RefSeq ID of the representative isoform as the RefSeq ID of its gene.
¢Ü Clicking on each gene symbol can link to the detailed information page of its isoforms.
¢Ý Genomic coordinates of the queried gene.
¢Þ RPKM values in the queried experiments of the tissue/cell line of each species.
¢ß Is this a housekeeping gene? We identified housekeeping genes by considering the experiments of tissues/cell lines with saturated data.
¢à Clicking on this link will produce the tab-delimited text results of the query for further research.
Result2: the structure plots and the read coverage plots of homologous genes in the queried experiments of the tissue/cell line.
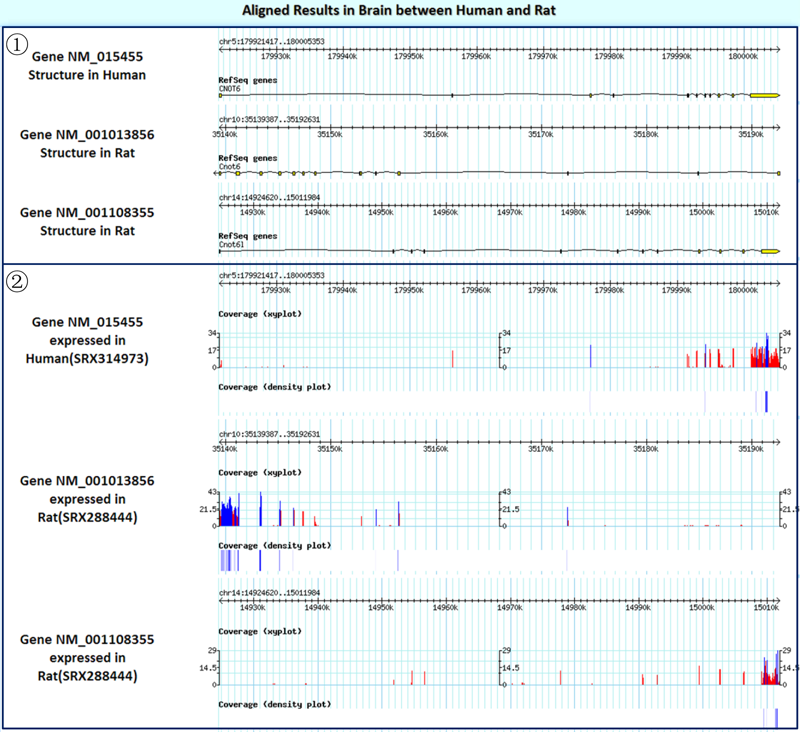
¢Ù The structure plots for the queried gene are shown.
¢Ú Read coverage plots (any read depth below 20 is flagged in red in the coverage xy plot).