
 Species
 Search
 Genome
 Network
 Resources
 Pathway
Introduction
PPGR (Resource for Perennial Plant Genomes and Regulation) is a public database dedicated to the collection, integration, analysis, and visualization of gene regulation and interaction data of perennial plants. The current release of PPGR includes 130 million protein-protein interactions (PPI), nearly 681 million TF-target interactions (TTI), and 8,975 transcriptome samples across 60 species derived from public data and manually curated data.
The database provides a comprehensive, high-quality resource of gene expression patterns, regulatory genes, horizontal transfer genes, metabolic pathways, protein-protein interactions, and TF-target interactions for perennial plants. Additionally, all downloaded data were processed with the same in-house pipeline. All processed data in PPGR are freely accessible.
Species
| Family | Species | Taxonmy |
|---|
Search
Quick Search
To specify your desired starting point of the analysis you have to use the input box at the PPGR start page.
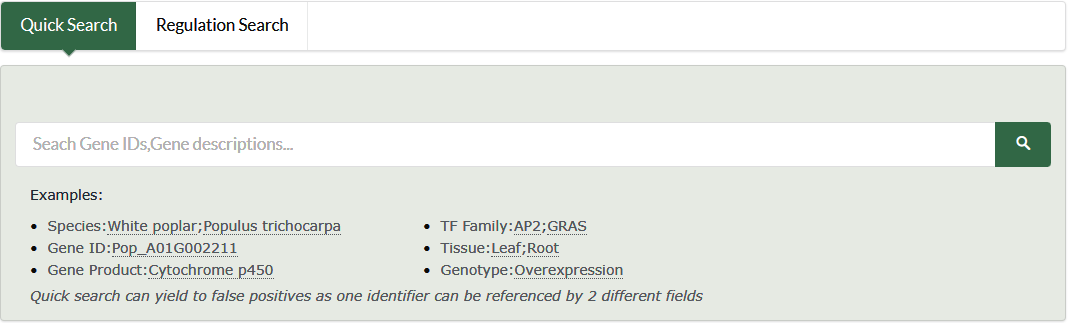
- Species
- Gen ID\Name
- Gene product/description
- TF family
- Tissue
- Genotype
- IDs in other database, such as RefSeq,Phytozome...
All the strings provided by the user are used as keywords to search in the static database file. The search results page may contain the following entries
regulation search

Users can search PPGR by single gene IDs, multiple IDs. This search method will link to the Network interface, with the user's input gene being treated as the central node of the network.
Genome
Data source
60 species with public available genome sequences and important in economy were collected.
Analysis & Method
Preprocessing
We formatted the downloaded genome sequence files, GFF annotation files, and protein sequence files using an in-house pipeline.
- Complete the missing features in the GFF file, which must include gene, mRNA, CDS, and EXON. And by adding a suffix to deal with duplicate IDs, so that the ID of each feature is unique in the respective species GFF file.
- For species lacking protein sequence files, use the gffread (v0.12.7.) software -y parameter to extract all protein sequences of the species based on the formatted GFF and genome files. For the downloaded protein sequence file, modify the protein sequence ID in the existing protein sequence file according to the formatted GFF file.
- Use BUSCO to evaluate the quality of genome files and protein files, and the evaluation results can help users in subsequent research.
annotation
The preprocessed data were annotated with gene functions, structural domains, GO terms and gene metabolic pathways,
- Use EGGNOG to perform functional annotation and classification of PPGR genes. EGGNOG leverages orthogonal genomic and functional annotation data from multiple databases to assign functional annotations to genes based on their evolutionary relationships. EGGNOG employs an unsupervised approach to cluster genes into orthogonal genome sets and provides functional annotations for these sets based on Gene Ontology terms, KEGG pathways, and other functional databases. The 'Description\Products' of the genes in PPGR were extracted from the Eggnog results files.
- Domain and other features identified by InterProScan v5.
- Obtain all plant protein sequence data from the large databases RefSeq, Swiss, TrEMBL, and obtain the Arabidopsis protein sequence file of the Araport11 version from TAIR. Use BLAST (e-value=1e-10) for alignment, and search for the best alignment hit between GRPPlant and the above databases.
Inference of orthologrous groups
The protein sequences from genome annotation for 60 species were used to paring BLAST reciprocal best hits (RBHs) and inferred orthologous groups (OGs) as follows:
- The protein sequences from genome annotation for 60 species were used to paring BLAST reciprocal best hits (RBHs) and inferred orthologous groups (OGs) as follows:
- BLAST all against all using representative proteins for each locus of 60 species.
- Inferred OGs using OrthoFinder (I=2) for all 60 species, based on the BLAST results.
Interface introduction
Reference Genome
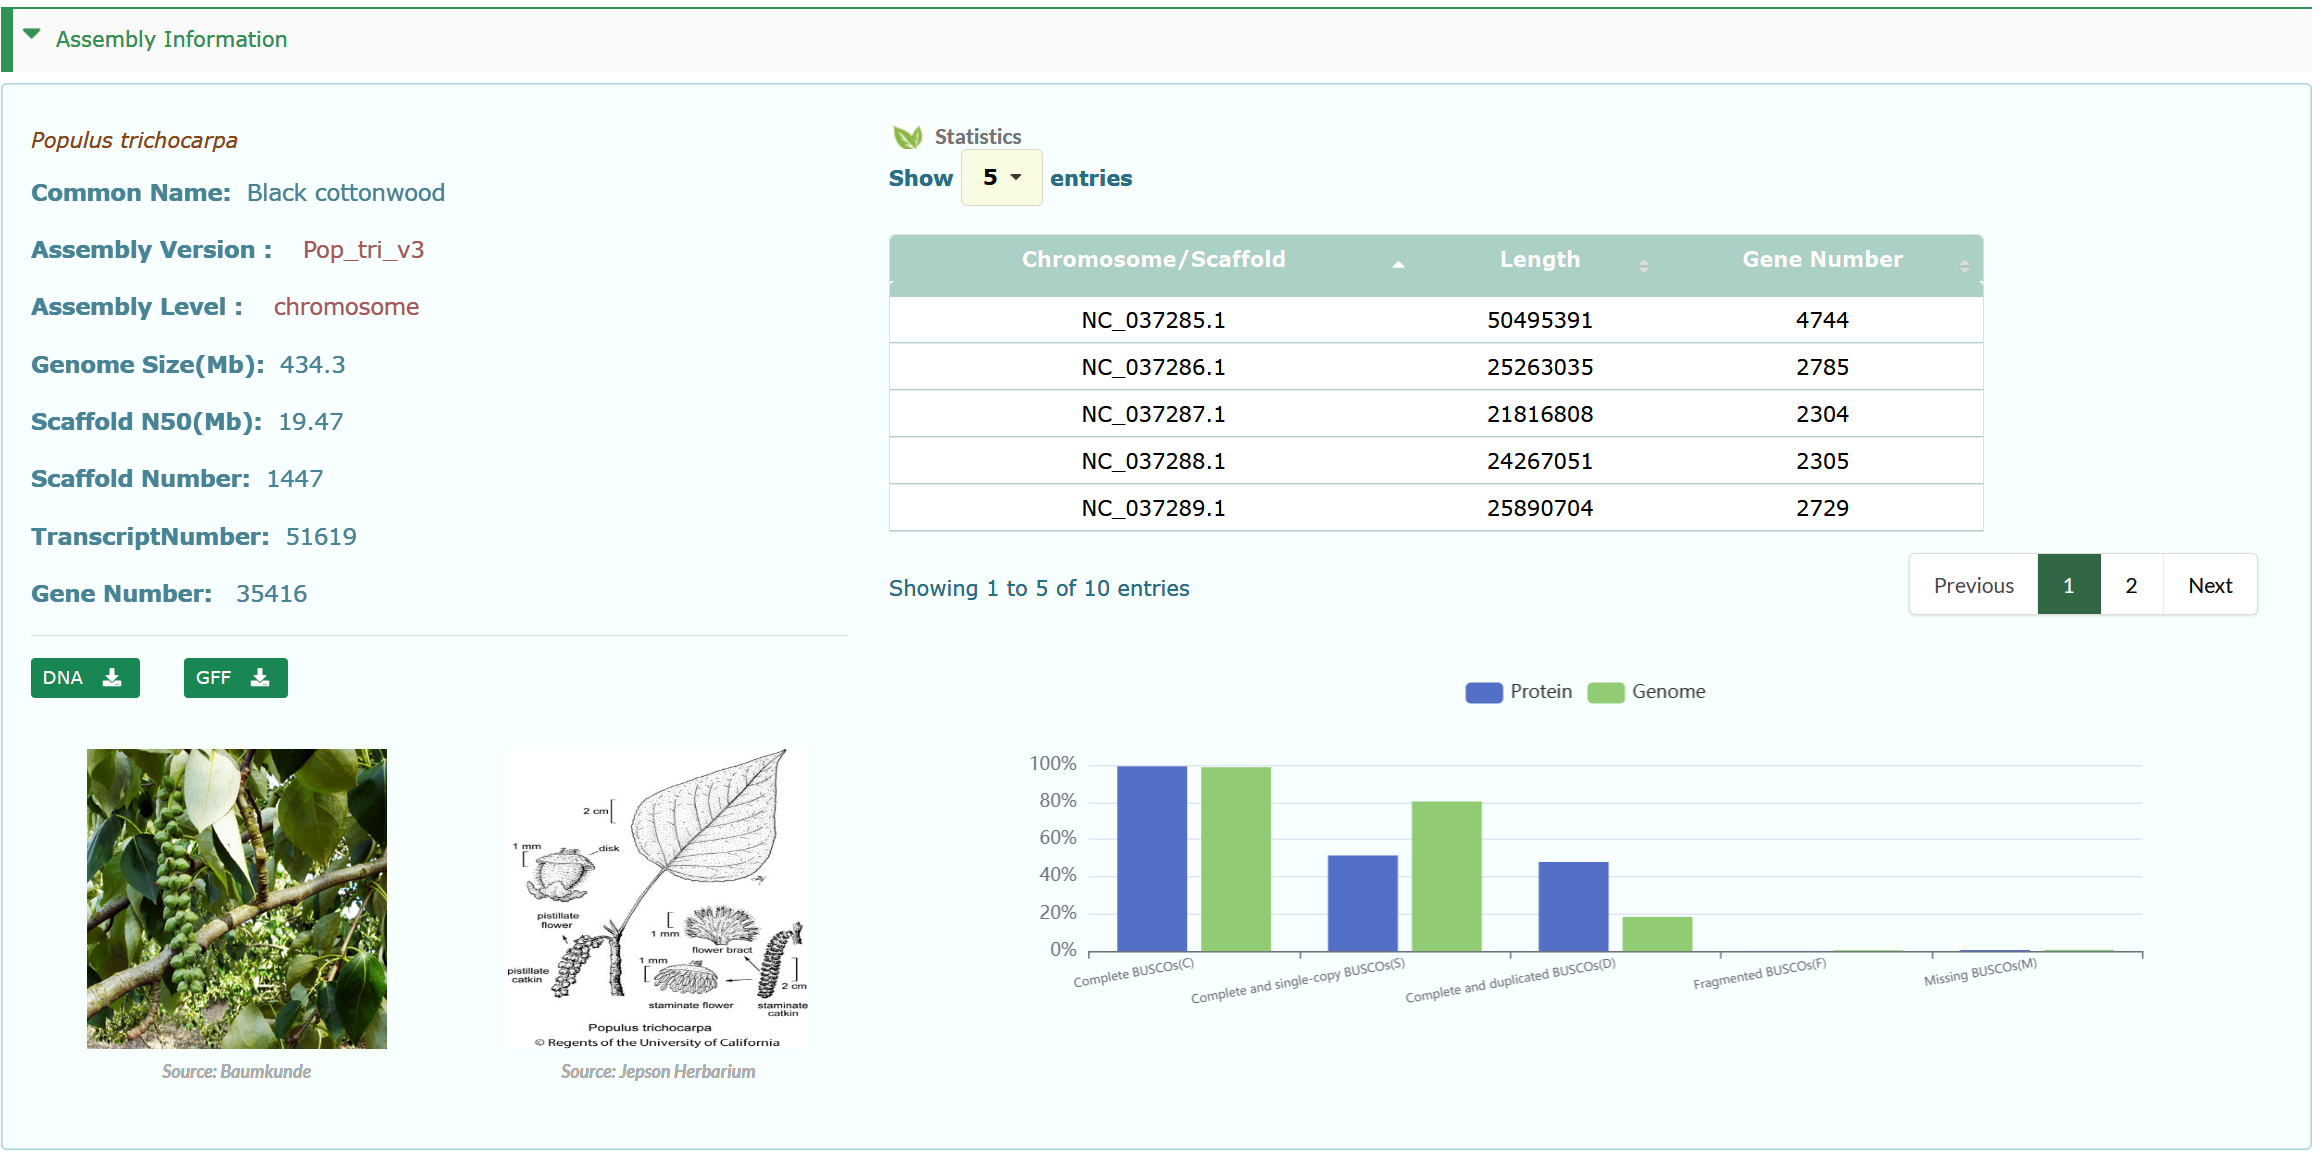
The Genome Information interface provides assembly information of species genomes, including assembly level, genome size, and N50. It also provides visualization of the quality assessment results of genomes and proteins. The number of genes and the number of transcripts of all the species were counted. At the same time, the length of the chromosome\scaffold and the number of genes of the species are displayed in the form of a table.
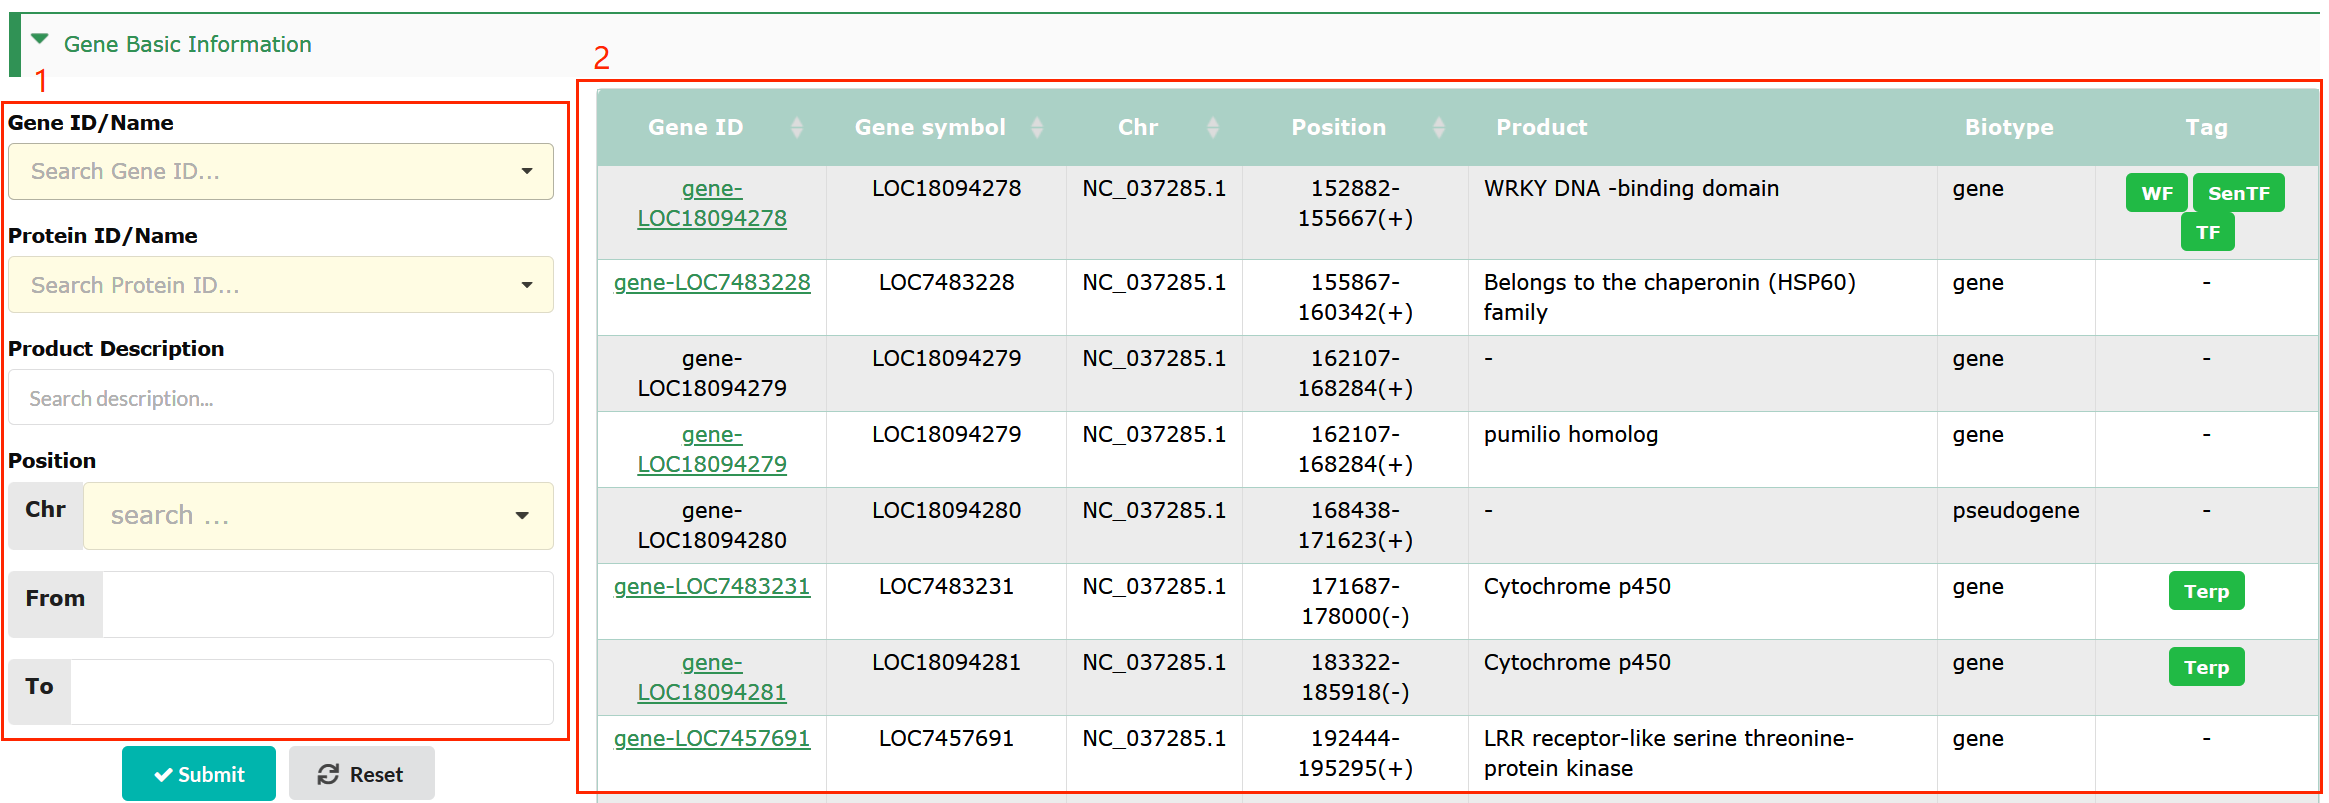
All genes of the species are displayed in box 2, and users can search for genes of interest according to gene id/name, protein ID/name, Product Description. The chromosome or scaffold names are dynamically displayed in the 'Position' drop-down menu. Choose any option and then type in the position in bp in the text boxes (box 1). Users can intuitively browse the basic information of genes in box 2. Tag: When a gene exists in the data set of these modules, it will be marked with the corresponding Tag, including TF (Transcription Factor), HTG (Horizontal Transfer Genes), RG (Resistance Gene), WF (Wood Formation), Terp (Terpene Biosynthesis), Dor (Seasonal Dormancy), SenTF (Leaf Senescence Transcription Factor).
Gene Detail
This page provides comprehensive information (box 2) about the protein coding gene of interest. The left-side navigation bar on the interface enables quick access to the corresponding entries in that interface (box 1).

Basic Information
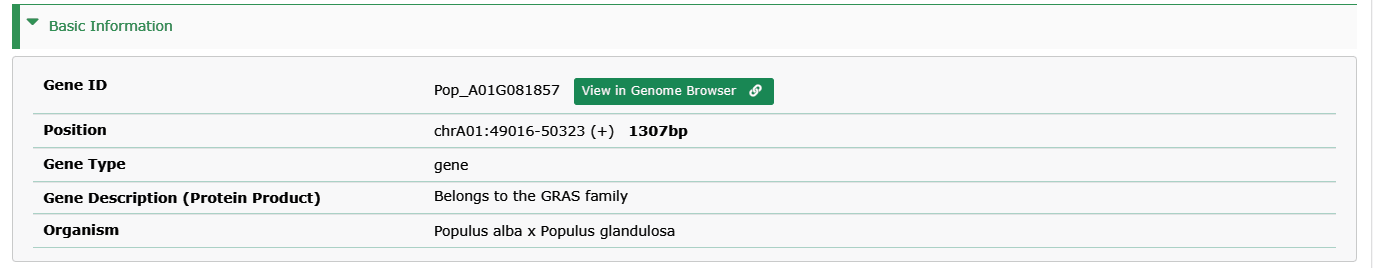
- Gene ID:The ID collected in PPGR.
- Position: The position and length of genes on chromosomes.
- Gene Type: Type of genes, including gene, pseudogene, rRNA, tRNA, etc. (NOTE: Only Protein-coding gene provides gene detailed information interface)
- Gene Description (Protein Product): The description of genes or the function of their products.
- Organism: Species to which genes belong.
Gene Structure
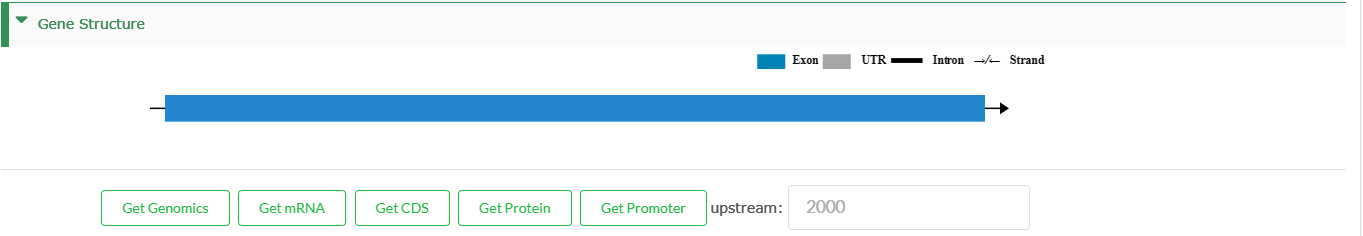
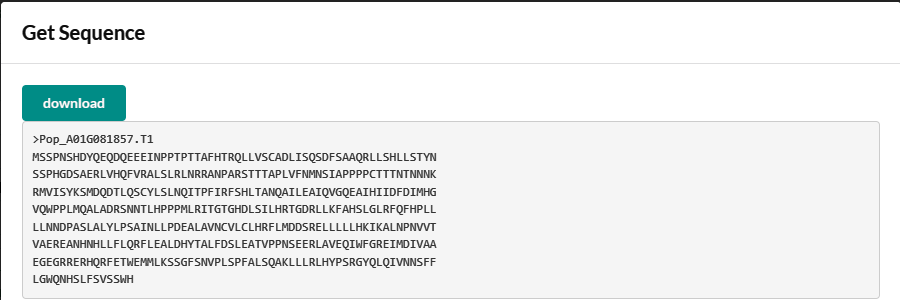
- An interactive mode of gene structure. Blue boxes represent exons. Black lines represent introns. An arrow indicates transcription direction.
- Obtaining the sequences of genes, including genomic sequence, mRNA, CDS, protein and promoter (2,000 bp upstream of transcription start site).
Domain
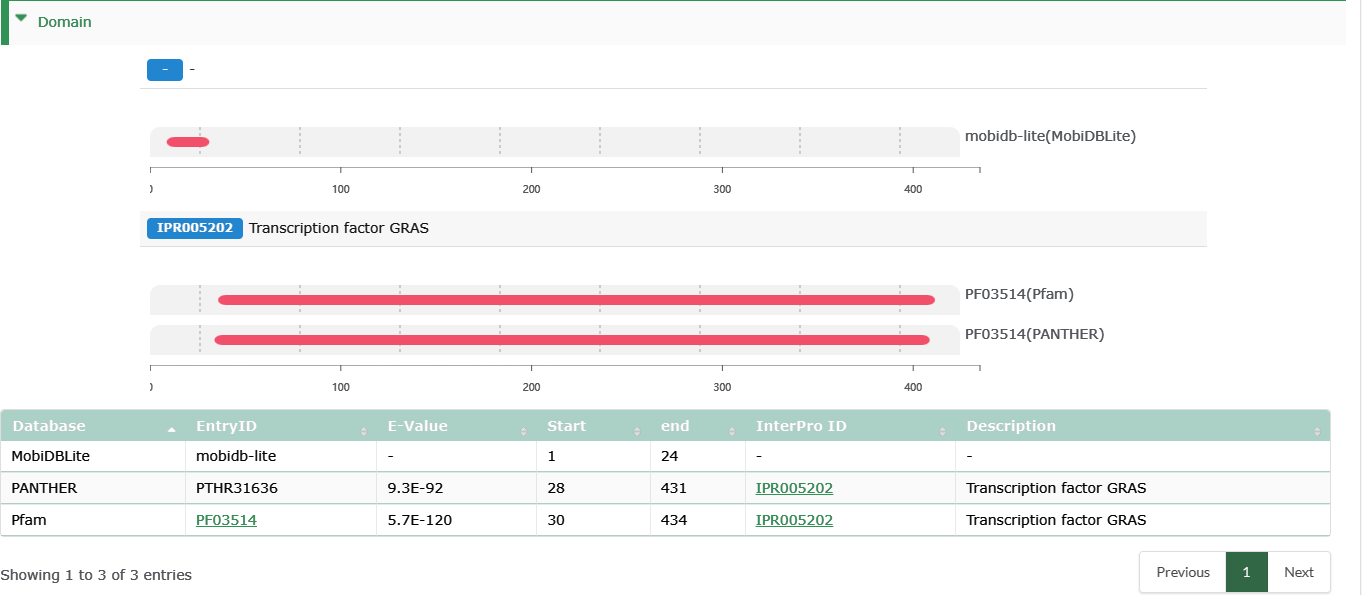
- Domain and other features identified by InterProScan v5.
Regulation&Interaction
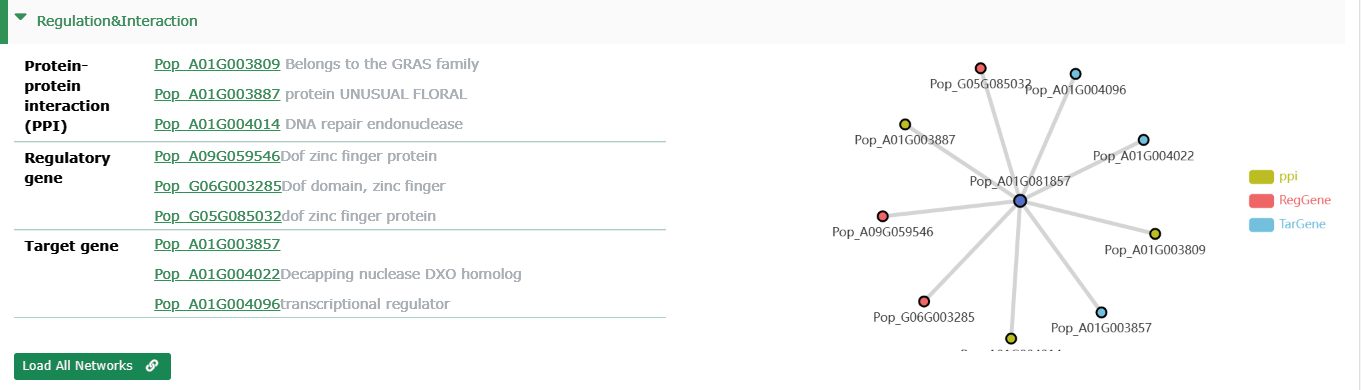
The current interface only shows some other genes that interact with the current gene,
- Protein-protein interaction (PPI): Genes that interact with current genes (Represented by gene id for its protein id).
- Regulatory gene: Upstream transcription factors of genes.
- Target gene: Downstream targets of TFs.
- Target gene: Downstream targets of TFs.
Annotation
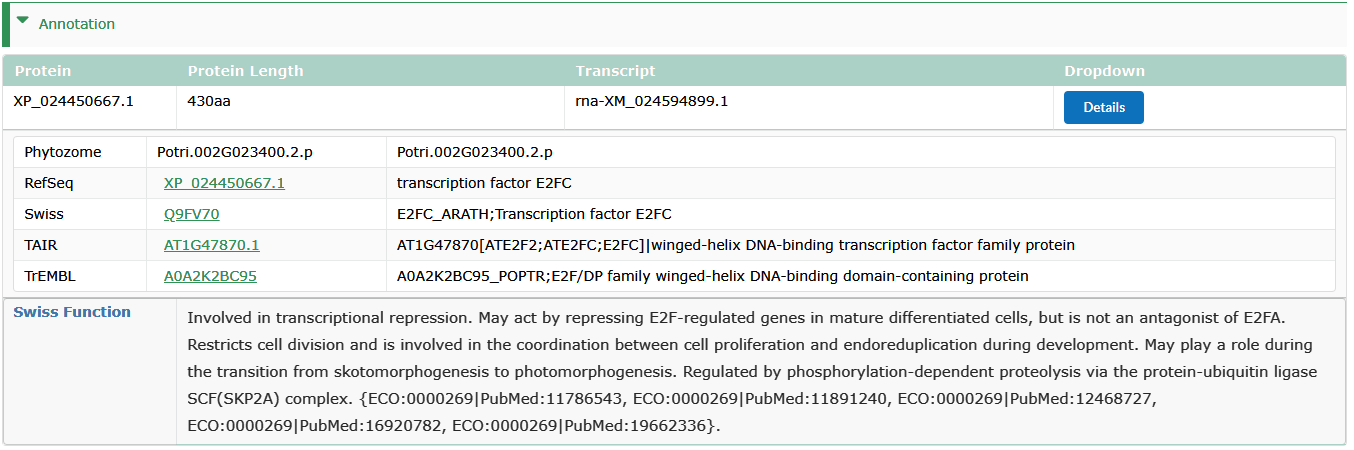
- The best Blast hit from Refseq,SwissProt, TrEMBL and TAIR.
- Swiss Function : Expert-curated functional descriptions were collected from UniProt.
Orthologous Group
Genes with the same ID belong to the same homologous gene family. The number of species with the homologous family, the number of all members of the homologous family in PPGR, and the number of members of the homologous family in the current species are counted.
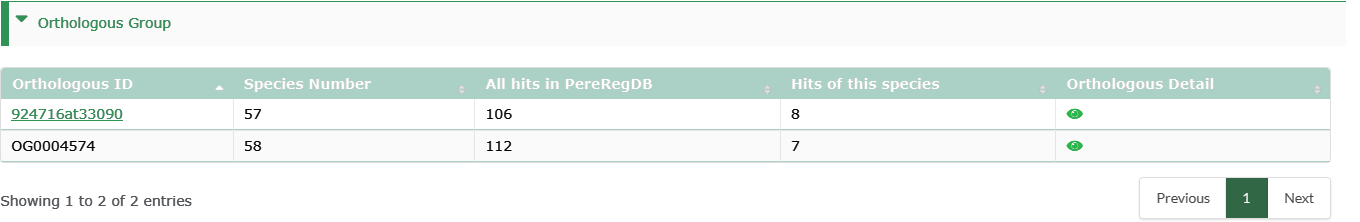
- OG ID: The protein sequences from genome annotation for 60 species were used to paring BLAST reciprocal best hits (RBHs) and inferred orthologous groups (OGs) as follows.
- OrthoDB: Orthomapper is used to map protein sequences from 60 species to OrthoDB. Click the ID to link to OrthoDB.
Expression

- Box 1 is the statistics of transcript expression for this species.
- The column graph represents the expression profile of genes in different bioproject (box 2).
- The box plot illustrates the gene expression profile in different tissues (box 3).
Pathway
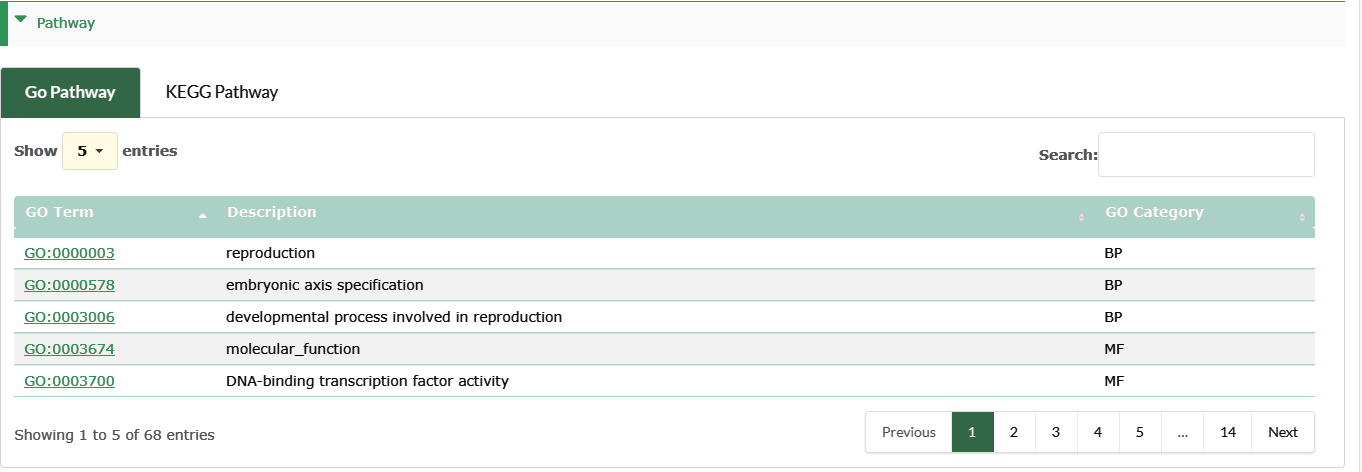
- Box 1 is the statistics of transcript expression for this species.
- GO Pathway : The GO annotation of genes can be viewed at the information page of corresponding genes.
- KEGG Pathway : The KEGG annotation of genes can be viewed at the information page of corresponding genes.
Network
The Network module provides a comprehensive regulatory network view of genes, and the network integrates the 3 types of relationships between genes. It provides researchers with a macro-control perspective.
Analysis & Method
Protein-Protein Interaction (PPI)
The prediction of PPI combines four kinds of evidence, and then scores the collected four kinds of evidence, assigns different weights, and obtains the final combination score after calculation. Higher scores indicate more reliable predictions (the highest score is 1).
- We have calculated the Protein-Protein Interaction (PPI) score for each species using four sources of evidence: experimental data, known interaction data, text mining results, and manual review.
- Use keywords such as 'Protein-Protein Interaction', 'Y2H', 'CoIP', 'BiFC', 'pull-down' to search relevant literature, and integrate relevant
- Binding protein interaction-related domains, co-expression and other evidence
TF-target interactions (TTI)
The results of Motif Prediction are divided into two types of inter-gene relationships displayed in the network: Target Gene and Regulatory Gene.
- Target Gene: If the central node of the network is TF, its downstream regulated target genes are called Target Genes
- Regulatory Gene: The upstream transcription factors of the gene is called Regulatory Genes
The prediction of Motif Prediction combines the regulatory data sets of JASPAR and PlantTFDB,
- Extract the promoter regions (+2kbp) of all genes from 60 species
- Use the FIMO program of the MEME toolkit to predict the transcription factors binding motif of the promoter region
- According to the family type of the predicted motif, divide it into the corresponding TF family
Co-Expression Gene
WGCNA(Weighted gene co-expression network analysis) is a widely used data mining method that includes functions for network construction, module detection, gene selection, calculations of topological properties, visualization, and interfacing with external software. In this platform, WGCNA is used for finding clusters (modules) of highly correlated genes, for summarizing such clusters using the module eigengene or an intramodular hub gene, for relating modules to one another and to external sample traits (using eigengene network methodology), and for calculating module membership measures.
Automatically select the soft threshold β through function calculation, construct the adjacency matrix, establish the network, and select the connection weight >0.8 for display.
Interface introduction
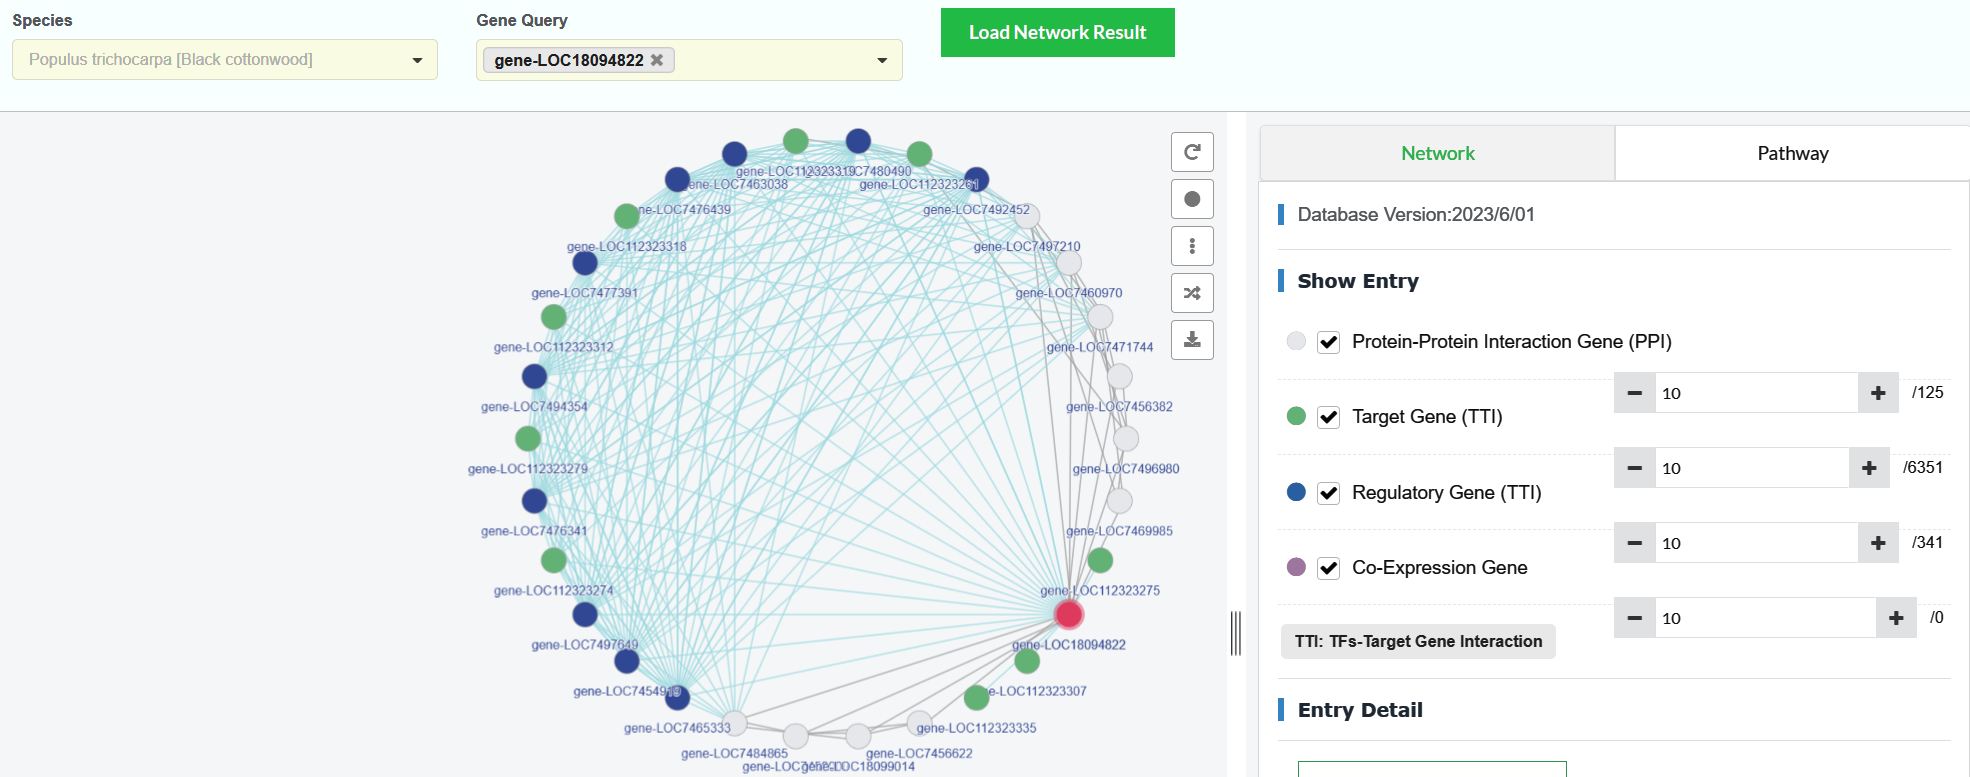
The Network interface is an interactive and highly customizable interface, showing users a multi-dimensional comprehensive gene regulation and interaction network, which is convenient for users to dig out the relationship between genes that is beneficial to subsequent research.
The network view summarizes the network of predicted associations for a particular group of genes. The network nodes are genes. The edges represent the predicted functional associations. The physical distances between two nodes along an edge in a graph has no meaning。
The colors of network nodes represent five different regulation and interaction relationships. Users can select/cancel view the types of nodes in the network view, and adjust the number of nodes in the network view.
- Red nodes - Query Genes
- White nodes - Protein-Protein Interaction
- Green nodes - Target Gene
- Blue nodes - Regulatory Gene
- Purple nodes - Co-Expression Gene
- Orange nodes - TFs-DNA banding interaction
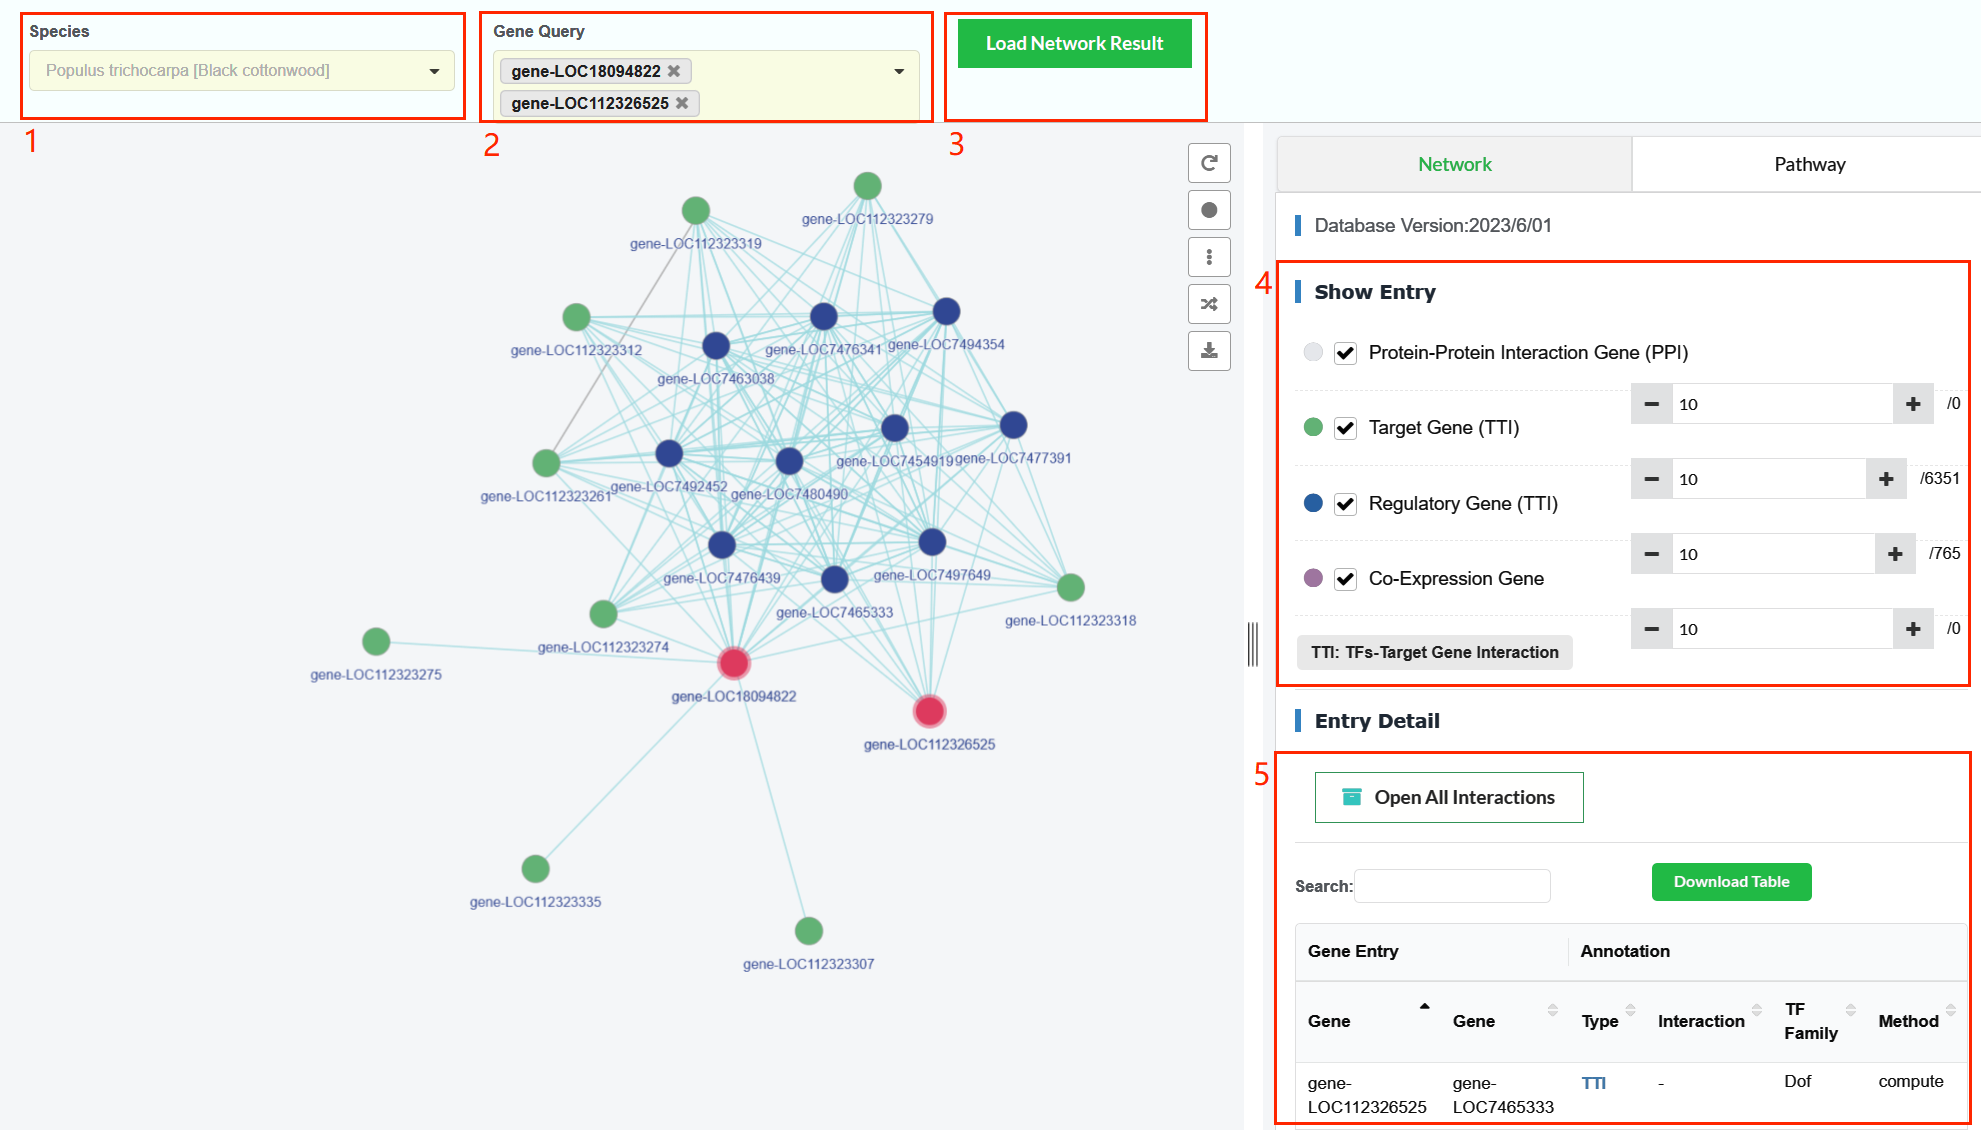
- In the 'Network' page, the user enters a specie in the 'Species' box (box 1).
- The user enters one or more gene IDs in the 'Gene Query' box (box 2).
- Click the 'Load Network Result' button to load the genes regulation and interaction networks (box 3).
- The dataset for gene interaction and regulation is divided into six types:Query Genes (red nodes), Protein-Protein Interaction (white nodes), Target Gene (green nodes), Regulatory Gene (blue nodes), Co-Expression Gene (purple nodes) and TFs-DNA banding interaction (orange nodes). The user can choose the type of regulations they are interested in, and can also increase or decrease the number of genes in the network (box 4).
- A list of all genes displayed on the network (box 5).
Pathway

- The GO and KEGG annotations of all genes in the network are listed here (box 1).
- Users can click on the GO and KEGG entries they are interested in, and the relevant genes will be highlighted in the network (box 2,3).
Users can view the description of the gene through the table or click on the node. In 'Pathway', you can view the GO and KEGG annotation information of the genes in the view, and you can select the GO/KEGG entry of interest to view the related genes in the network view.
Network Figure

- Hover the mouse over a gene in the network, and the gene node associated with that gene is highlighted (box 1).
- Click on the gene to pop up a floating window for gene information (box 2).
- Click the 'Search This Node' button to jump to the detailed information interface of the gene. Click the 'Add This Node' button to add the gene as the main node (Query Gene) of the network (box 2).
- Right-click on a node to adjust the node to the color of interest
Resources
Horizontal Gene Transfer
Analysis & Method
For each gene’s protein sequence, we evaluated whether it had been horizontally acquired using a two-step workflow following the pipeline provided.
- We first carried out a BLASTP in DIAMOND (v2.1.6.160) search against a custom database (NR) consisting of the reference protein sequences (Refseq), with an e-value cutoff of 10-10. We next used HGTfinder to analyze BLASTP result file.
- Using this information, we next calculated: (a) the Alien Index: AI = (bbhO/maxB)-(bbhG/maxB), and (b) the percentage of species from OUTGROUP lineage (outg_pct) in the list of the top 1,500 hits that have different taxonomic species names.
Then candidate HTGs with AI > 0 and outg_pct > 80% were used build a phylogenetic tree
- We retrieved the 1,500 most similar homologs from the NR database, aligned them by the MAFFT (v7.520), with '–auto' option.
- trimmed ambiguously aligned regions using trimAl (v1.4) with '-automated1' option.
- We then used the resulting align ment to infer the ML tree using IQ-TREE (2.2.2.2) with its best-fitting model of amino acid evolution and 1500 ultrafast bootstrapping replicate.
- We rooted each ML tree at the midpoint using the ape and phangorn R packages. HGT is widespread in insects and contributes to male courtship in lepidopterans. Cell, 185: 2975-2987.e10.
Interface introduction
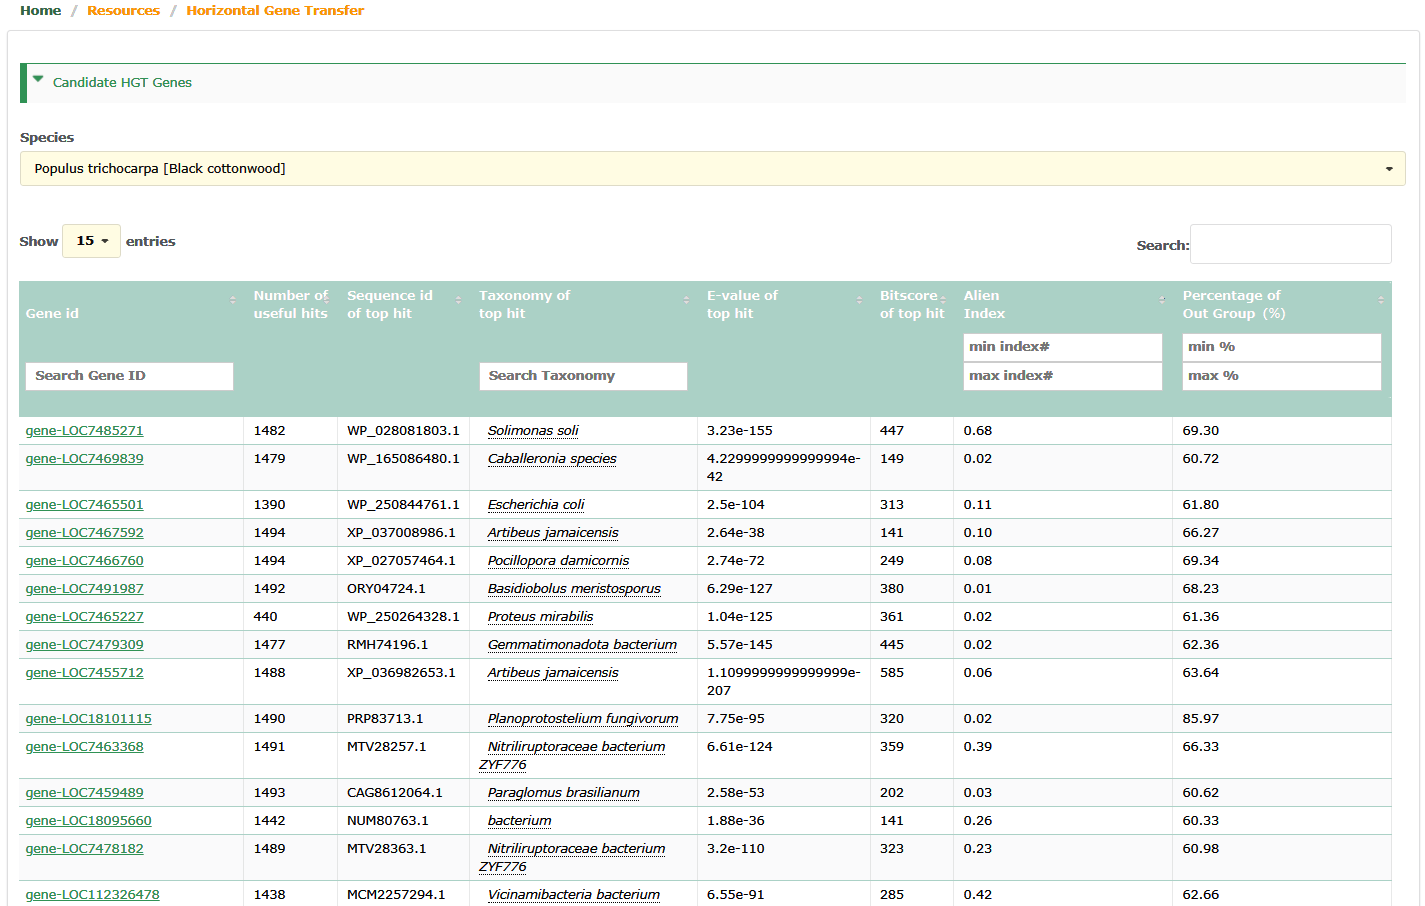
Shows the basic information of Candidate Horizontal Transfer genes. Users can filter horizontal transfer genes by setting AI and outg_pct range, and select interested horizontal transfer genes by the hit species.
- Gene id : Gene id (candidate horizontal transfer genes ) of species from PPGR .
- Number of useful hits : Number of hits (The top 1,500 hits) of candidate Horizontal Transfer genes against the NR.
- Alien Index : The higher the value of Alien Index (AI,0~1), the more stringent it is.
- Percentage of Out Group : The percentage of species from OUTGROUP lineage in the list of the top 1,500 hits that have different taxonomic species names. The higher the value of percentage (60%~100%), the more stringent it is.
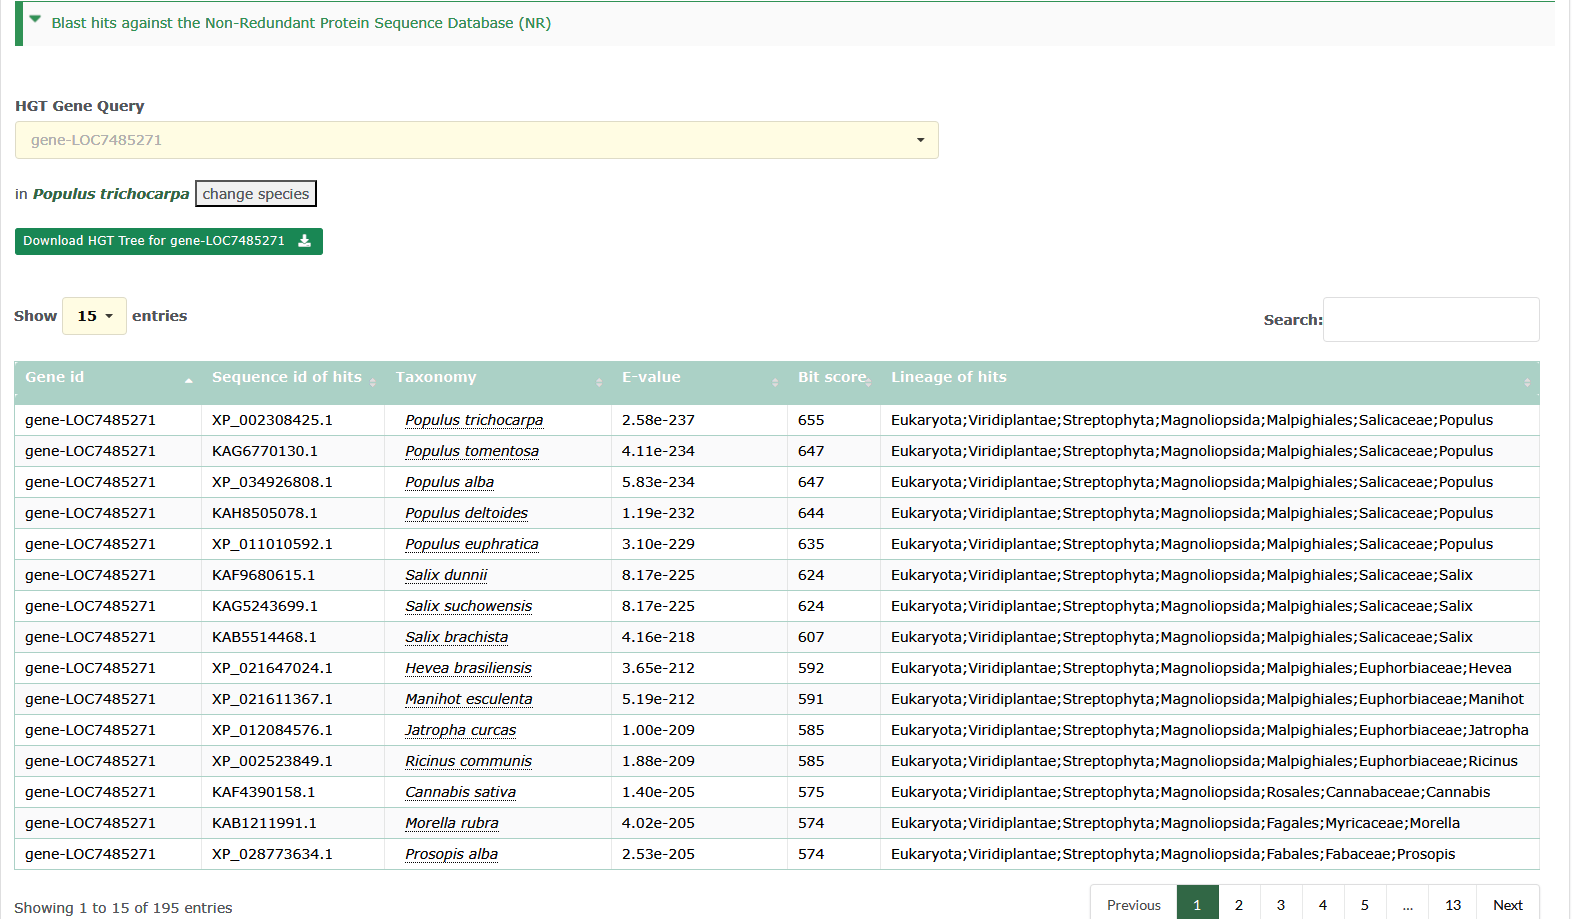
Users can view all the hits information of the horizontal transfer genes by searching for interested.
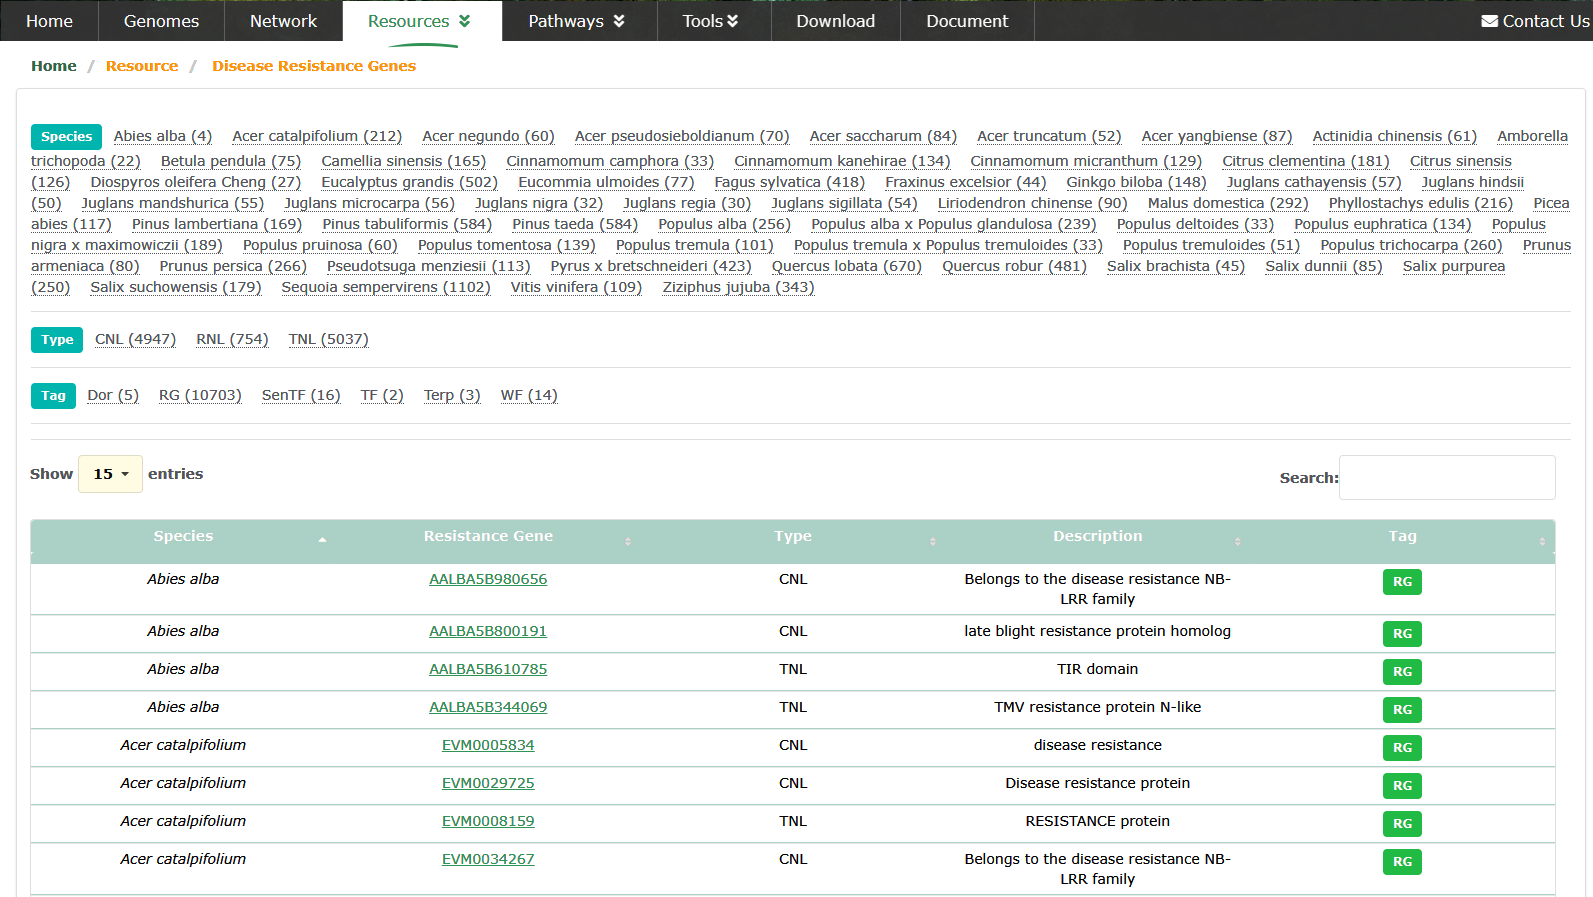
Disease Resistance Genes
The important role of Disease Resistance Genes/Nucleotide Binding Leucine-rich Repeat Receptor Genes (NLR) in perennial plants is to provide disease resistance and help plants resist attack by pathogens during long-term growth. Perennials have long lifespans and long growth cycles, so resistance to disease is critical. Perennial plants grow for a long time and are prone to accumulate pathogens. Without sufficient disease resistance, plants may be attacked by severe diseases, resulting in limited growth, reduced yield or even death. We predicted the disease resistance genes of 60 species through our internal pipeline, and marked as RG in the Tag label.
Transcription Factors
Transcription Factor (TF) is an important part of plant regulatory network. We first predicted the TFs of 60 species through PlantRegMap, and then further screened the predicted TFs according to Family assignment rules.
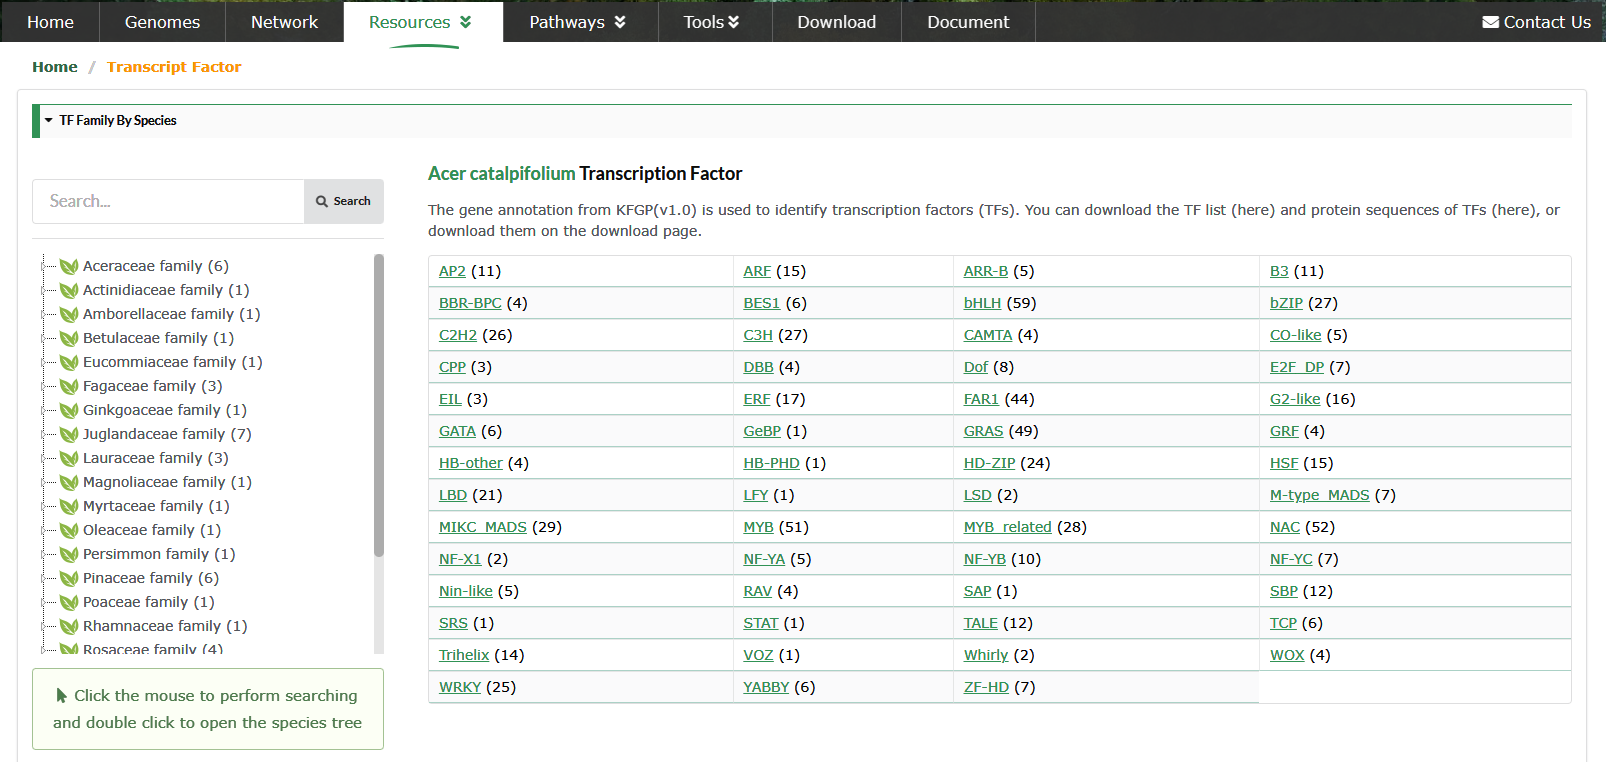
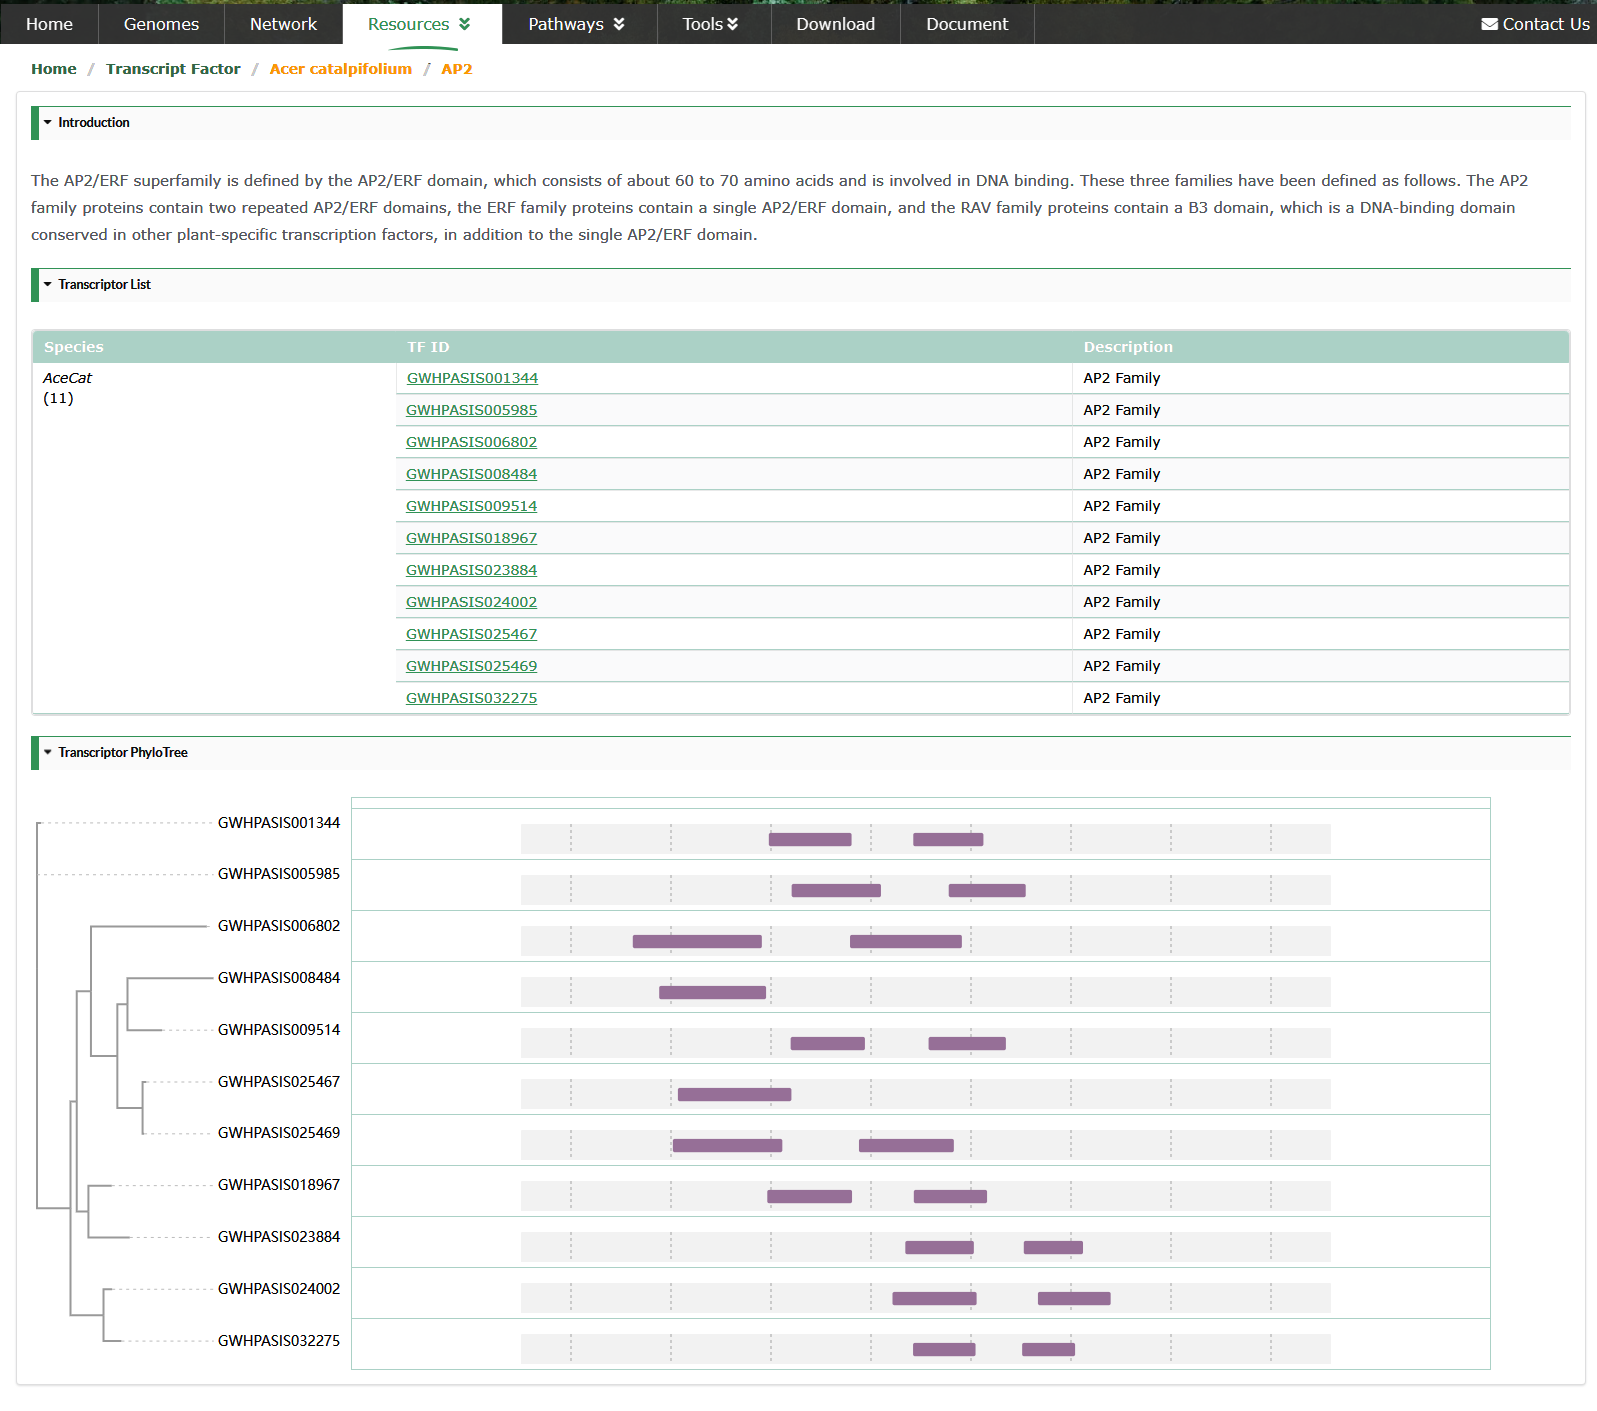
Users can view all members of the TF family of the species of interest, as well as the phylogenetic tree of the family members. We use Protein iD instead of TF ID.
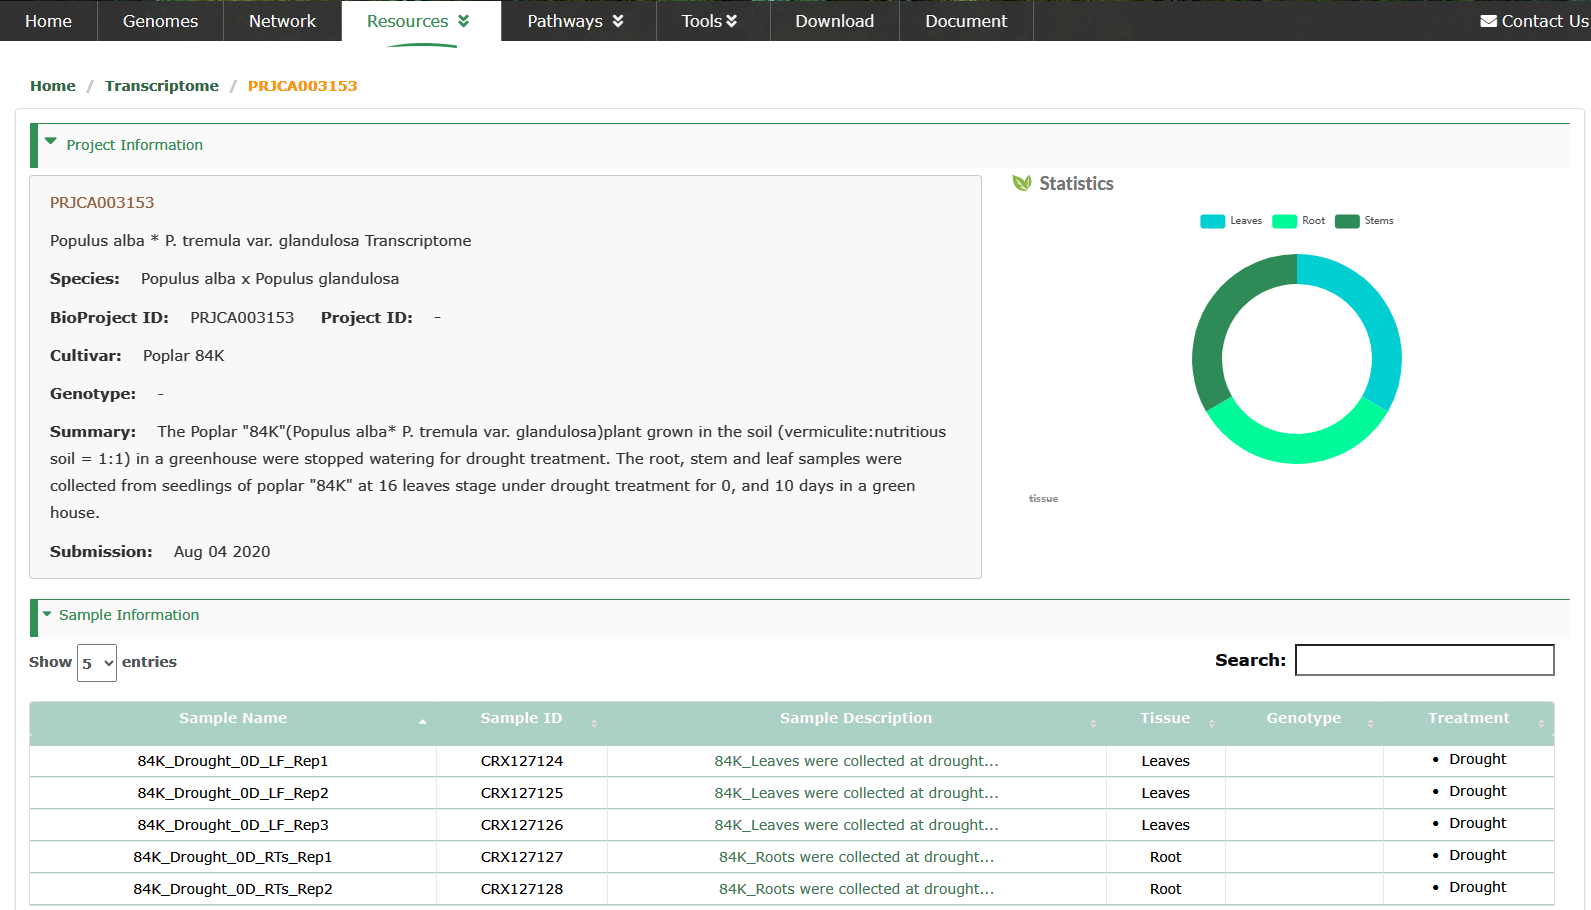
Transcriptome
We collected 9,016 samples of 39 species from public databases and recalculated TPM values for RNA-Seq data.
We manually reviewed and edited the information of all collected samples and unified the format. This information is displayed in the Transcriptome interface, which is convenient for users to view and understand.
In the sidebar on the left side of the interface, the statistics of the number of projects of transcriptomes of species and the number of samples of different tissues are integrated.

The details of the project are displayed.
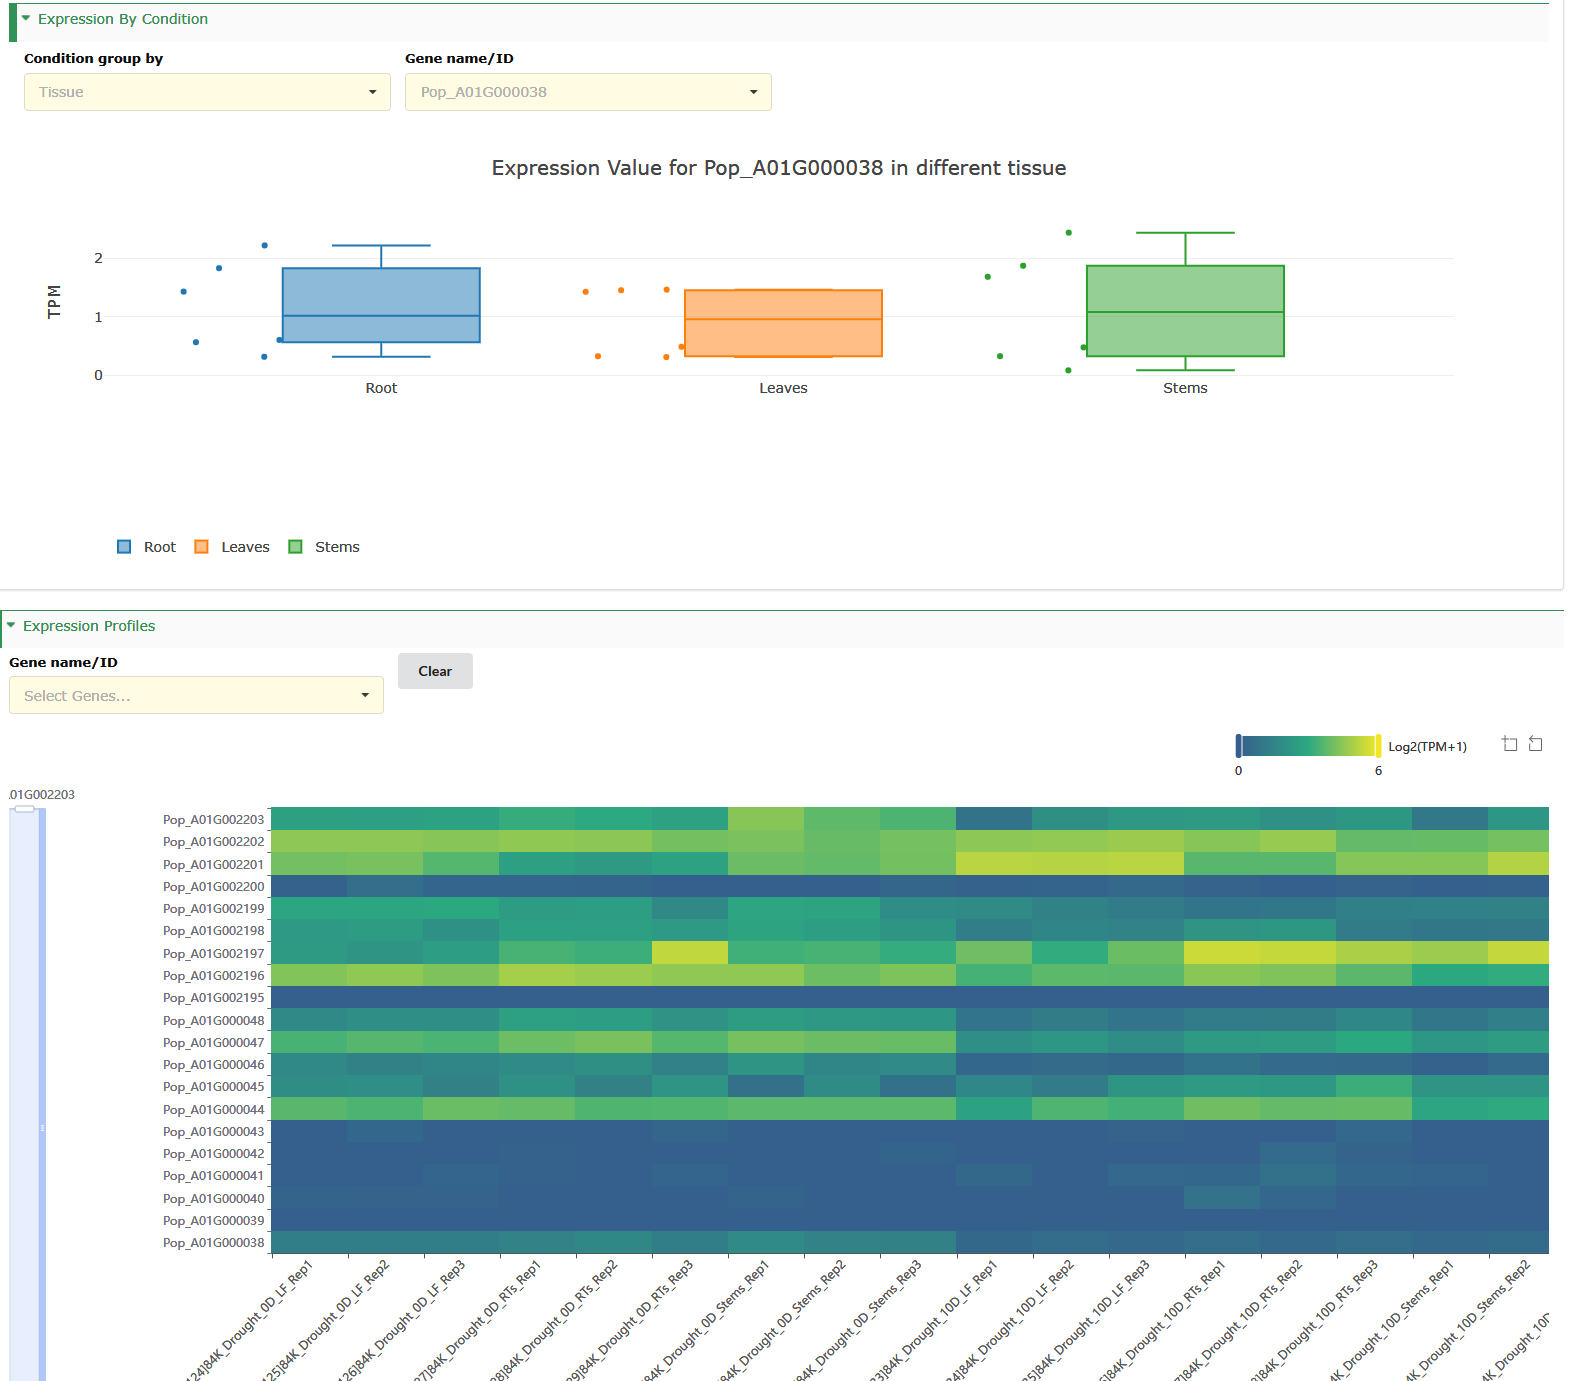
Select to view boxplots and heatmaps of the expression profiles of different genes in different tissues.
Pathway
We have collected important pathways in four perennial plants to provide researchers with detailed pathway resources.
Analysis & Method
- Collect the literature related to the four pathways, and manually review, draw the pathway diagram and table.
- Use BLASTP (e-value=1e-10) to search for homologous genes of pathway genes in each species in PPGR.
- Other annotation evidence for genes that bind PPGR, including Swiss, RefSeq, OrthoDB, TAIR, TFs. Different scores are assigned to homologous genes.
- We divide the same TF family or genes with similar sequences into a GROUP. The highest confidence score in the same GROUP is adjusted to 10 points, and the others are adjusted proportionally.
- Finally, we construct a phylogenetic tree for the genes with a confidence score > 6 in each GROUP.
Interface introduction
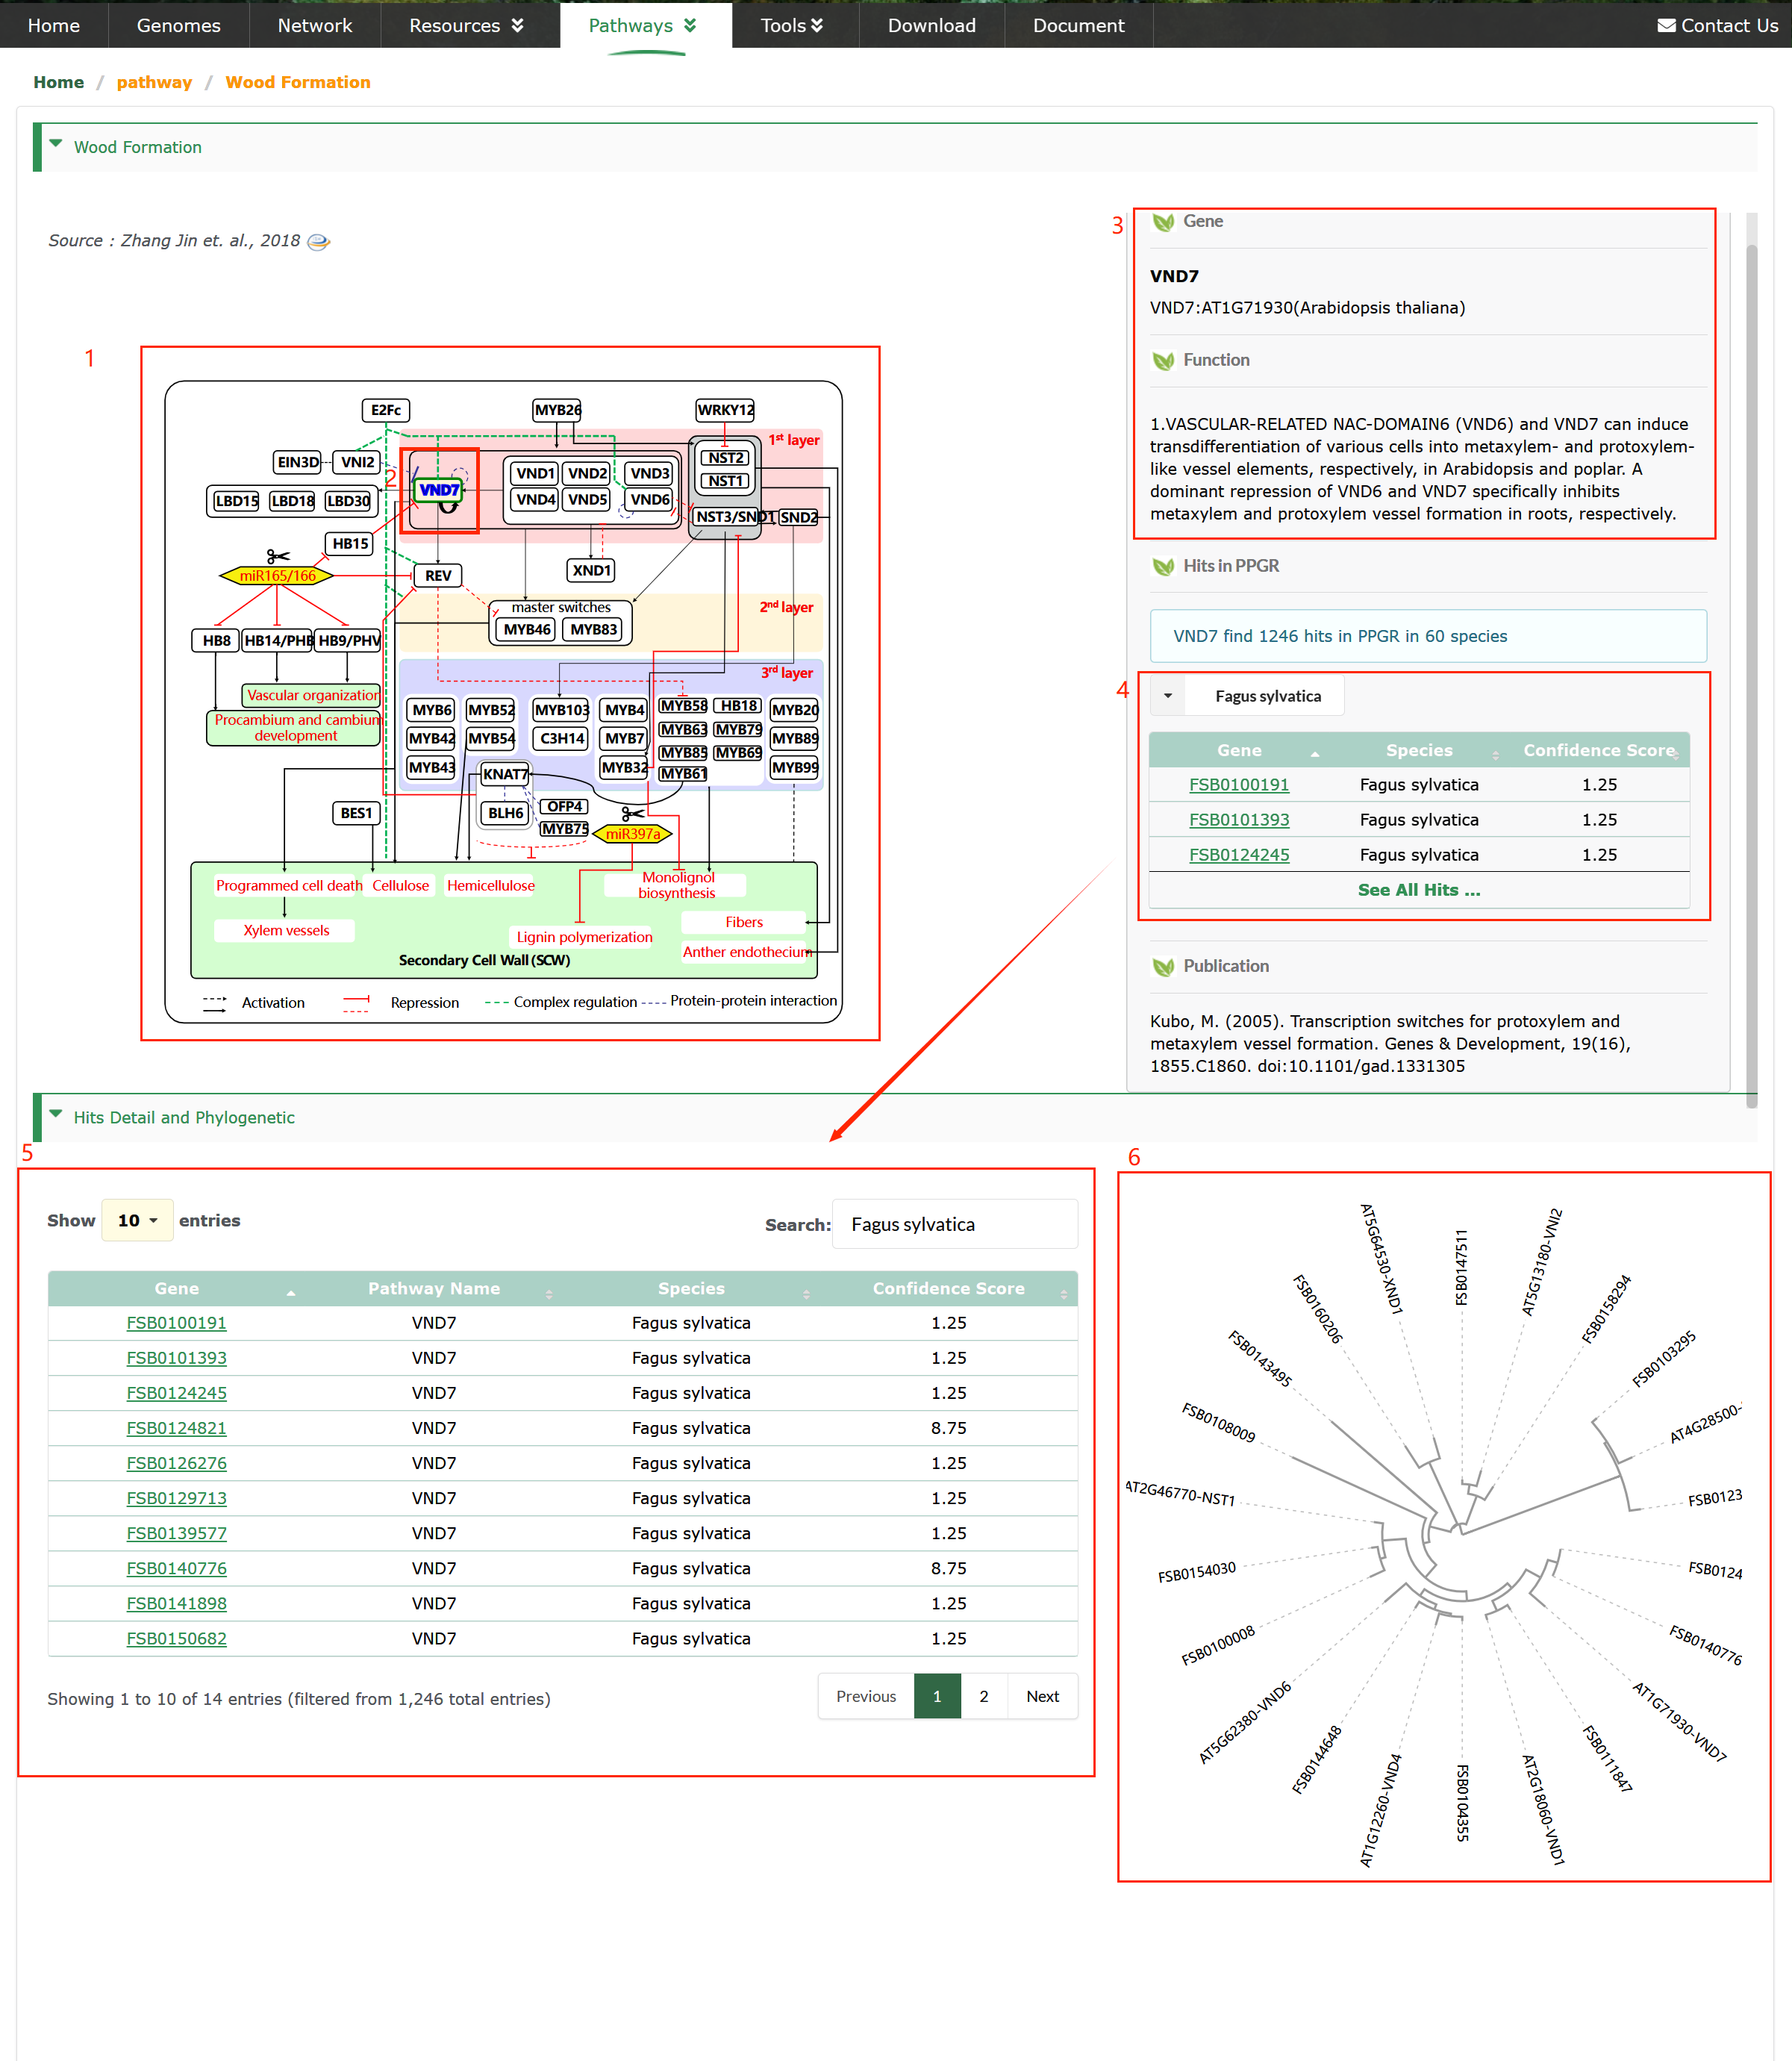
Seasonal Dormancy, Terpene Biosynthesis, Wood Formation
These regulatory pathways of perennial plants have been extensively investigated and are well understood (box 1). Users have the ability to click on the genes name of their interest (box 2), which enables them to access detailed information, including reference genes, functional annotations (box 3) and publication.
Orthologous genes of reference genes (box 4,5). The gene with the highest confidence score among orthologous gene of the same reference gene is the most reliable.
- Gene : Genes reporting in model species (box 3). The reference gene sequence is utilized to search for orthologous genes from PPGR (box 4).
- Function : Function of reference genes (box 3).
Leaf Senescence Transcription Factors
Leaf Senescence Transcription Factors
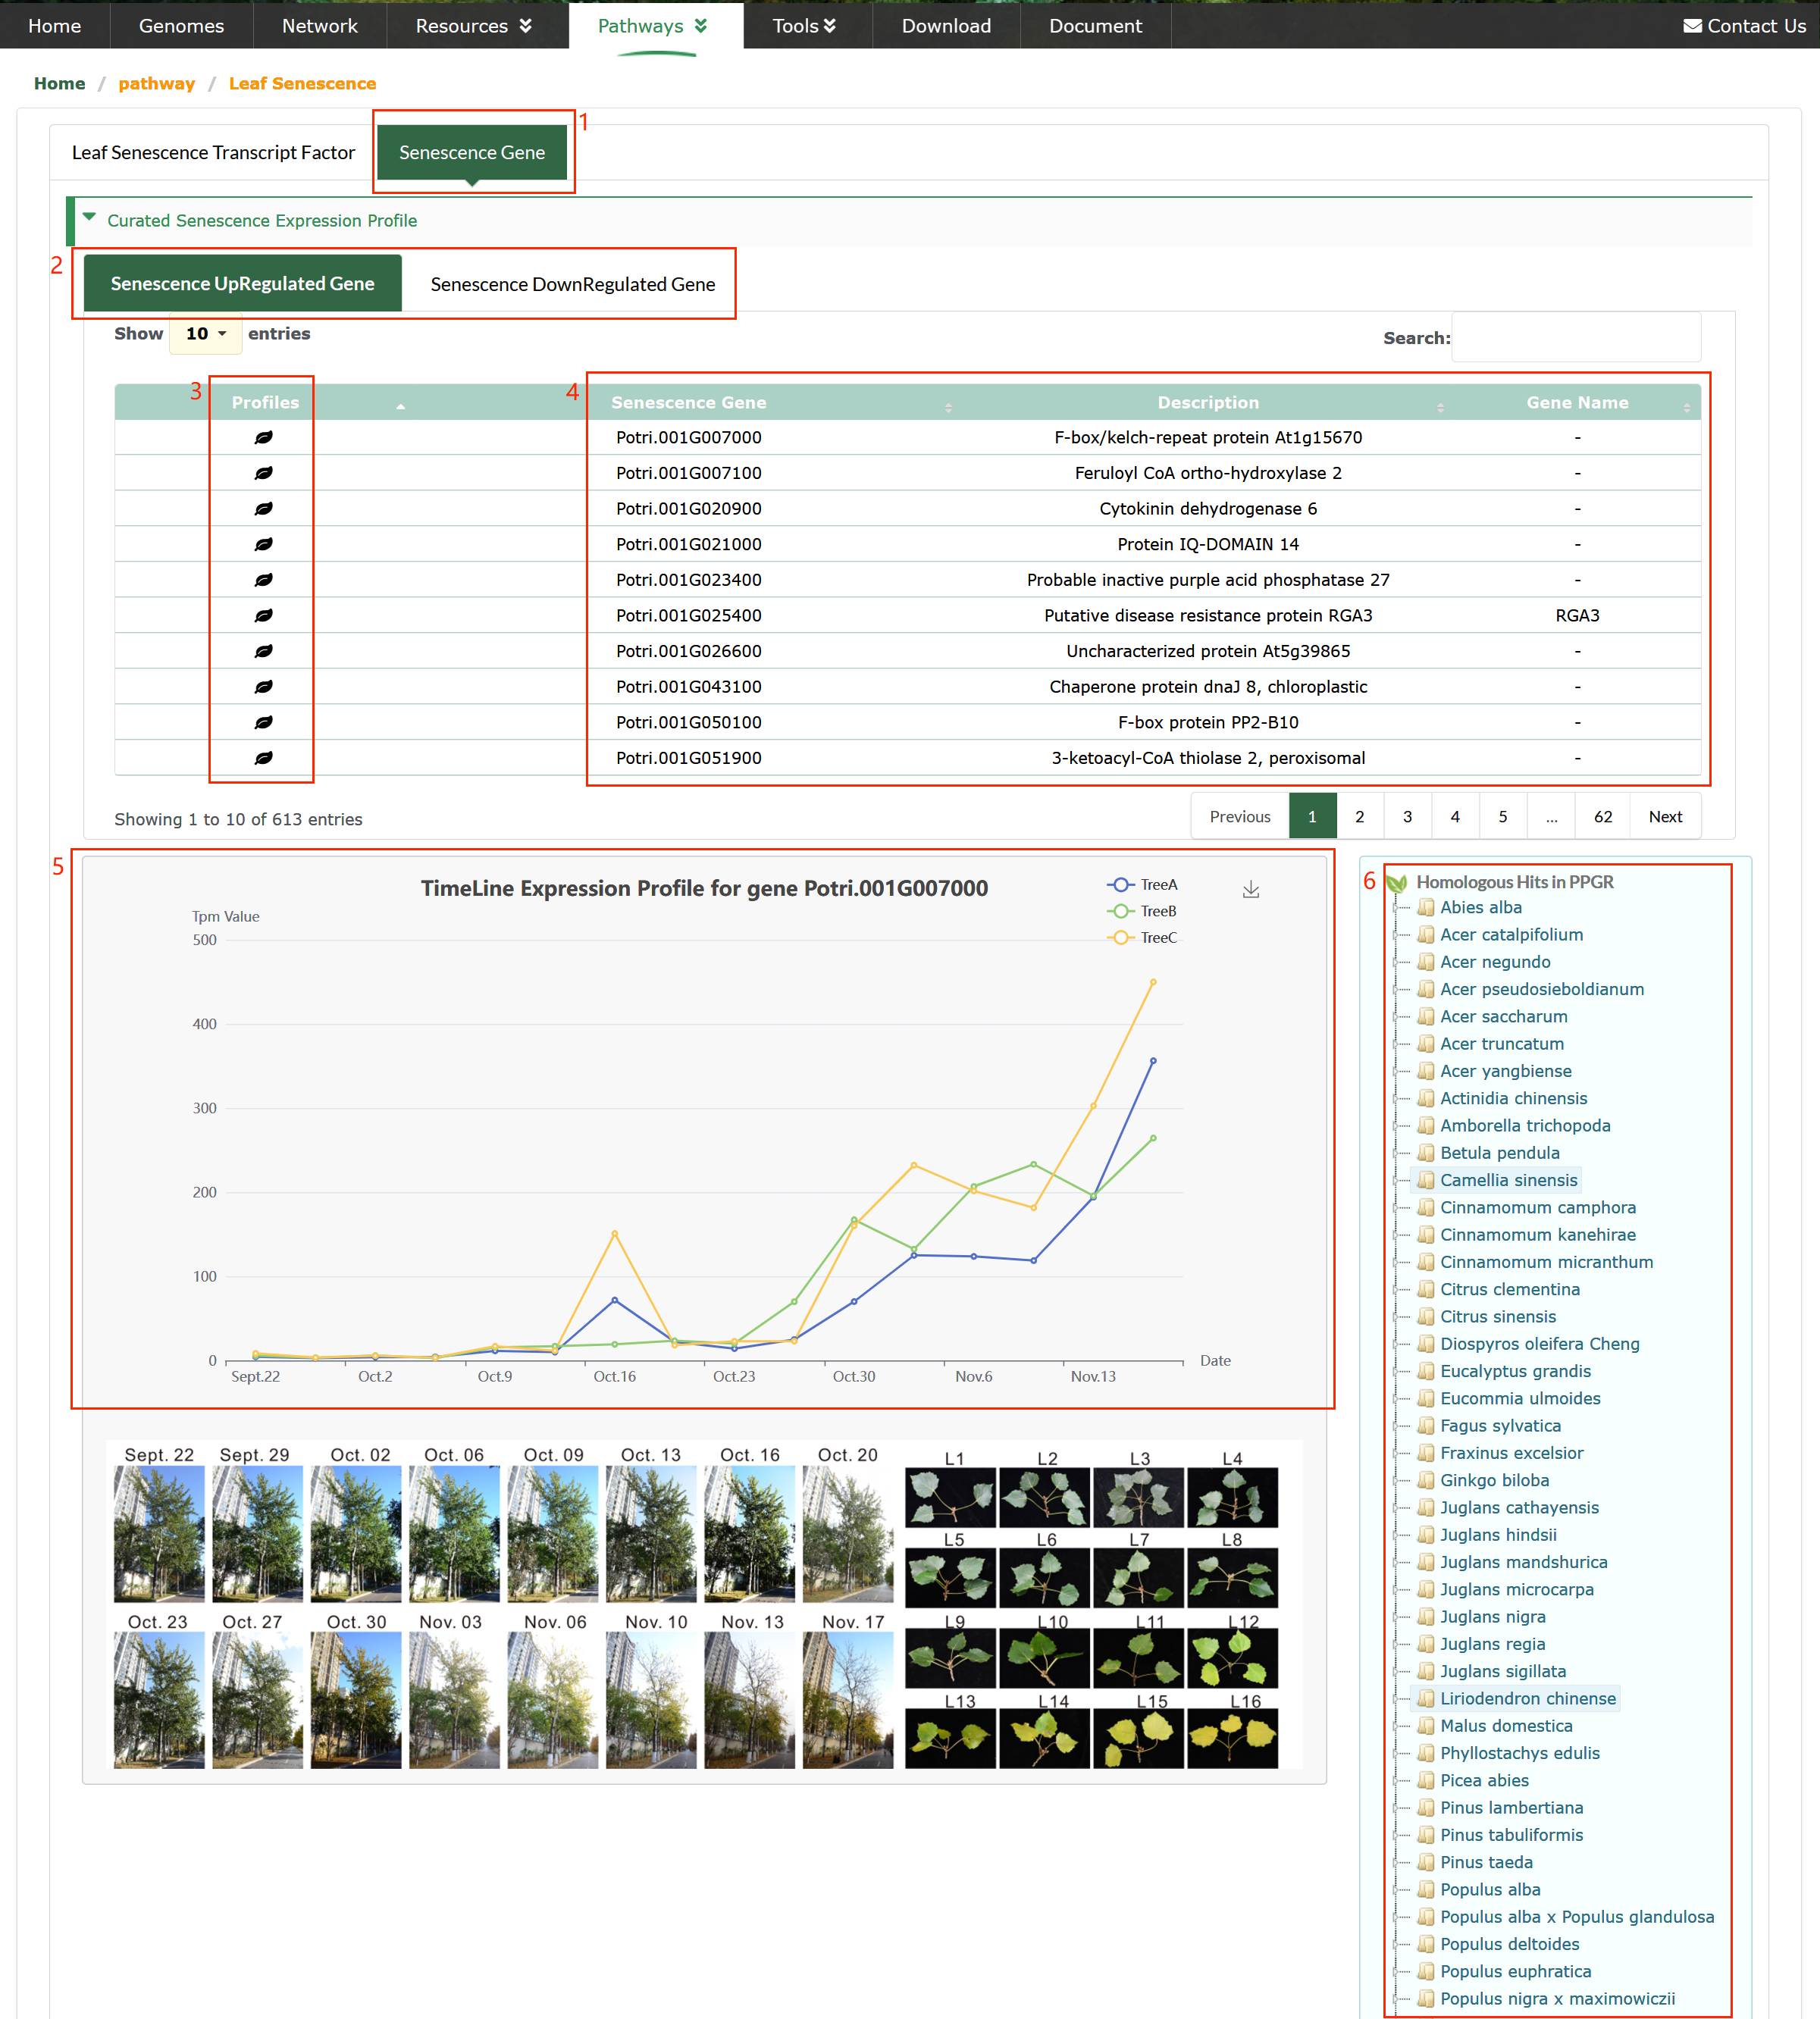
Users can browse information on Leaf Senescence TFs (SenTFs) (box 1). Users have the ability to click on the TF name of their interest (box 2), which enables them to access detailed information, including reference genes, functional annotations (box 3) and publication (box 6).

Senescence Gene
Senescence-associated genes in Poplar (box 1).
The upregulated\downregulated genes in poplar (box 2).
High-resolution temporal profiling of transcripts associated with autumn leaf senescence in poplar (box 4).
Autumn leaf senescence in field-grown poplar trees. The images were taken during the sampling period from September 22 to November 17, 2018 (16 time points).
Branches and leaves were taken from three individual trees. Representative leaves (L) are shown (L1 to L16). Bar = 10 cm (box 4).
Click the icon in box 3 to obtain the gene expression pattern Line chart (box 5).
The orthologous genes of the upregulated\downregulated genes in poplar (box 6).
Case Study
Wood formation is a critical biological process in perennial woody plants. In order to identify and understand the MYB members that play a role in regulating wood formation, we conducted a series of comprehensive analyses using PPGR. The specific operational process is outlined below.
1. Obtain MYB members involved in regulating the wood formation
Leveraging the “Transcript Factor” module, we first identified 386 MYB family members in Populus alba x Populus glandulosa 84K. We can choose MYB transcription factors that we are interested in or we can choose all members of the MYB family for further analysis.

To examine the gene expression levels of the TFs of interest in the stem, we selected a transcriptome project in the "Transcriptome" module with the tissue specified as "Stems". We downloaded the gene expression profiles of the TFs and filtered out some highly expressed genes as candidate genes.
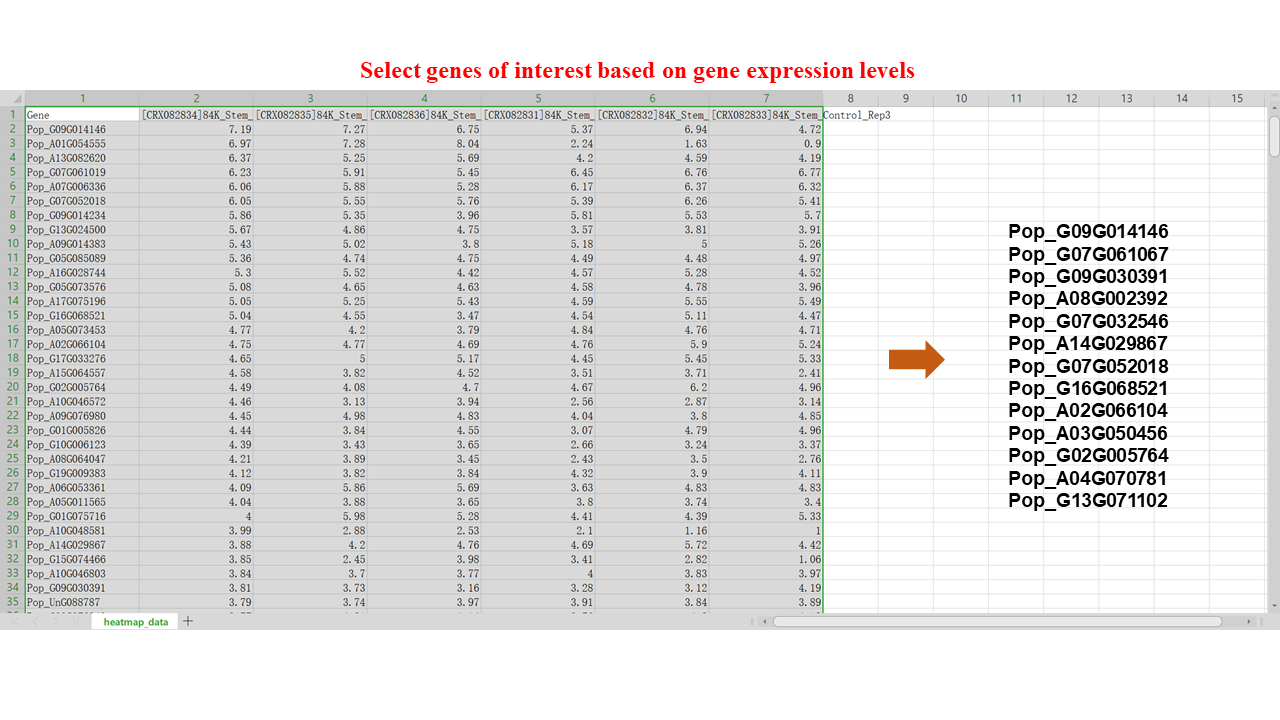
By utilizing the "Quick Search" feature, we conducted a search for each candidate gene of interest to retrieve detailed information, including structural domains, gene function, and gene family. These pieces of information enable us to gain insights into each gene and guide us in selecting which genes to further analyze.
2. Then PopMYB4 (Pop_A04G070781) was further selected for subsequent analyses.
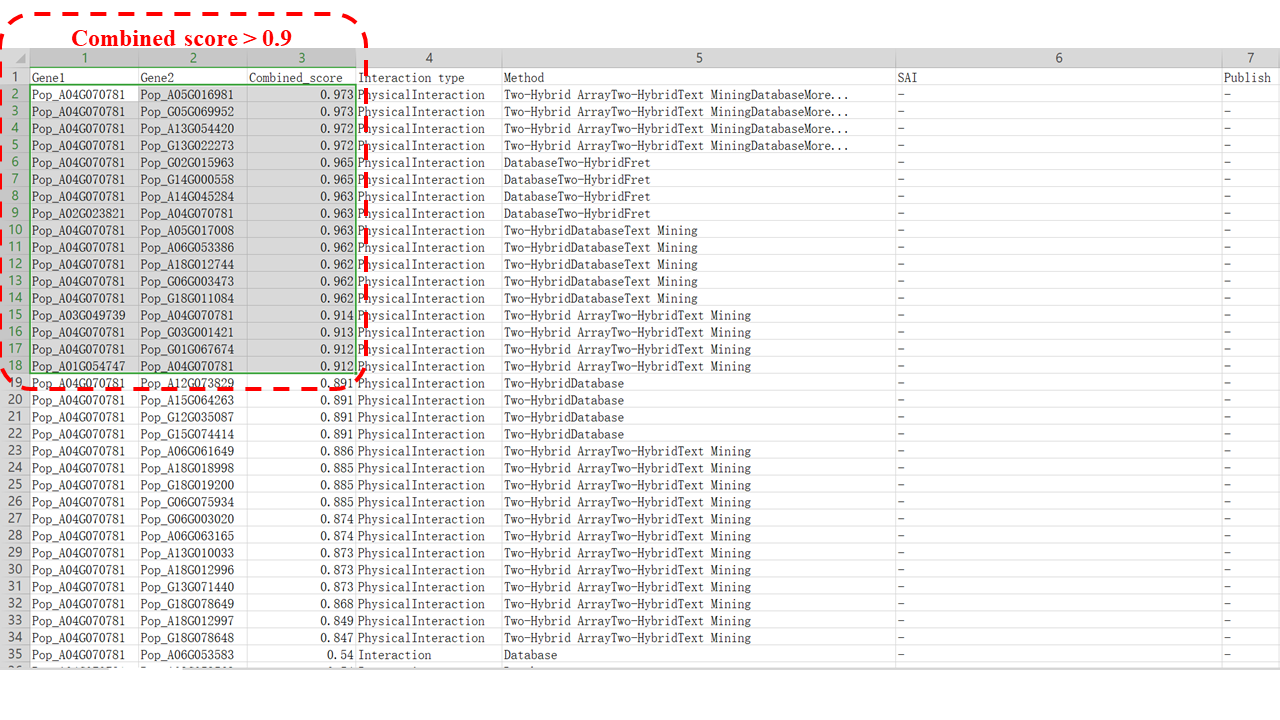
3. Select and annotate the PPI of interest (e.g. combined score > 0.9).
The "Network" module provides crucial information for further gene research. Among the 17 interacting proteins (e.g. combined score > 0.9) of PopMYB4, half of them are annotated as transcriptional corepressors, indicating their potential roles in negative transcriptional regulation.
4. Annotate the target gene of PopMYB4. (Disease Resistance Genes, HT Genes, et al.).
In order to study the function of PopMYB4 more deeply and construct its transcriptional regulatory pathway, we downloaded the TTI data of PopMYB4 and annotated its target genes using various methods (GO enrichment, KEGG enrichment, disease resistance analysis, etc.).

e.g. Disease resistance analysis: The annotation of 25 disease resistance genes suggests a high association between PopMYB4 and disease resistance.
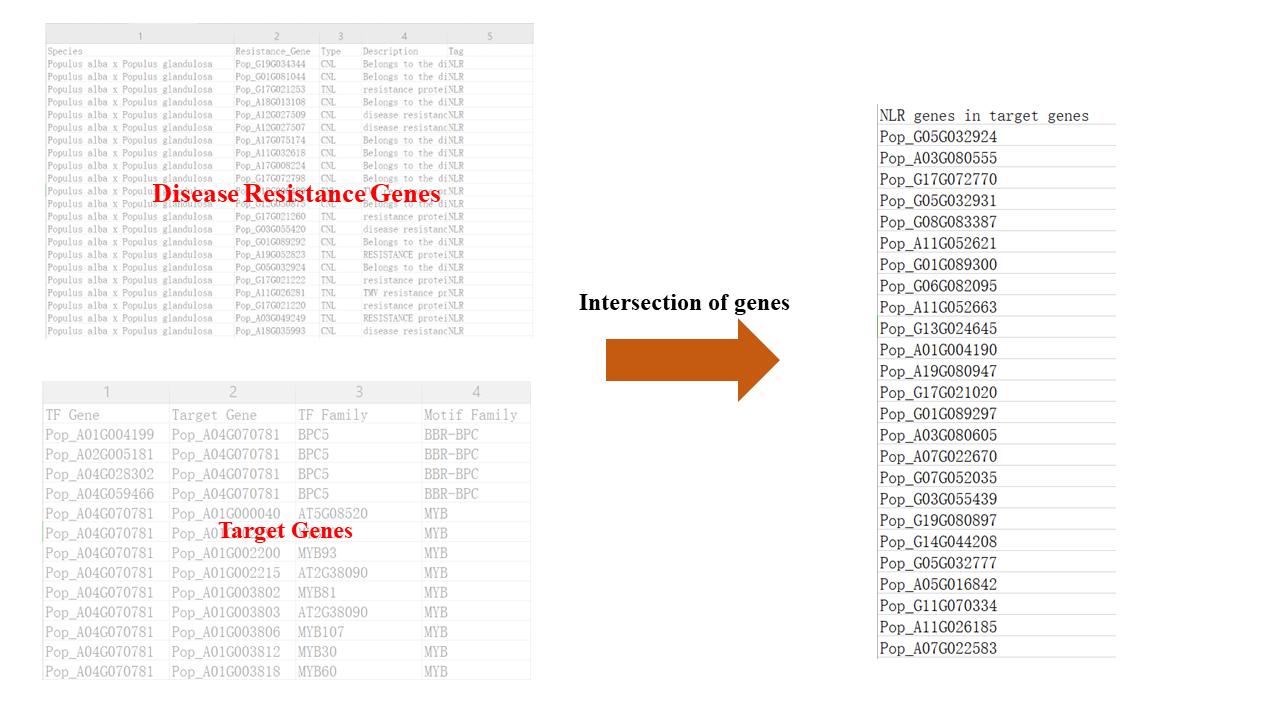
5. Generate and download TTI network images.
We can utilize the "Search Interaction and Regulation" tool to generate a TTI network image depicting the interactions between PopMYB4 and its target disease resistance genes.
Based on the aforementioned steps, we can preliminarily infer two fundamental functions of PopMYB4: transcriptional repression and disease resistance association.