 MHPlotter
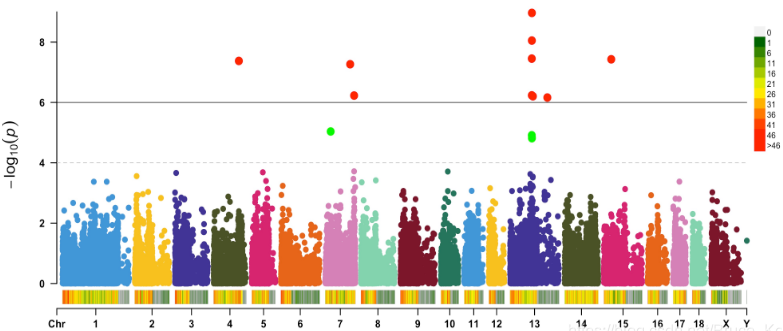
It is common to summarize GWAS results with a Manhattan plot of all P-values. In a Manhattan plot,
the P-values from the entire GWAS are plotted in genomic order by chromosomal position on the x-axis
and by P -value on the y-axis. The value on the y-axis represents the − log10 of the P-value.