Home
Category
Visualization
BarBoxComutationDotForestHeatmapHistogramLollipopMafsummaryMaftitvManhattanOncoprintPM-AdiversityPM-comp-corPM-comp-funcPM-comp-taxaPM-DistributionPM-HclusterPM-HeatmapPM-Marker-CorrPM-Marker-RFscorePM-Marker-TestPM-NetworkPM-PcaPM-PcoaPM-plot-taxaQ-QSurvivalUpsetVenn
Sequence alignment
BLASTDotmatcherDotpathDottupNeedlePM-BdiversityPM-extract-rnaPM-parallel-metaPolydotWater
RNA Expression
Bulk RNA-seq Data AnalysisCancer Alternative Splicing AnalysisCCLHunterCIRI-deepCIRI3Cross-disease analysisDisease predictionEditing site annotationEditing site identificationEditingFactorDetectorFunGenGene-disease network constructionNCSelPredRNA-seq AnalysisSingle-cell RNA-seq Data AnalysisSPIRALTIVar diffTIVar predictVisualization of scRNA-seq Data Analysis Results
Variome analysis
BarcodeBLASTBarcodeFindereasyGWASExpPatternGeneFinderHaplotype analysisHapMapHapSnapLeadSNPFinderRice Varieties IdentificationRice Yield EstimationSeqFetchVersionMapWheat Head Estimation
Epigenome analysis
Age PredictorBS-RNAComparative analysis in nucleosomesDMR AnnotationDMR ToolkitEnrichment & AnnotationEnrichment analysis in nucleosome occupancyEWAS Network VisualizationGMQNIDMPLollipop PlotterMRAS
Long non-coding RNA
ClassificationFunctional PredictionID conversionLGClncbook-BLASTLncBot
Virus
COVID-19 genome variation annotationCOVID-19 haplotype analysisDenovo AssemblyEvolutionary treeFastq-to-VariantsGenealogy and Evolutionary AnalysisGenome AnnotationGenome TracingMcANMonkeypox virus genome variation annotationMonkeypox virus genome variation identificationPangolin COVID-19 Lineage AssignerSeqQCVENASVISTA
Single-cell omics
BroCOLICell Type ComparatorCell Type PredictorFGOTGOTSCSESSpaMITACOSUCASpatial
Image Processing
Image CroppingImage DenoisingImage FlippingImage PartitioningImage Resizing
Others
APAcatcherComposition analysisCross-model analysisCross-species analysisCross-stages analysisHomolog FinderLUTLSRSMIAncRNA-eQTLPM-predict-func
User Manual
Visualization
BarBoxComutationDotForestHeatmapHistogramLollipopMafsummaryMaftitvManhattanOncoprintPM-AdiversityPM-comp-corPM-comp-funcPM-comp-taxaPM-DistributionPM-HclusterPM-HeatmapPM-Marker-CorrPM-Marker-RFscorePM-Marker-TestPM-NetworkPM-PcaPM-PcoaPM-plot-taxaQ-QSurvivalUpsetVenn
Program
Manhattan
Manhattan

Data

All SNPs
Example file
Chromosome names
Example file
Highlighted SNPs
Example file

Parameters

npg
Nature Publishing Group
American Association for the Advancement of Science
The New England Journal of Medicine
Lancet Oncology
The Journal of the American Medical Association
Journal of Clinical Oncology
UCSC Genome Browser
D3.js
LocusZoom
Integrative Genomics Viewer
University of Chicago
Star Trek
Tron Legacy
TV show Futurama
TV show Rick and Morty
TV show The Simpsons
true
True
False
false
True
False
References
Turner, (2018). qqman: an R package for visualizing GWAS results using Q-Q and manhattan plots. Journal of Open Source Software, 3(25), 731, https://doi.org/10.21105/joss.00731.
Instructions

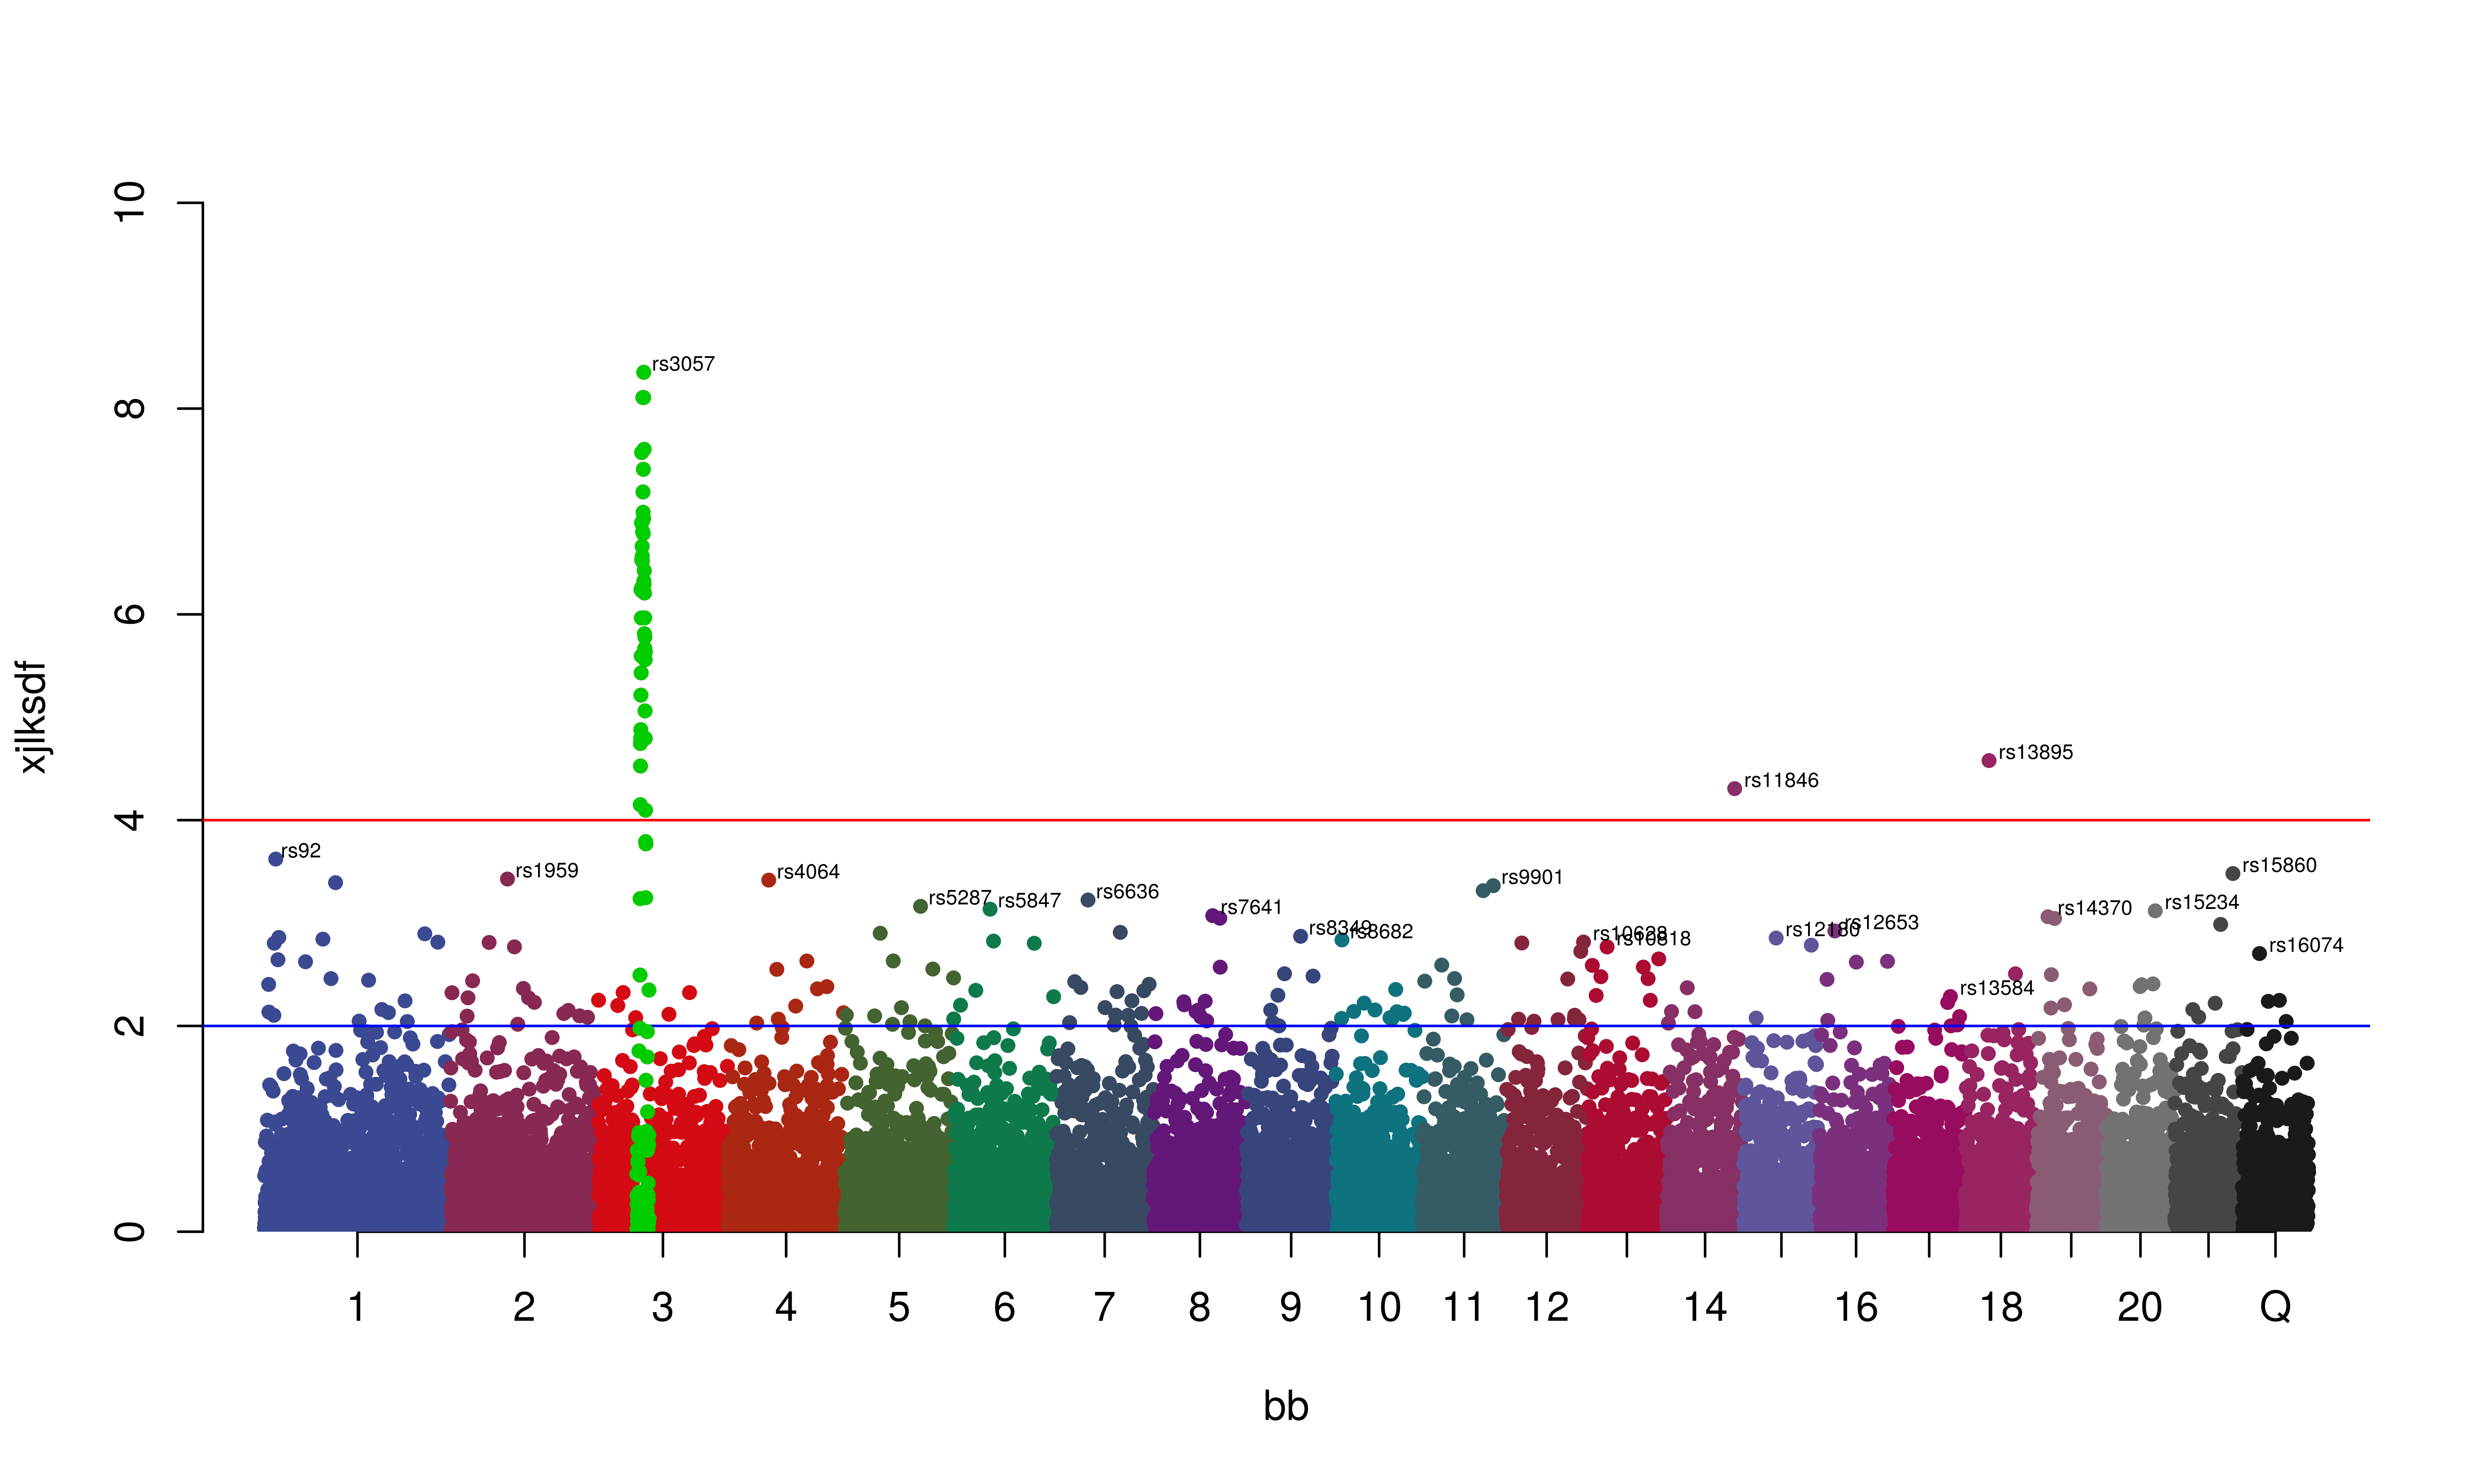
This program produces a manhattan plot given a snp file and other settings.

A Manhattan plot is used to display data with a large number of data-points, many of non-zero amplitude, and with a distribution of higher-magnitude values. The plot is commonly used in genome-wide association studies (GWAS) to display significant SNPs.

Contributor(s)
Xinchang Zheng
zhengxinchang@big.ac.cn
#Runs
808
Open Result