MethBank, a comprehensive database of DNA single-base resolution methylation profiles across a variety
of species, not only integrates 1363 whole genome single-base methylome for 23 species, covering 208
tissues/cell lines and 15 biological contexts, but also provides manually curate knowledge of both
featured differentially methylated genes (DMGs) across 11 kinds of biological contexts like disease and
methylation tools collection. Besides, MethBank also provides analysis tools including Age Predictor,
IDMP and DMR toolkit to help related research of biologists.
1. Data Collection
High quality raw sequencing data of WGBS samples are acquired from accessible data repositories
(SRA/GSA).
The data included in the database were searched according to the following filtering rules:
(1) The status of data resource is open-access
(2) [DataSet Type] = "methylation profiling by high throughput sequencing"
(3) [All Fields] = "WGBS" or "BS-Seq" or "Whole Genome Bisulfite Sequencing"
(4) The predicted sequencing depth of WGBS sample should be greater than 10.
Knowledge is curated from publications retrieved in PubMed.
For Featured DMGs, publication search followed the following rules:
(1) The keyword matching "WGBS", "whole-genome bisulfite sequencing", "RRBS"
and "whole-genome DNA methylation"
(2) Publicated in the past twelve years (2010-present)
(3) Publications associated with featured DMGs.
The data after the initial screening are manually curated again.
2. Data Analysis
WGBS data analysis pipeline includes quality control, trim adapters and low quality bases, align to
reference genome, extract CpG methylation, quantify Gene/CpG island average methylation level,
high methylated CpG islands analysis (genomic location enrichment, GO & KEGG enrichment), genes
related to methylated CpG islands analysis, differentially methylated regions (DMRs) analysis
(genomic location enrichment, GO & KEGG enrichment).
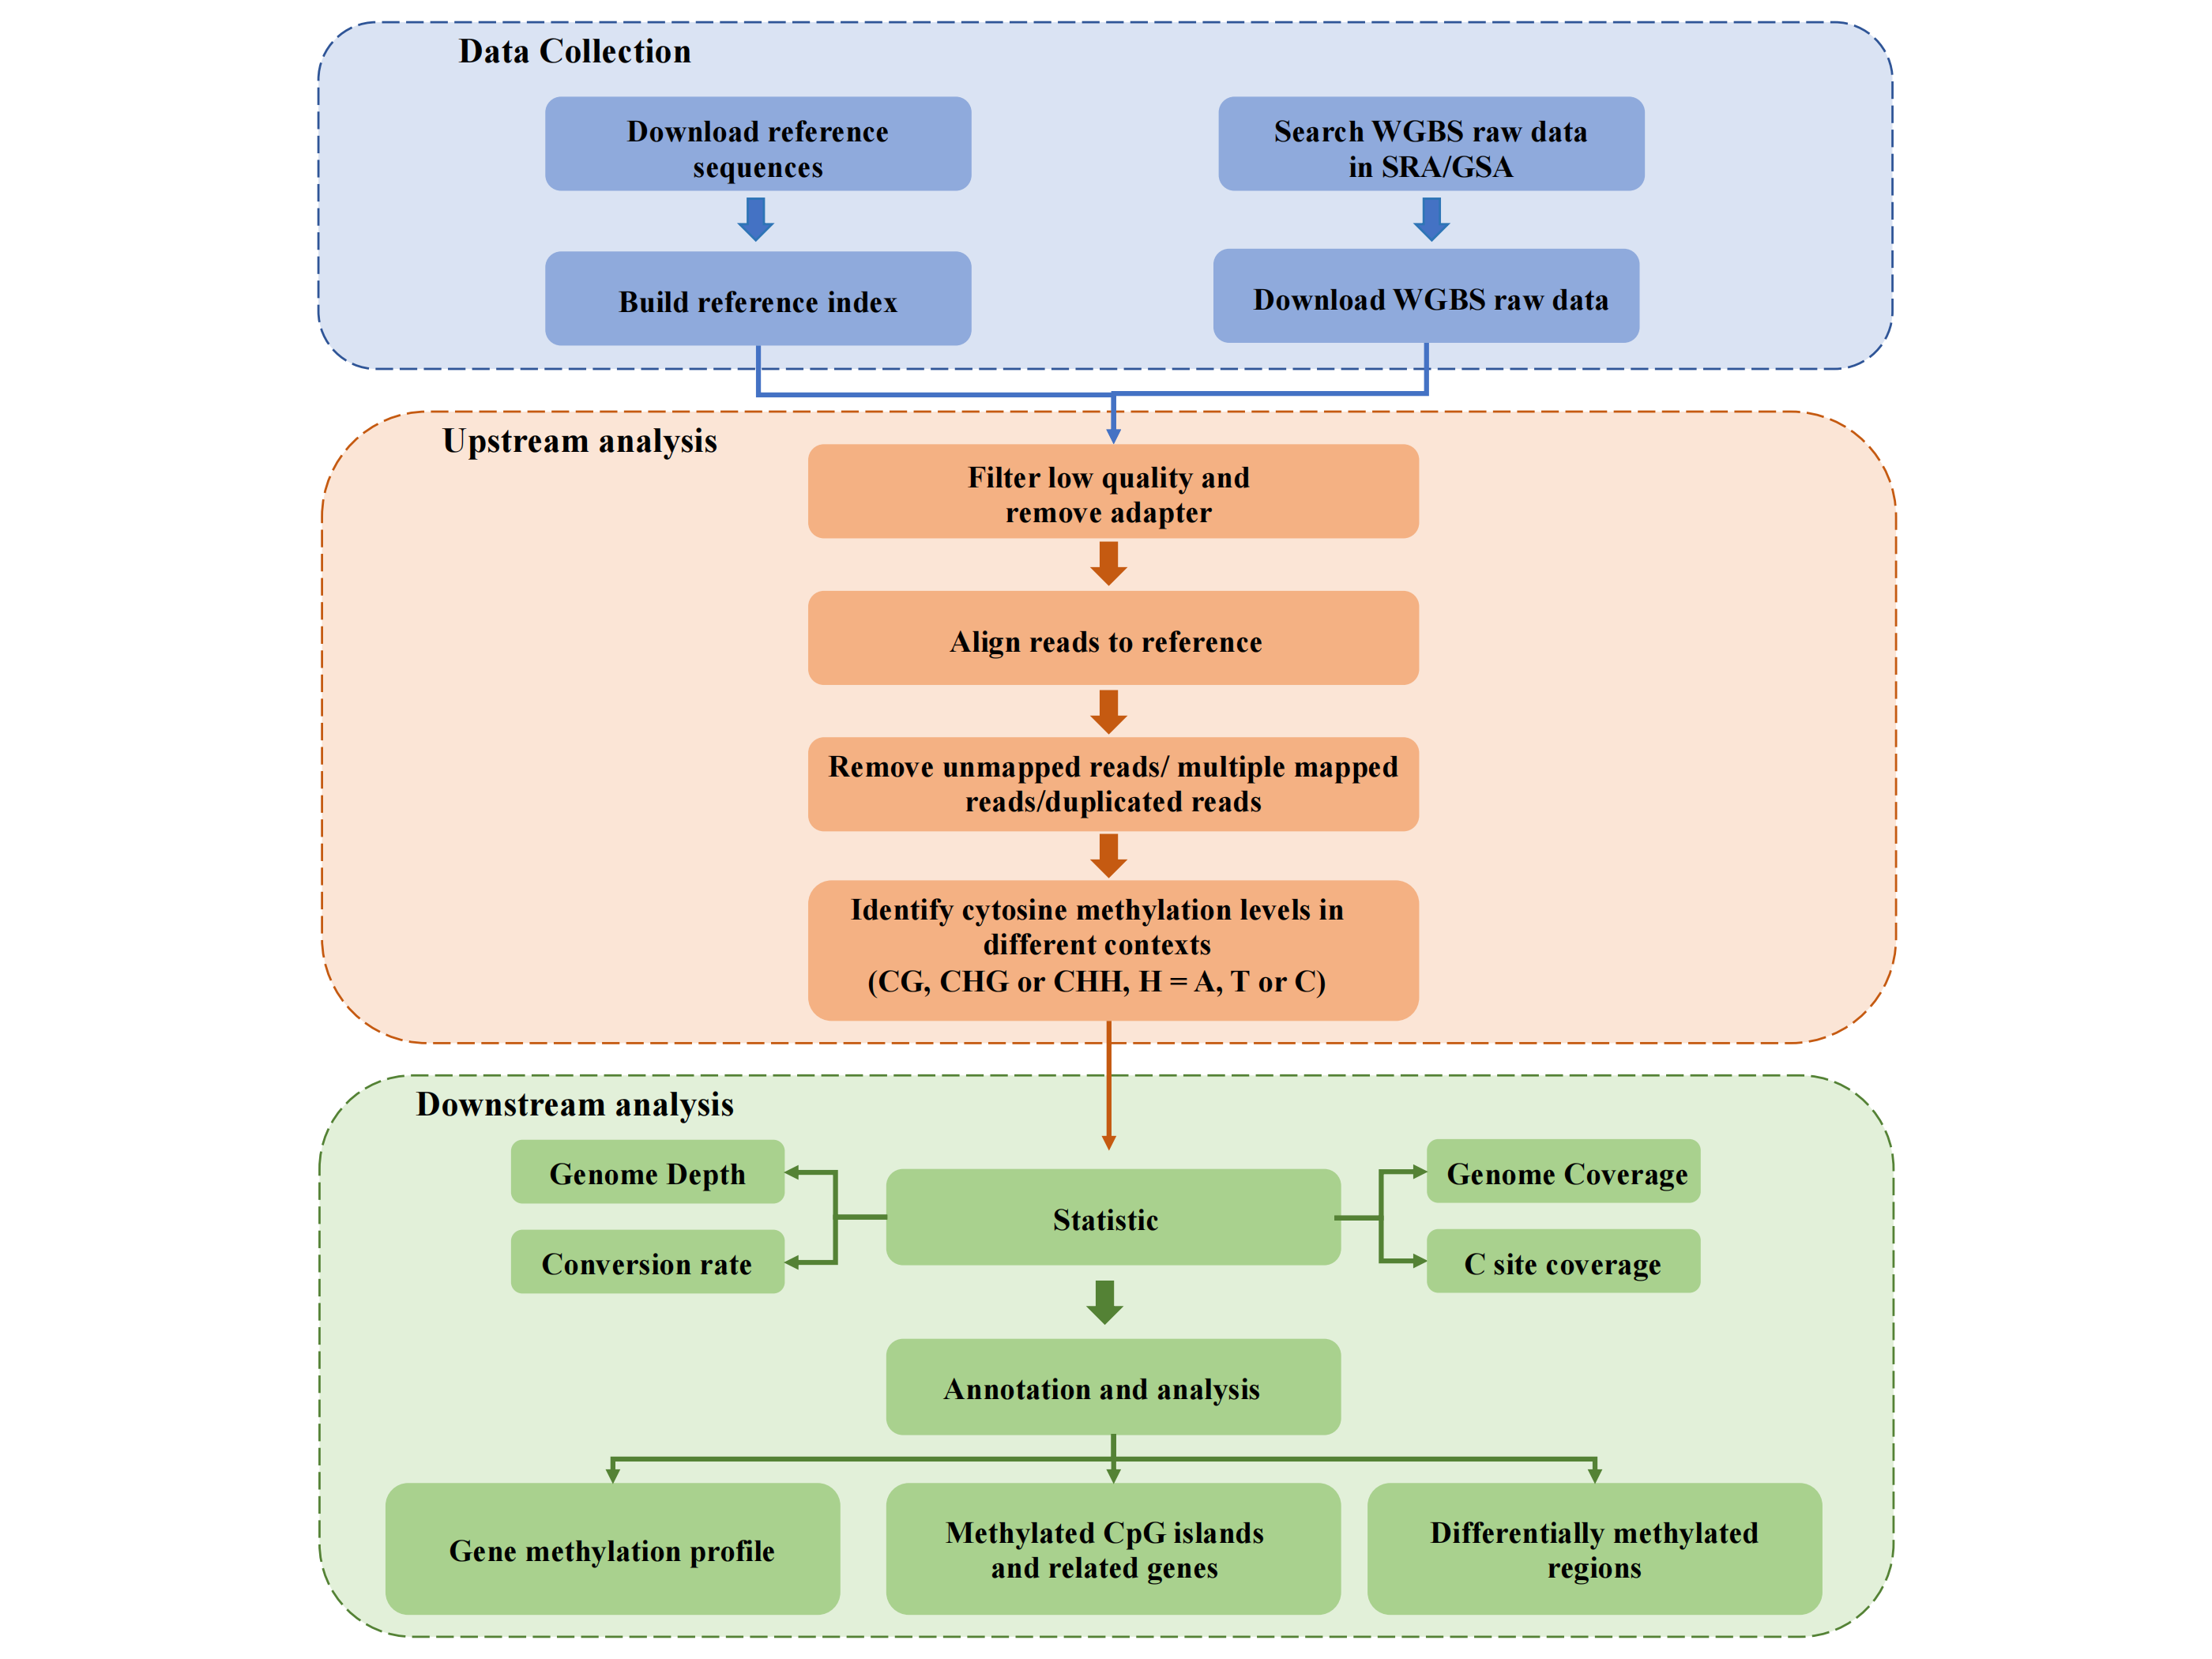 |
First, all bisulfite sequence were subjected to quality control by FastQC v0.11.7 and trimmed to
remove adaptors and low quality bases using Fastq-dump (sratoolkit.2.8.2-1). Next, the reads that
passed quality control were mapped to the reference genome of the corresponding species using
Bismark-0.22.3. Detailed species reference genome information is shown in the table below. We used the
Bismark methylation extractor to extract methylation data from
aligned, filtered reads. To visualize the quality of the data, we computed 6 indicators: Mapping
rate, Unique mapping rate, Genome coverage, C coverage, Conversion rate and Depth. The corresponding
calculations are shown below.
| Species |
Genome Version for Mapping |
Genome Version for Annotation |
| Ailuropoda melanoleuca |
ASM200744v2 |
ASM200744v2 |
| Arabidopsis_thaliana |
TAIR10.1 |
TAIR10.1 |
| Bos taurus |
ARS-UCD1.2.105 |
ARS-UCD1.2.105 |
| Brassica napus |
GCF_000686985.2_Bra_napus_v2.0 |
GCF_000686985.2_Bra_napus_v2.0 |
| Canis lupus familiaris |
CanFam3.1.104 |
CanFam3.1.104 |
| Danio rerio |
Zv9 |
Zv9 |
| Macaca fascicularis |
Macaca_fascicularis_5.0 |
Macaca_fascicularis_5.0.102 |
| Gallus gallus |
GRCg6a |
GRCg6a.105 |
| Glycine max |
Gmax_275_v2.0 |
Gmax_275_v2.0 |
| Gorilla gorilla |
gorGor4 |
gorGor4.105 |
| Homo sapiens |
GRCh38.101 |
GRCh38.101 |
| Manihot esculenta |
Mesculenta_305_v6 |
Mesculenta_305_v6 |
| Macaca mulatta |
Mmul_10.105 |
Mmul_10.105 |
| Mus musculus |
GRCm38.75 |
GRCm38.75 |
| Oryza sativa |
IRGSP-1.0 |
IRGSP-1.0 |
| Ovis aries |
Oar_v3.1.101 |
Oar_v3.1.101 |
| Pan troglodytes |
Pan_tro_3.0 |
Pan_tro_3.0.105 |
| Phaseolus vulgaris |
Pvulgaris_218_v1 |
Pvulgaris_218_v1 |
| Populus_trichocarpa |
P.trichocarpa_v4.1 |
P.trichocarpa_v4.1 |
| Rattus norvegicus |
Rnor_6.0.101 |
Rnor_6.0.101 |
| Salmo salar |
Ssal_v3.1 |
Ssal_v3.1 |
| Solanum lycopersicum |
GCF_000188115.3_SL2.50 |
GCF_000188115.3_SL2.50 |
| Sus scrofa |
Sscrofa11.1 |
Sscrofa11.1.105 |
| Xenopus laevis |
xenlae2 |
xenlae2 |
| Zea mays |
GCF_902167145.1_Zm-B73-REFERENCE-NAM-5.0 |
GCF_902167145.1_Zm-B73-REFERENCE-NAM-5.0 |
Mapping Rate: calculated from the *_PE_report.txt file generated by
Bismark
(Sequence pairs did not map uniquely + Number of paired/Single-end alignments with a
unique best hit) / Sequence pairs analysed in total
Unique Mapping Rate: calculated from the *_PE_report.txt file
generated by Bismark
Number of paired/Single-end alignments with a unique best hit / Sequence pairs
analysed in total
Depth: calculated by Samtools1.9 using sort module
Conversion Rate: calculated from the *.bismark.cov file generated
by Bismark
Genome Coverage: all base size number of sample / all size number of
genome reference
C Coverage: C base size number of sample / C base size number of
genome reference
Then, bedtools v2.17.0 and python3 were used to analyze gene methylation profiles of promoter, body and
downstream regions in the C/CG/CH context. Subsequently, the relationship between CpG island and gene
were studied. From the perspective of CpG island, we calculated the DNA methylation level corresponding
to CpG island, and selected highly methylated CpG island (average methylation level >= 0.6) as the
research object for downstream analysis including genome enrichment, GO & KEGG enrichment. From the
perspective of genes, we provide all CpG islands that overlapped with genes and counted the
corresponding location information.
Finally, we identify the differential methylation regions (DMRs) by using DSS R-package for the typical
biological contexts in single project, and analyze genomic location enrichment, GO & KEGG enrichment.
3. Meta Curation
The manual curation of metadata are done on 2 levels ('Project' and
Sample'). The corresponding review contents and standards are as follows:
Curation
model on the
'Project' level
| Items |
Description |
Value
|
| Data Resource |
Controlled vocabulary |
NGDC, NCBI |
| Project ID |
Accession number of the project from data resource |
CRA, GSE, HRA, SRP |
| Sample Number |
Number of samples included in the project of MethBank |
1, 2, 3…… |
| BioProject ID |
Accession number of the BioProject from data resource |
PRJCA, PRJNA |
| Title |
Title of each project from data resource |
Conclusion term |
| Summary |
A summary description of the project |
Conclusion term |
| Overall Design |
Experiment design of the project |
Conclusion term |
| Related Biological Process |
Controlled vocabulary |
Age, Health, Disease etc |
| Species |
Controlled vocabulary |
Homo sapiens, Mus musculus, Brassica napus etc |
| Tissue/Cell Line |
Controlled vocabulary |
Liver, Pancreas, Brain etc |
| Cell Type |
Controlled vocabulary |
HeLa-S3 Cell, K-562 Cell, Hep-G2 Cell etc |
| Healthy Condition |
Controlled vocabulary |
Normal, Healthy, Head and neck squamous cell carcinoma etc |
| Development Stage |
Controlled vocabulary |
Embryo, Gamete, Adult etc |
| Disease State |
Controlled vocabulary |
T2bN0M0, T3bN0M0, T2cN0M0 etc |
| Submitter |
Submitter of the project |
Lab info, Submitter name |
| Year |
Submit year of the project |
Feb 15, 2019 etc |
| Publication |
Publication information related to the project |
Author, article name, journal name, date, doi etc |
| PMID |
Pubmed id of Publication related to the project |
PubMed ID |
| Status |
Public date of the project |
Public on Jul 03, 2013 etc |
| Submission Date |
Submission date of the project in data resource |
Apr 29, 2020 etc |
| Last Update Date |
Last update date of the project in data resource |
Apr 30, 2020 etc |
Curation
model on the
'Sample' level
| Items |
Description |
Value |
| Basic Information |
| Sample Name |
Name of the sample from data resource |
Conclusion term |
| Data Resource |
Controlled vocabulary |
NGDC, NCBI |
| Description |
Description of the sample from data resource |
Conclusion term |
| BioProject ID |
Accession number of the BioProject from data resource |
PRJNA, PRJCA |
| Project ID |
Accession number of the project from data resource |
GSE, SRP, HRA, CRA |
| Experiment ID |
Accession number of the experiment sample in data resource |
SRX, HRX, CRX |
| Status |
Public date of the sample |
Public on Jul 03, 2013 etc |
| Submission Date |
Submission date of the sample in data resource |
Apr 29, 2020 etc |
| Last Update Date |
Last update date of the sample in data resource |
Apr 30, 2020 etc |
| Donor ID |
Donor ID of the sample in data resource |
ENCBS |
| Sample Characteristic |
| Species |
Controlled vocabulary |
Homo sapiens, Mus musculus, Brassica napus etc |
| Tissue/Cell Line |
Controlled vocabulary |
Liver, Pancreas, Brain etc |
| Cell Type |
Controlled vocabulary |
HeLa-S3 Cell, K-562 Cell, Hep-G2 Cell etc |
| Source Name |
Name of the sample group |
Conclusion term |
| Strain |
Controlled vocabulary |
Strain means variants of plants, viruses or bacteria; or an inbred
animal used for experimental purposes
|
| Breed |
Controlled vocabulary |
Breed means a specific group of domestic animals having homogeneous
appearance (phenotype), homogeneous behavior, and/or other
characteristics that distinguish it from other organisms of the same
species.
|
| Cultivar |
Controlled vocabulary |
Cultivar means a type of plant that people have bred for desired
traits, which are reproduced in each new generation by a method such
as grafting, tissue culture, or carefully controlled seed
production.
|
| Sex |
Controlled vocabulary |
Male, Female, Pooled male and female |
| Age |
The age/stage of samples |
1, 2, 3…… days/weeks/years etc |
| Biological Condition |
| Healthy Condition |
Controlled vocabulary |
Normal, Healthy, Head and neck squamous cell carcinoma etc |
| Disease State |
Controlled vocabulary |
T2bN0M0, T3bN0M0, T2cN0M0 etc |
| Development Stage |
Controlled vocabulary |
Embryo, Gamete, Adult etc |
| Genotype |
Controlled vocabulary |
Genotype of the sample means its complete set of genetic material
|
| Treatment |
Brief description of the sample treatment state |
Conclusion term |
| Knockout |
Brief description of the sample knockout state |
Conclusion term |
| Resistance Phynotype |
Brief description of the sample resistance phynotype state |
Conclusion term |
| Protocol |
| Growth Protocol |
Culture protocols of cells from samples or cell lines |
Conclusion term |
| Treatment Protocol |
Protocols of sample treatment |
Conclusion term |
| Extraction Protocol |
Protocols of WGBS extraction |
Conclusion term |
| Construction Protocol |
Protocols of WGBS library construction |
Conclusion term |
| Library Strategy |
Controlled vocabulary |
Bisulfite-Seq |
| Library Source |
Controlled vocabulary |
GENOMIC |
| Library Selection |
Controlled vocabulary |
RANDOM, Other etc |
| Layout |
Controlled vocabulary |
PAIRED, SINGLE |
| Platform |
Controlled vocabulary |
Illumina HiSeq 2500, HiSeq X Ten etc |
| Assessing Quality |
| Mapping Rate |
Calculated data |
(Sequence pairs did not map uniquely + Number of paired/Single-end
alignments with a unique best hit) / Sequence pairs analysed in
total
|
| Uniquely Mapping Rate |
Calculated data |
Number of paired/Single-end alignments with a unique best hit /
Sequence pairs analysed in total
|
| Genome Coverage |
Calculated data |
all base size number of sample / all size number of genome
reference
|
| C Coverage |
Calculated data |
C base size number of sample / C base size number of genome
reference
|
| Conversion Rate |
Calculated data |
Proportion of Cs converted to Ts |
| Depth |
Calculated data |
Total mapped reads number*Average read length/total bases of
reference genome
|
| Analysis |
| Genome Version for Mapping |
Reference genome version |
.fa/.fasta/.fna format file |
| Genome Version for Annotation |
Genome annotation version |
.gff/.gtf/.gff3 format file |
 |
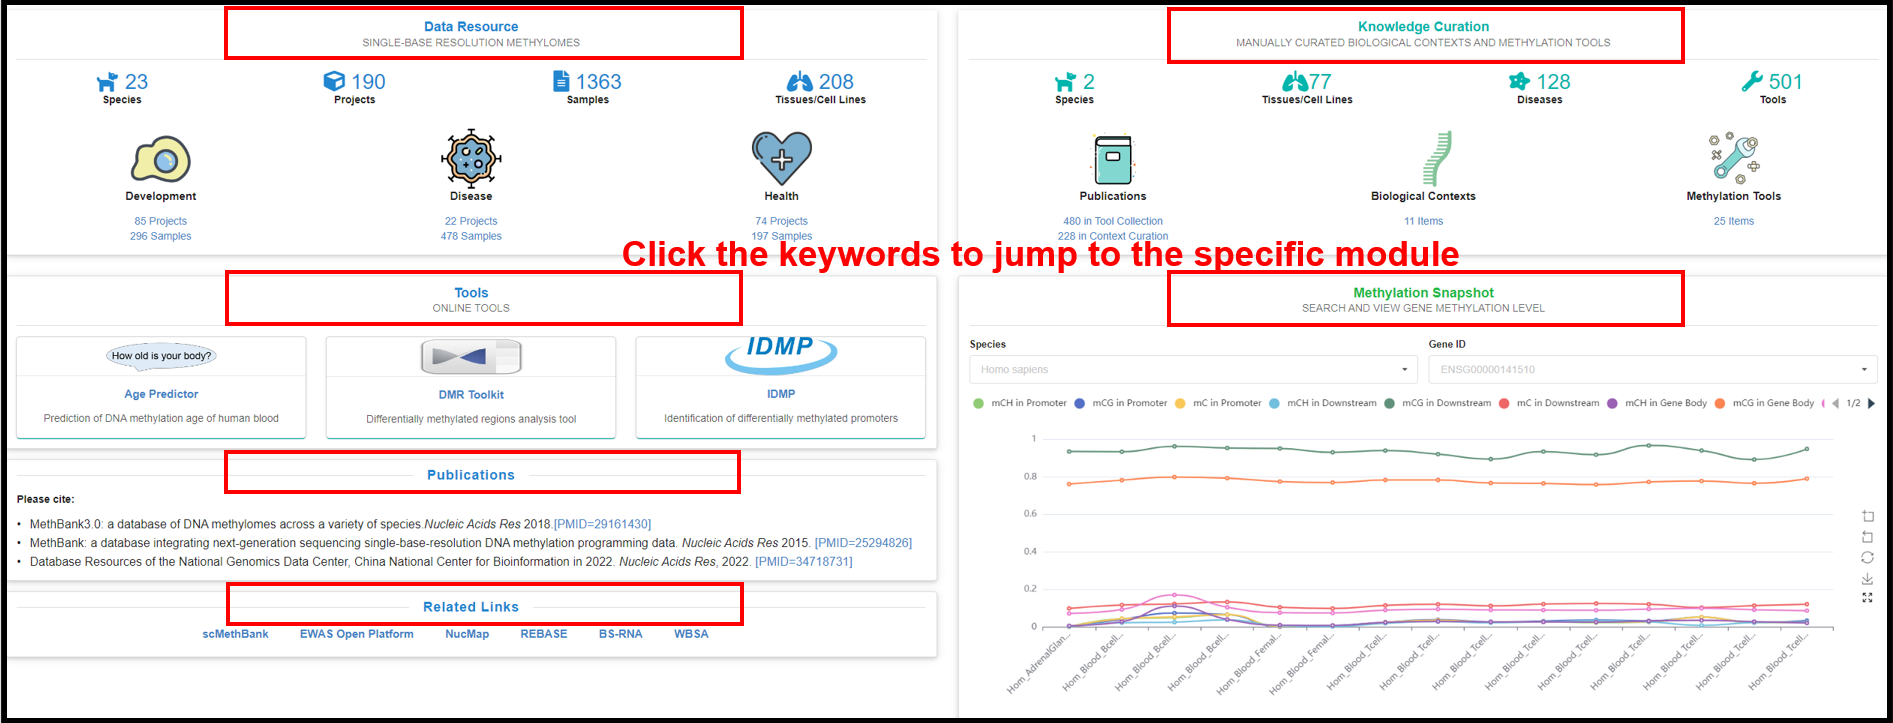
1. Home Page
You can fill in the entry of interest in the input box to search and view the
corresponding data and information that you need.
For example, you can search for a list of projects, samples, publications, and featured DMGs related to
human WGBS data by entering "Homo sapiens" and selecting item.
You can enter a gene name, such as TP53, to obtain the specific information of the gene in multiple
species and its related publications and featured DMGs at the WGBS level.
 |
You can also directly click the specific areas in the four sections
of "Data Resource", "Knowledge Curations", "Tools" and "Methylation Snapshots" below to jump to the
overall page of the corresponding section.
 |
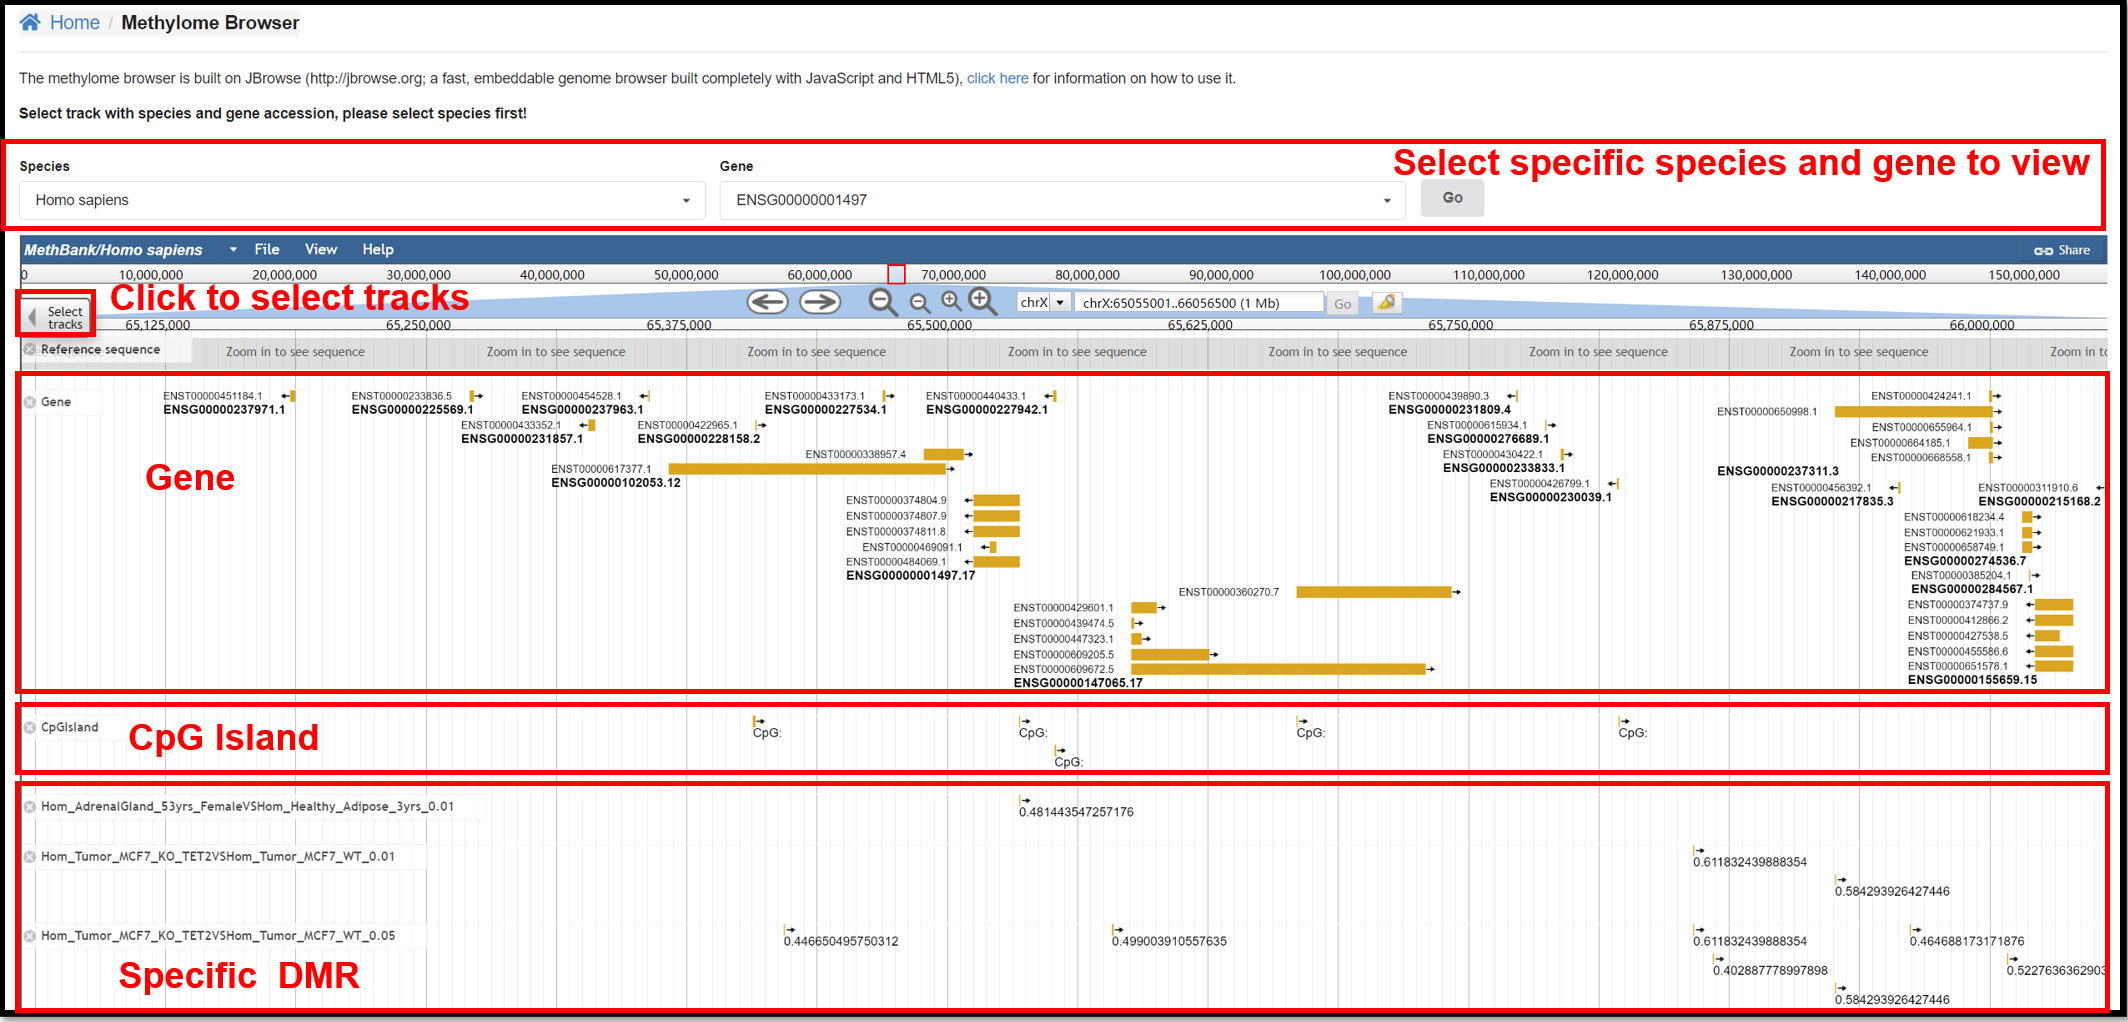
2. Methylome Browser Page
You can view the reference genome sequence, gene annotation, and distribution
of CpG islands for specific species and specific genes on the Methylome Browser. You can also explore
the differentially methylated regions in specific experiments in the select Track.
 |
3. Data Resources
3.1 Projects Page
On the "Projects" page, you can click "Display column" to customize the
columns of displayed information of projects in the table. On the left side of the page, you can click
on “Species”, “Animal Tissue” and “Human Disease”, not only to view the distribution of the internal
tree structure, but also to further jump to the table of contents of Projects under a specific category.
All forms in the MethBank can be downloaded.
 |
3.2 Samples Page
On the "Samples" page, you can click “Show Columns” and options under “Show
Columns” to customize the displayed sample information and filter samples with specific criteria, as
shown in the following figure below. A detailed explanation of Quality Assessment can be found in
https://ngdc.cncb.ac.cn/methbank/faq#curation
 |
 |
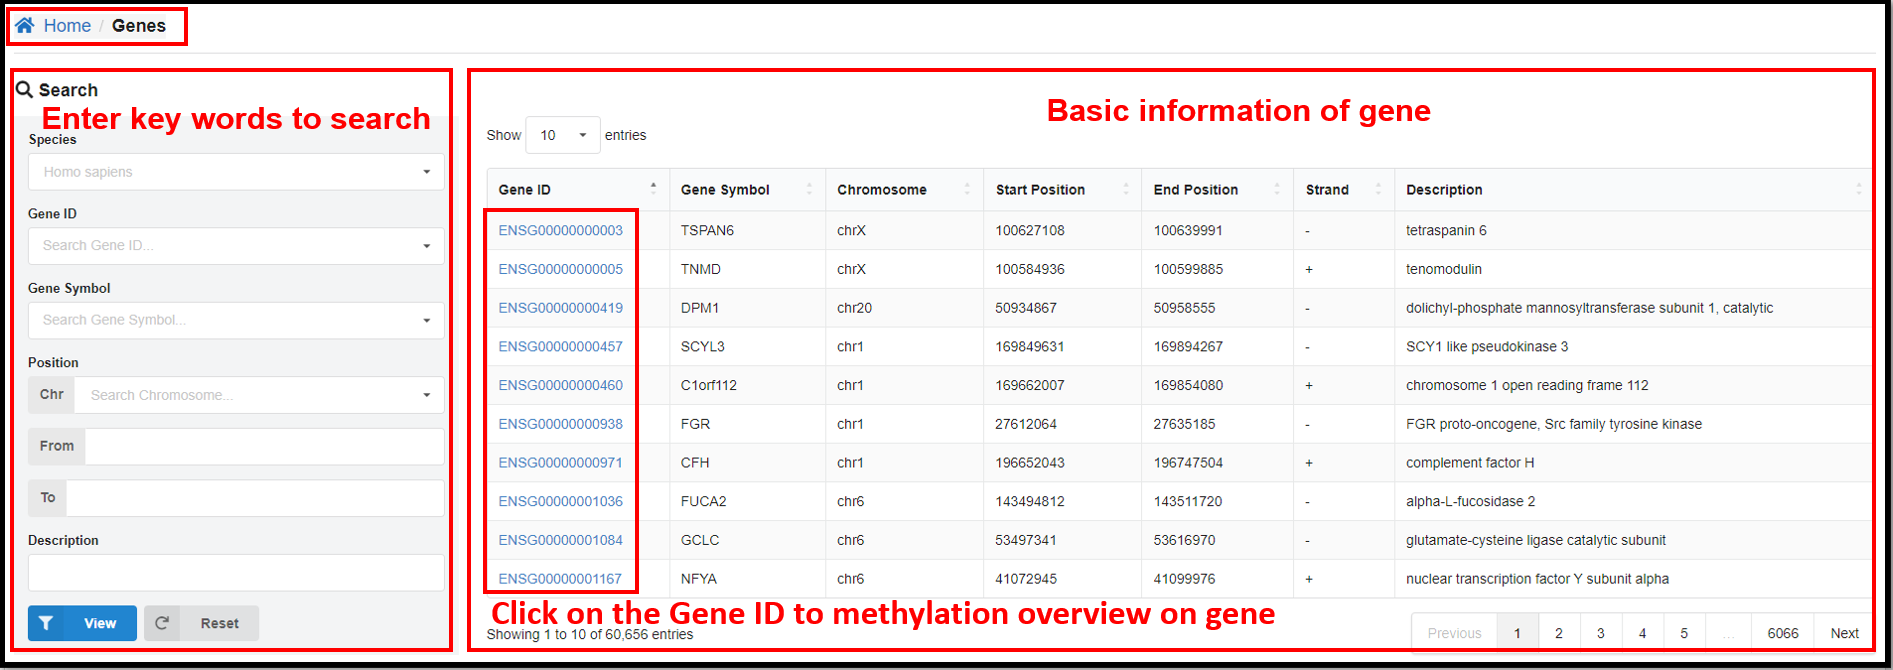
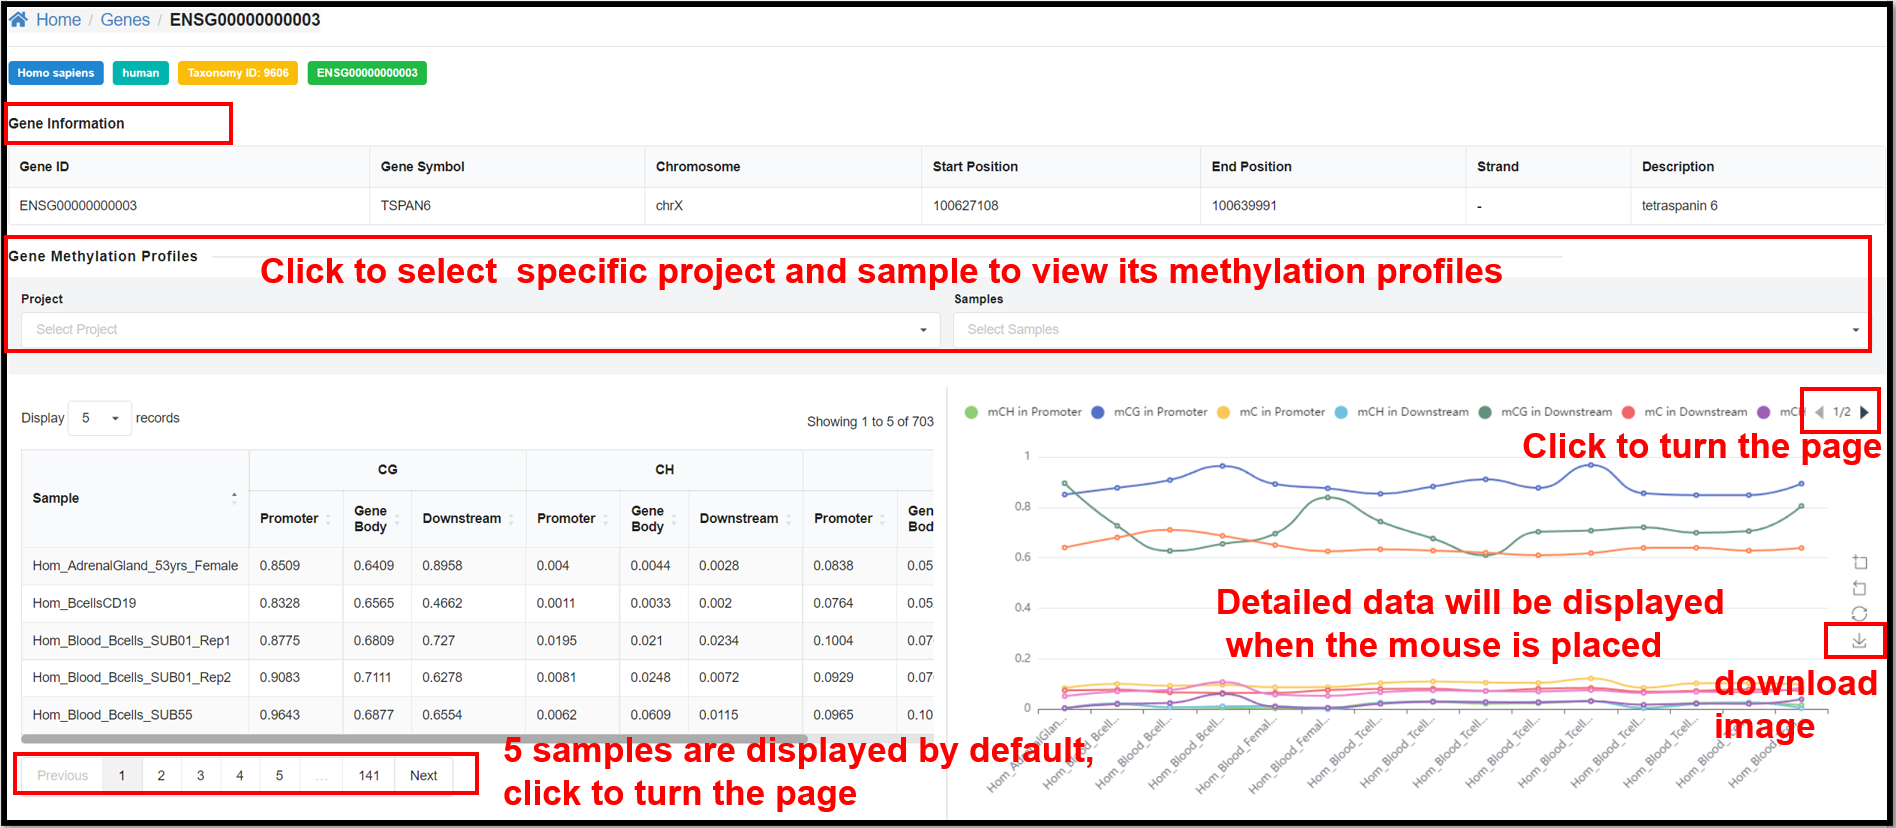
3.3 Genes Page
On the "Genes" page, clicking define gene ID hyperlinks will jump to the page
of methylation overview on gene. Take human gene ENSG00000000003 for example, you can not only see the
relevant information of this gene, but also the table and line graph of the methylation profiles of CG
and CH (H= A, T or C) of this gene in specific samples.
 |
 |
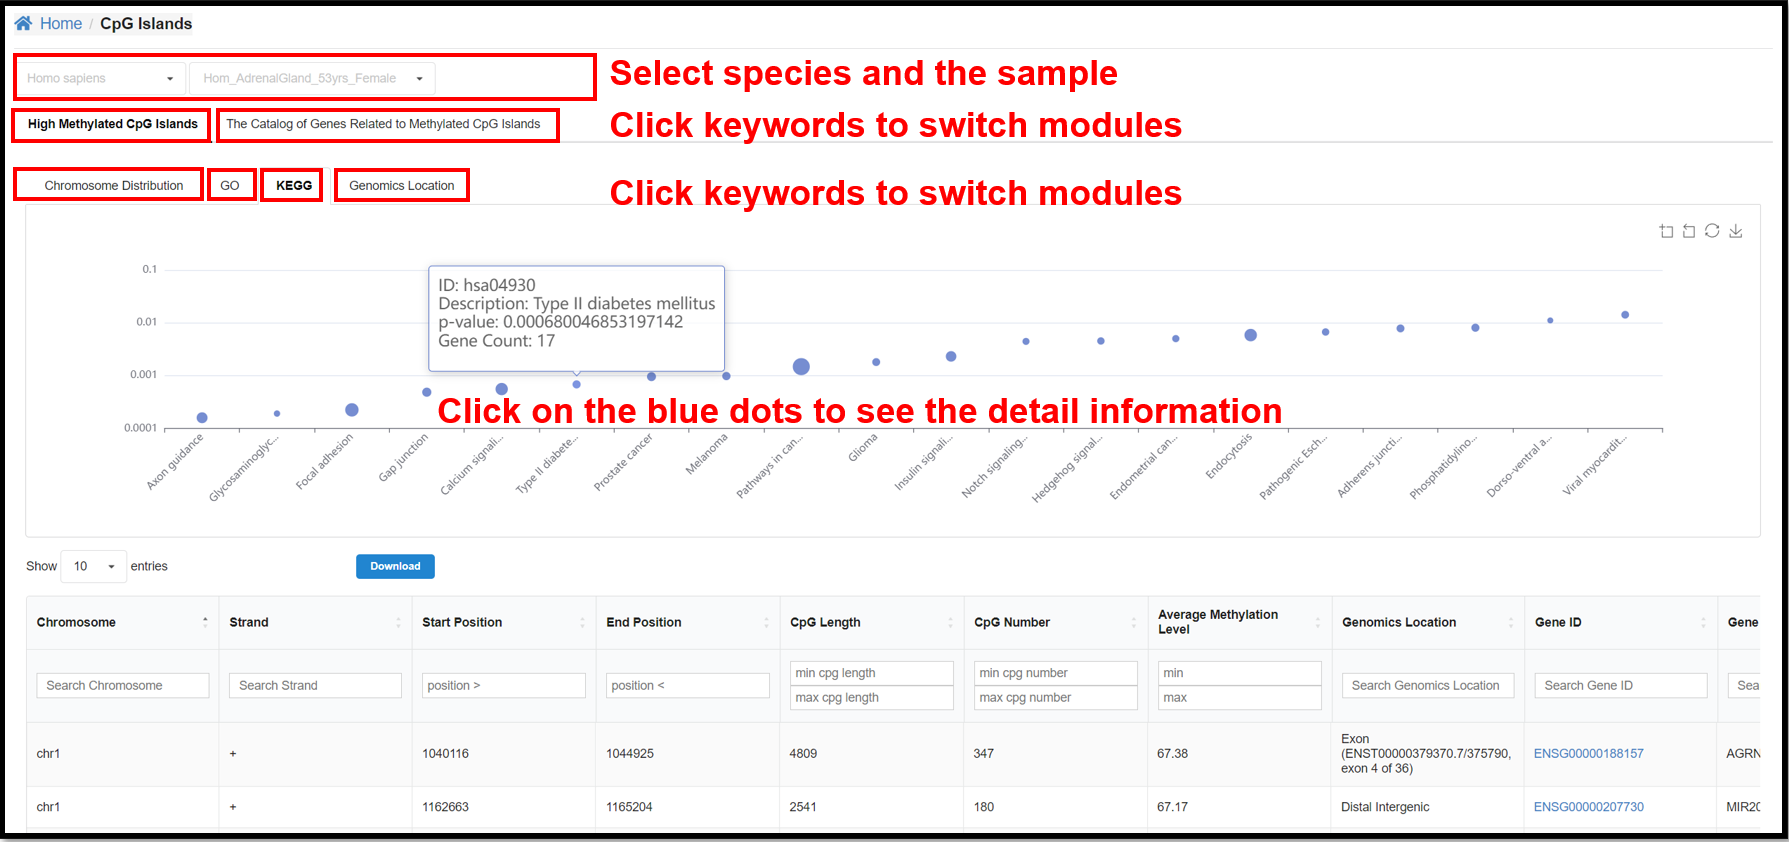
3.4 CpG Islands Page
You can select a specific species and a specific sample to view the results
of chromosome distribution, GO, KEGG and Genomics Location of high methylated CpG islands and the result
of the catalog of genes related to methylated CpG islands for the corresponding sample.
 |
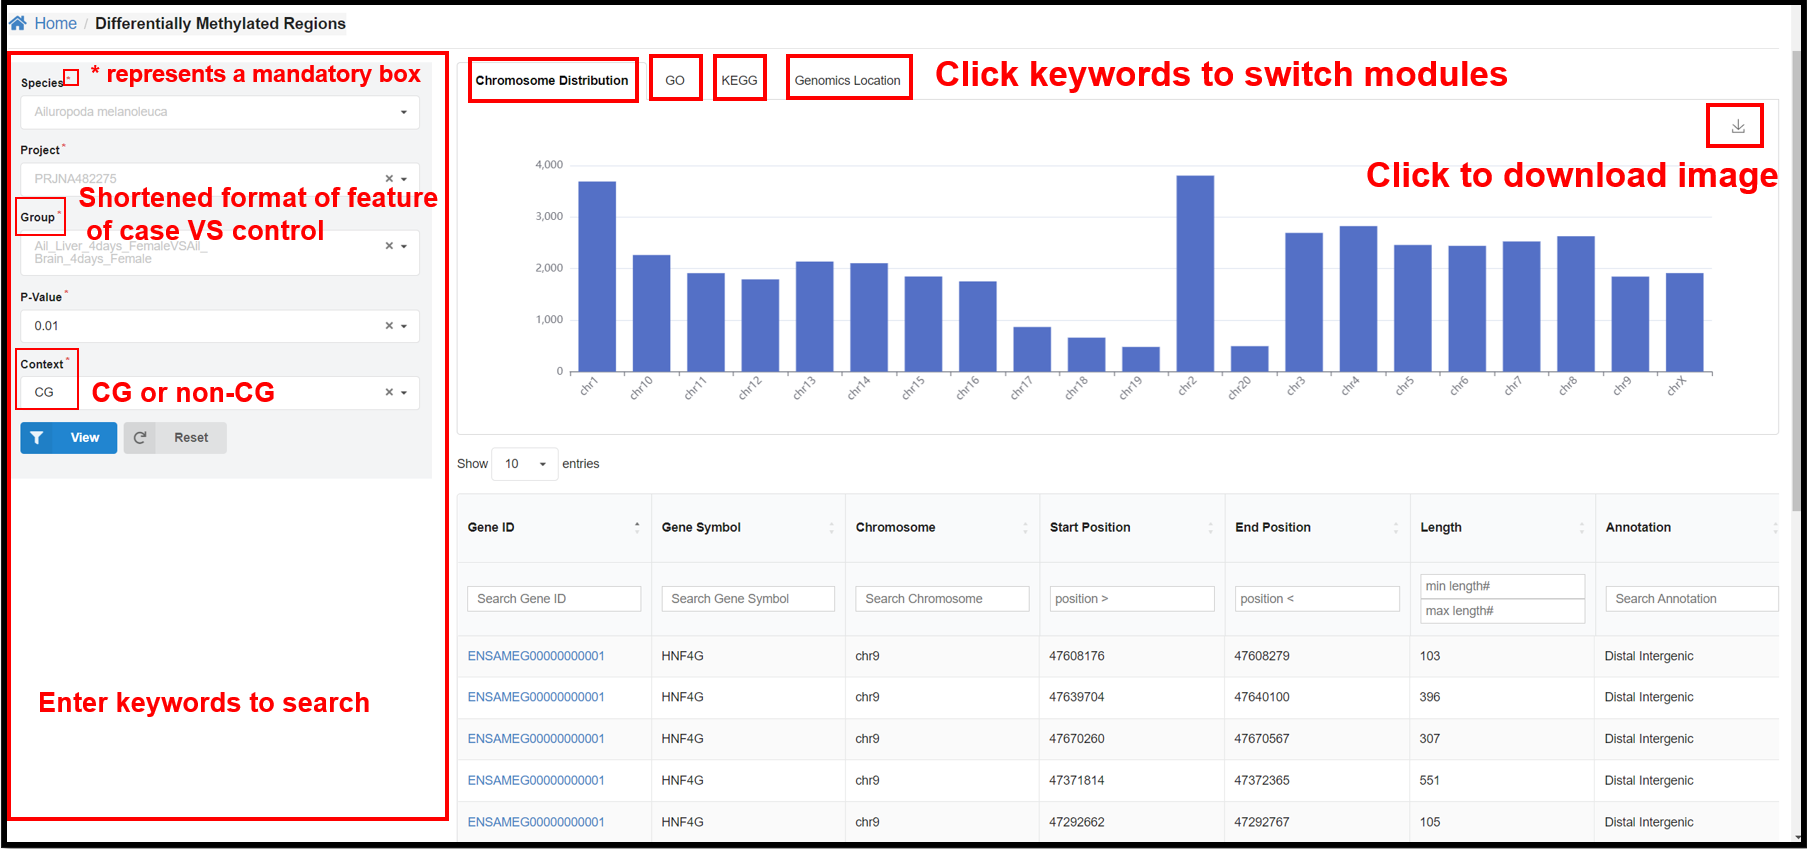
3.5 DMRs Page
You can select a specific species, project, group, and P-value and length on
the left panel to view the corresponding DMR distribution on chromosome, GO&KEGG enrichment, genomics
location results.
 |
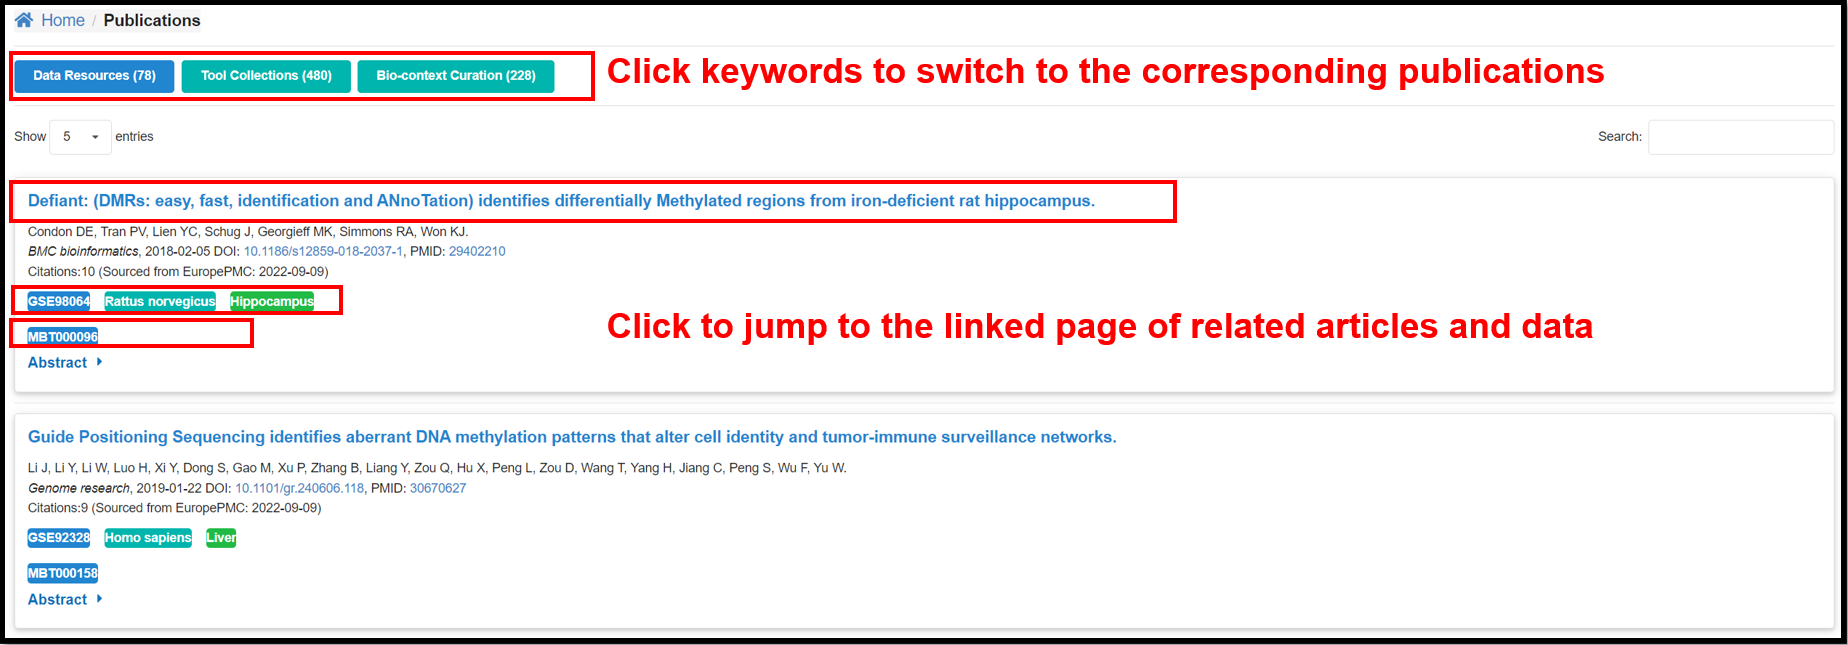
3.6 Publications Page
The page contains the information on the corresponding publications in Data
resource, Tool Collections and Featured DMGs modules.
 |
4 Knowledge
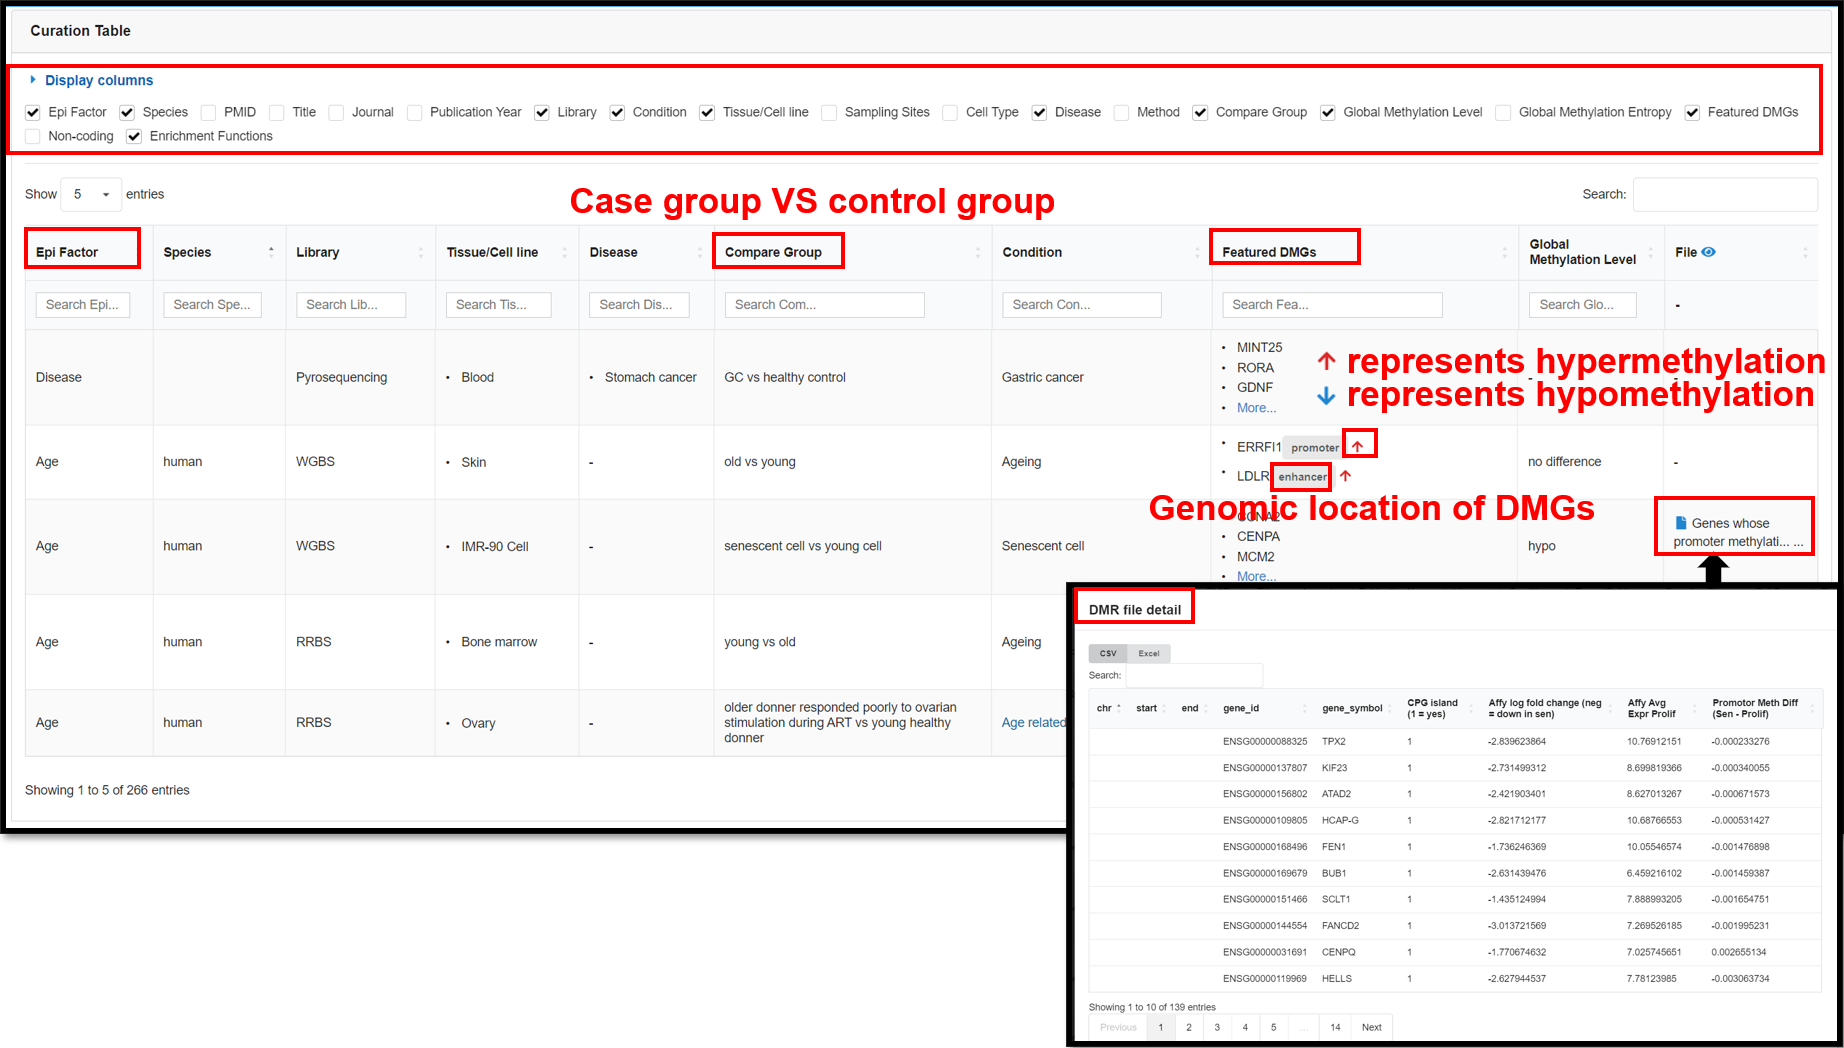
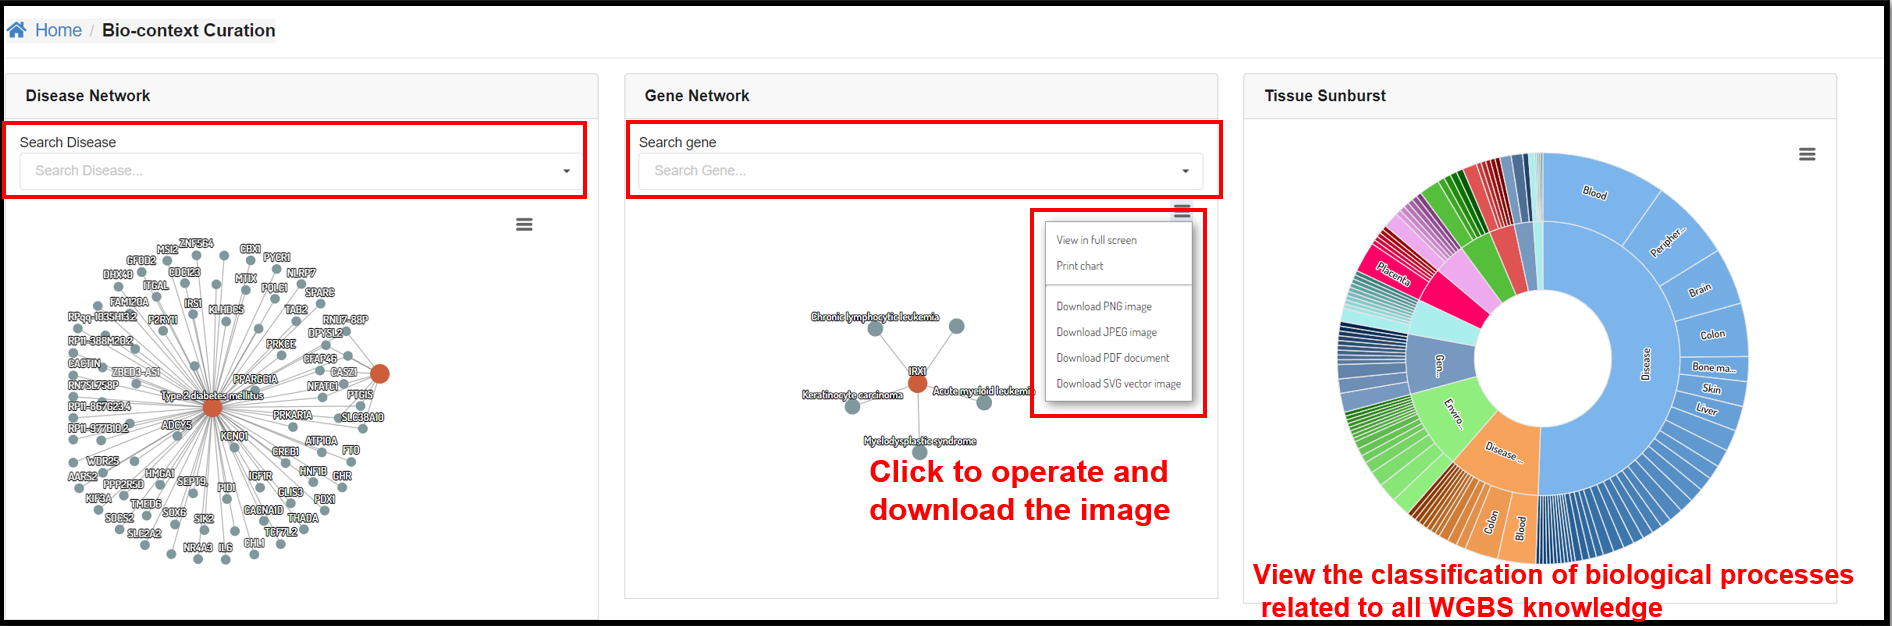
4.1 Featured DMGs Page
The Featured DMGs module summarized biological context-associated featured DMGs via full-scale manual
curation to raise the potential availability of retrieving epigenetic marker genes and shared properties for
kinds of the biological scene. This page presents 266 DNA methylation-related publications that we have
curated by establishing a standardized curation process. You can view detail information in the table in the
lower part of the page, including species, tissues, diseases, conditions, enrichment functions, featured
DMGs, etc.
 |
You can also explore the relationship between genes and diseases at the
DNA methylation level through the interactive graphs in the Disease Network and Gene Network sections.
Tissue Sunburst panel illustrated the tissue distribution of every biological conditions.
 |
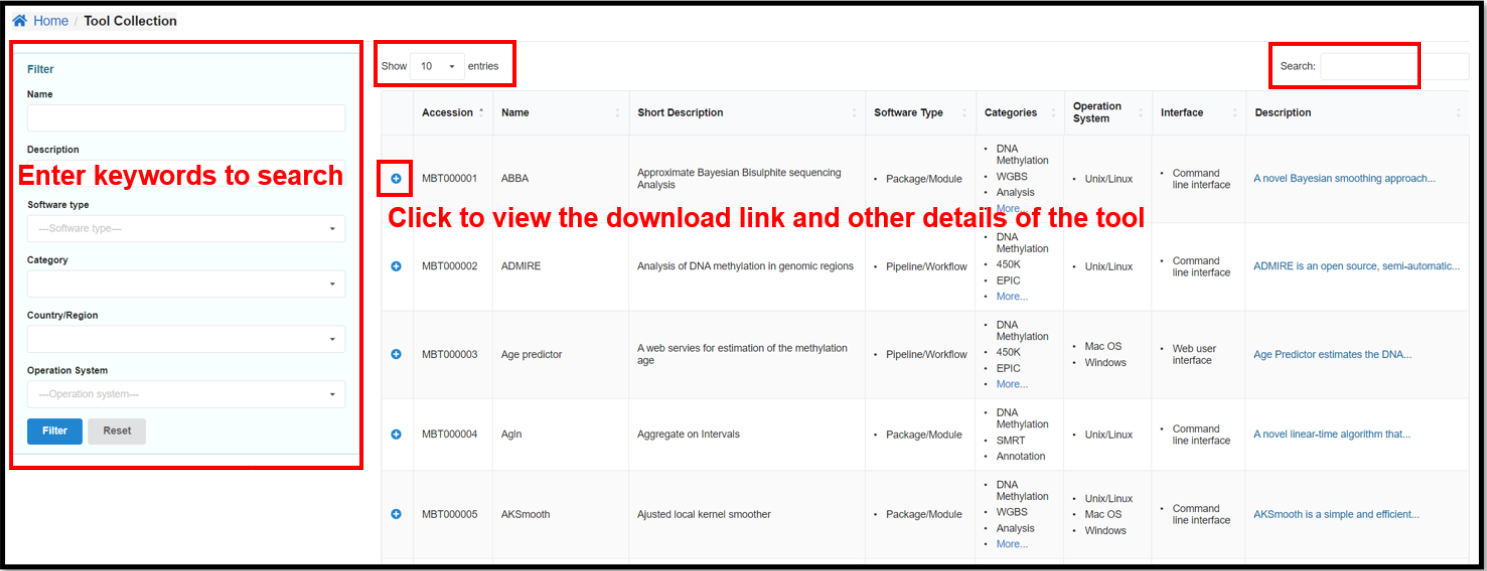
4.2 Tool Collections Page
Tool Collections page provides 501 methylation related tools collected by
predefined keywords from the original literature and web sources. It is characterized by diverse
categories, types, operating systems and other indicators. These tools are grouped into five main types:
application/script, framework/library, package/module, and toolkit/suite. You can enter specific
conditions on the left side of the Tools Collection page to view the corresponding tools.
 |
5.1 Age predictor
Introduction
Age predictor is a predictive tool that uses methylation chip
data of human blood to predict the age. You can input idat files, processed data or NCBI GEO
Sample ID to get age prediction results of the three methods.
Usage
 |
There are three kinds of input designed for different situations:
Idat Files: You can upload compressed raw data files (.gz format), which
contain two files (one for green signal intensity and another for red signal intensity). Age
Predictor will process the raw data using standard Illumina pipeline and return a predicted
age.
Processed Data: The processed data file should be a tab (\t) delimited text
file. The first column of processed data must be CpG probe identifiers (cg numbers), such as
cg00000165. The second column of processed data must be beta values (range from 0 to 1). The
file must contain 52 probes to meet our model need (list in probe_list.txt).
NCBI GEO Sample ID: You can paste sample ID list to the text box directly.
Result Interpretation
There are three different methods of age prediction: Support
Vector Machine (SVM), Random Forest and Elastic Net.
5.2 IDMP
Introduction
IDMP is a tool to identify the differentially methylated
promoters between two samples via Fisher's exact test with FDR correction. It is written in
Perl and is executed from the command line in LINUX system.
Usage
For details on how to use IDMP, see the link below:
https://ngdc.cncb.ac.cn/methbank/tools/idmp#usage
DMR toolkit is a pipeline package for DMRs identification,
annotation and enrichment for multiple species.
Follow these steps for analysis:
(1) Two input files for methylation levels obtained by WGBS to
be analyzed as case group and control group need to be prepared.
The following are examples of two input file formats. The meaning of these
properties are listed in
https://ngdc.cncb.ac.cn/methbank/tools/dmr/toolkit#3.4
(2) Install the following software and packages.
(3) Run DMR Toolkit as follows.
# Download DMR Toolkit and extract
it
wget -c https://download.cncb.ac.cn/methbank/Tool/DMRtoolkit_v1.0.tar.gz
tar -xzf DMRtoolkit_v1.0.tar.gz
# Make your directory and input files
cd ./DMRtoolkit_v1.0
mkdir process
# You can name the directory any way you want
cd ./process
mkdir Homo_sapiens
# You can name the directory any way you want
cd ./Homo_sapiens
vim case.txt
# Methylation data of the case group
vim control.txt
# Methylation data of the control group
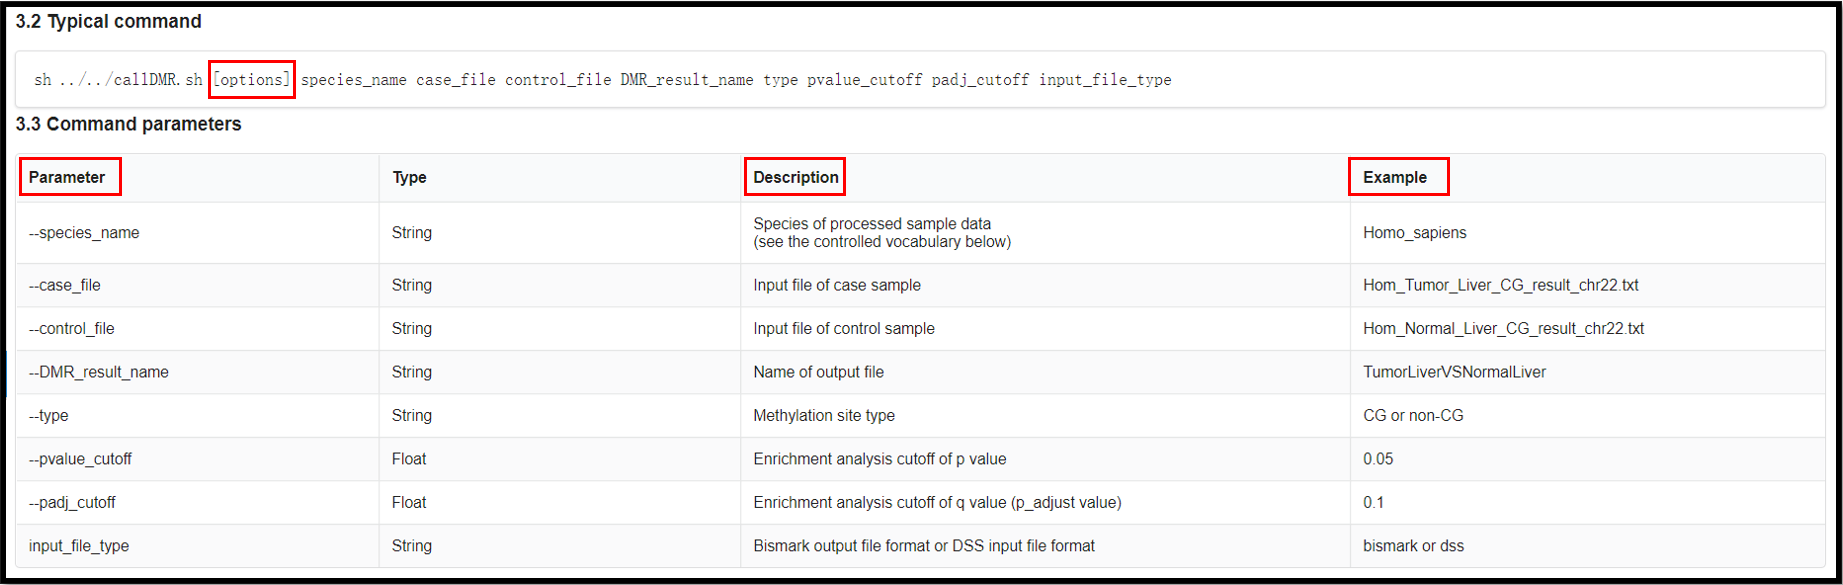
# Run callDMR.sh
sh ../../DMRtoolkit_v1.0/callDMR.sh Homo_sapiens ./case.txt ./control.txt
DMR_result_name CG 0.05 0.1 bismark
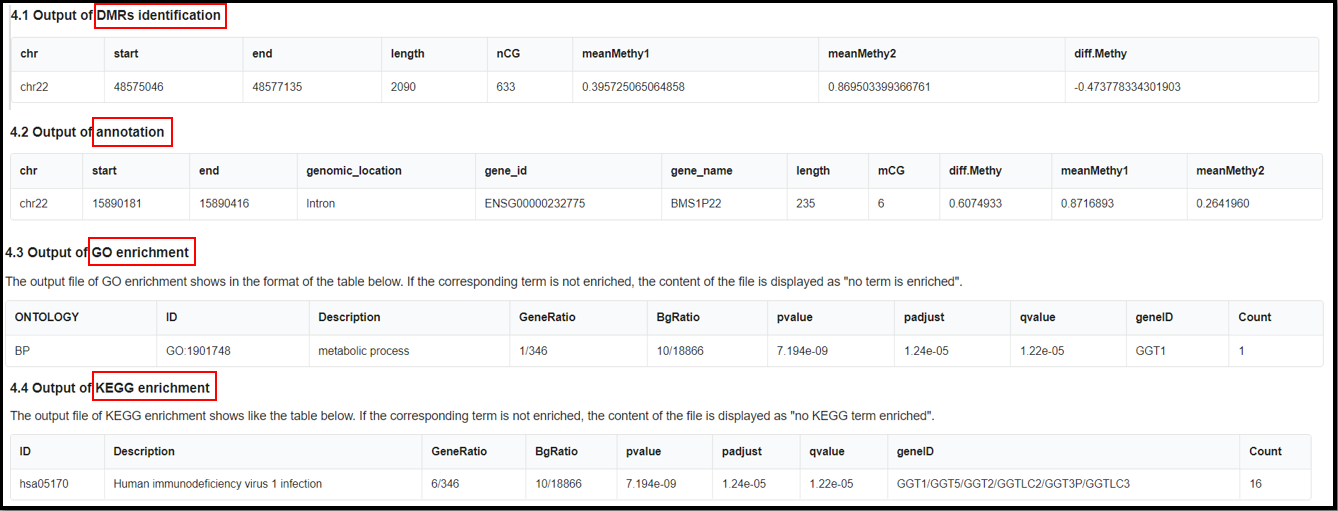
(4) Result of the analysis.
The names of final output file:
"DMR_result_name"_DMR_0.01.txt
"DMR_result_name"_DMR_0.01_Anno.tsv
"DMR_result_name"_DMR_0.01_GO.tsv
"DMR_result_name"_DMR_0.01_KEGG.tsv
For more information about DMR toolkit, see the link below:
https://ngdc.cncb.ac.cn/methbank/tools/dmr/toolkit
6. Download
From this page, you can download all the single base precision methylation
data and their annotation information provided in the database. We also provide the sex-specific 450K
and 850K methylation data of 111 healthy human tissues.
Data can be downloaded by clicking the icon on the page or using an FTP tool (such as FileZilla Client).
If you have any questions, comments or suggestions, please send us an email
at methbank(AT)big.ac.cn, and, we will give corresponding at the first time.
Methbank is free for academic use only. For any commercial use, please contact
us for
commercial licensing terms.