Help
1. Database Overview
Transposable elements (TEs) constitute nearly half of the human genome. Normally silenced in somatic tissues, TEs can become aberrantly activated in cancer, contributing to tumor progression and oncogenesis. Altered TE expression is increasingly recognized as a hallmark of cancer and a promising target for immunotherapy. However, due to their repetitive nature, TEs are often excluded from gene-centric single-cell analyses, limiting our understanding of TE dynamics in cancer. To address this gap, we developed TE-SCALE, a dedicated database for systematic analysis and visualization of TE expression pattern across human cancers at single-cell resolution.
To our knowledge, TE-SCALE represents the first pan-cancer single-cell atlas of TE expression. It is constructed from publicly available scRNA-seq datasets comprising over 1.3 million high-quality cells from 330 samples across 20 cancer types and 12 tissue origins. Powered by a streamlined and standardized computational pipeline, TE-SCALE enables robust quantification of 1,051 curated TE subfamilies, integrates both gene and TE expression profiles, and supports accurate cell-type annotation. The platform facilitates comprehensive analyses of TE activity, including TE expression dynamics across cell types, identification of tumor-specific TEs, exploration of TE-gene co-expression networks and their functional roles within the tumor microenvironment.
TE-SCALE serves as a critical resource for discovering TE-derived candidate biomarkers and immunotherapy targets, advancing cancer research through enhanced insights into TE dysregulation and enabling TE-based diagnostic and therapeutic innovation.
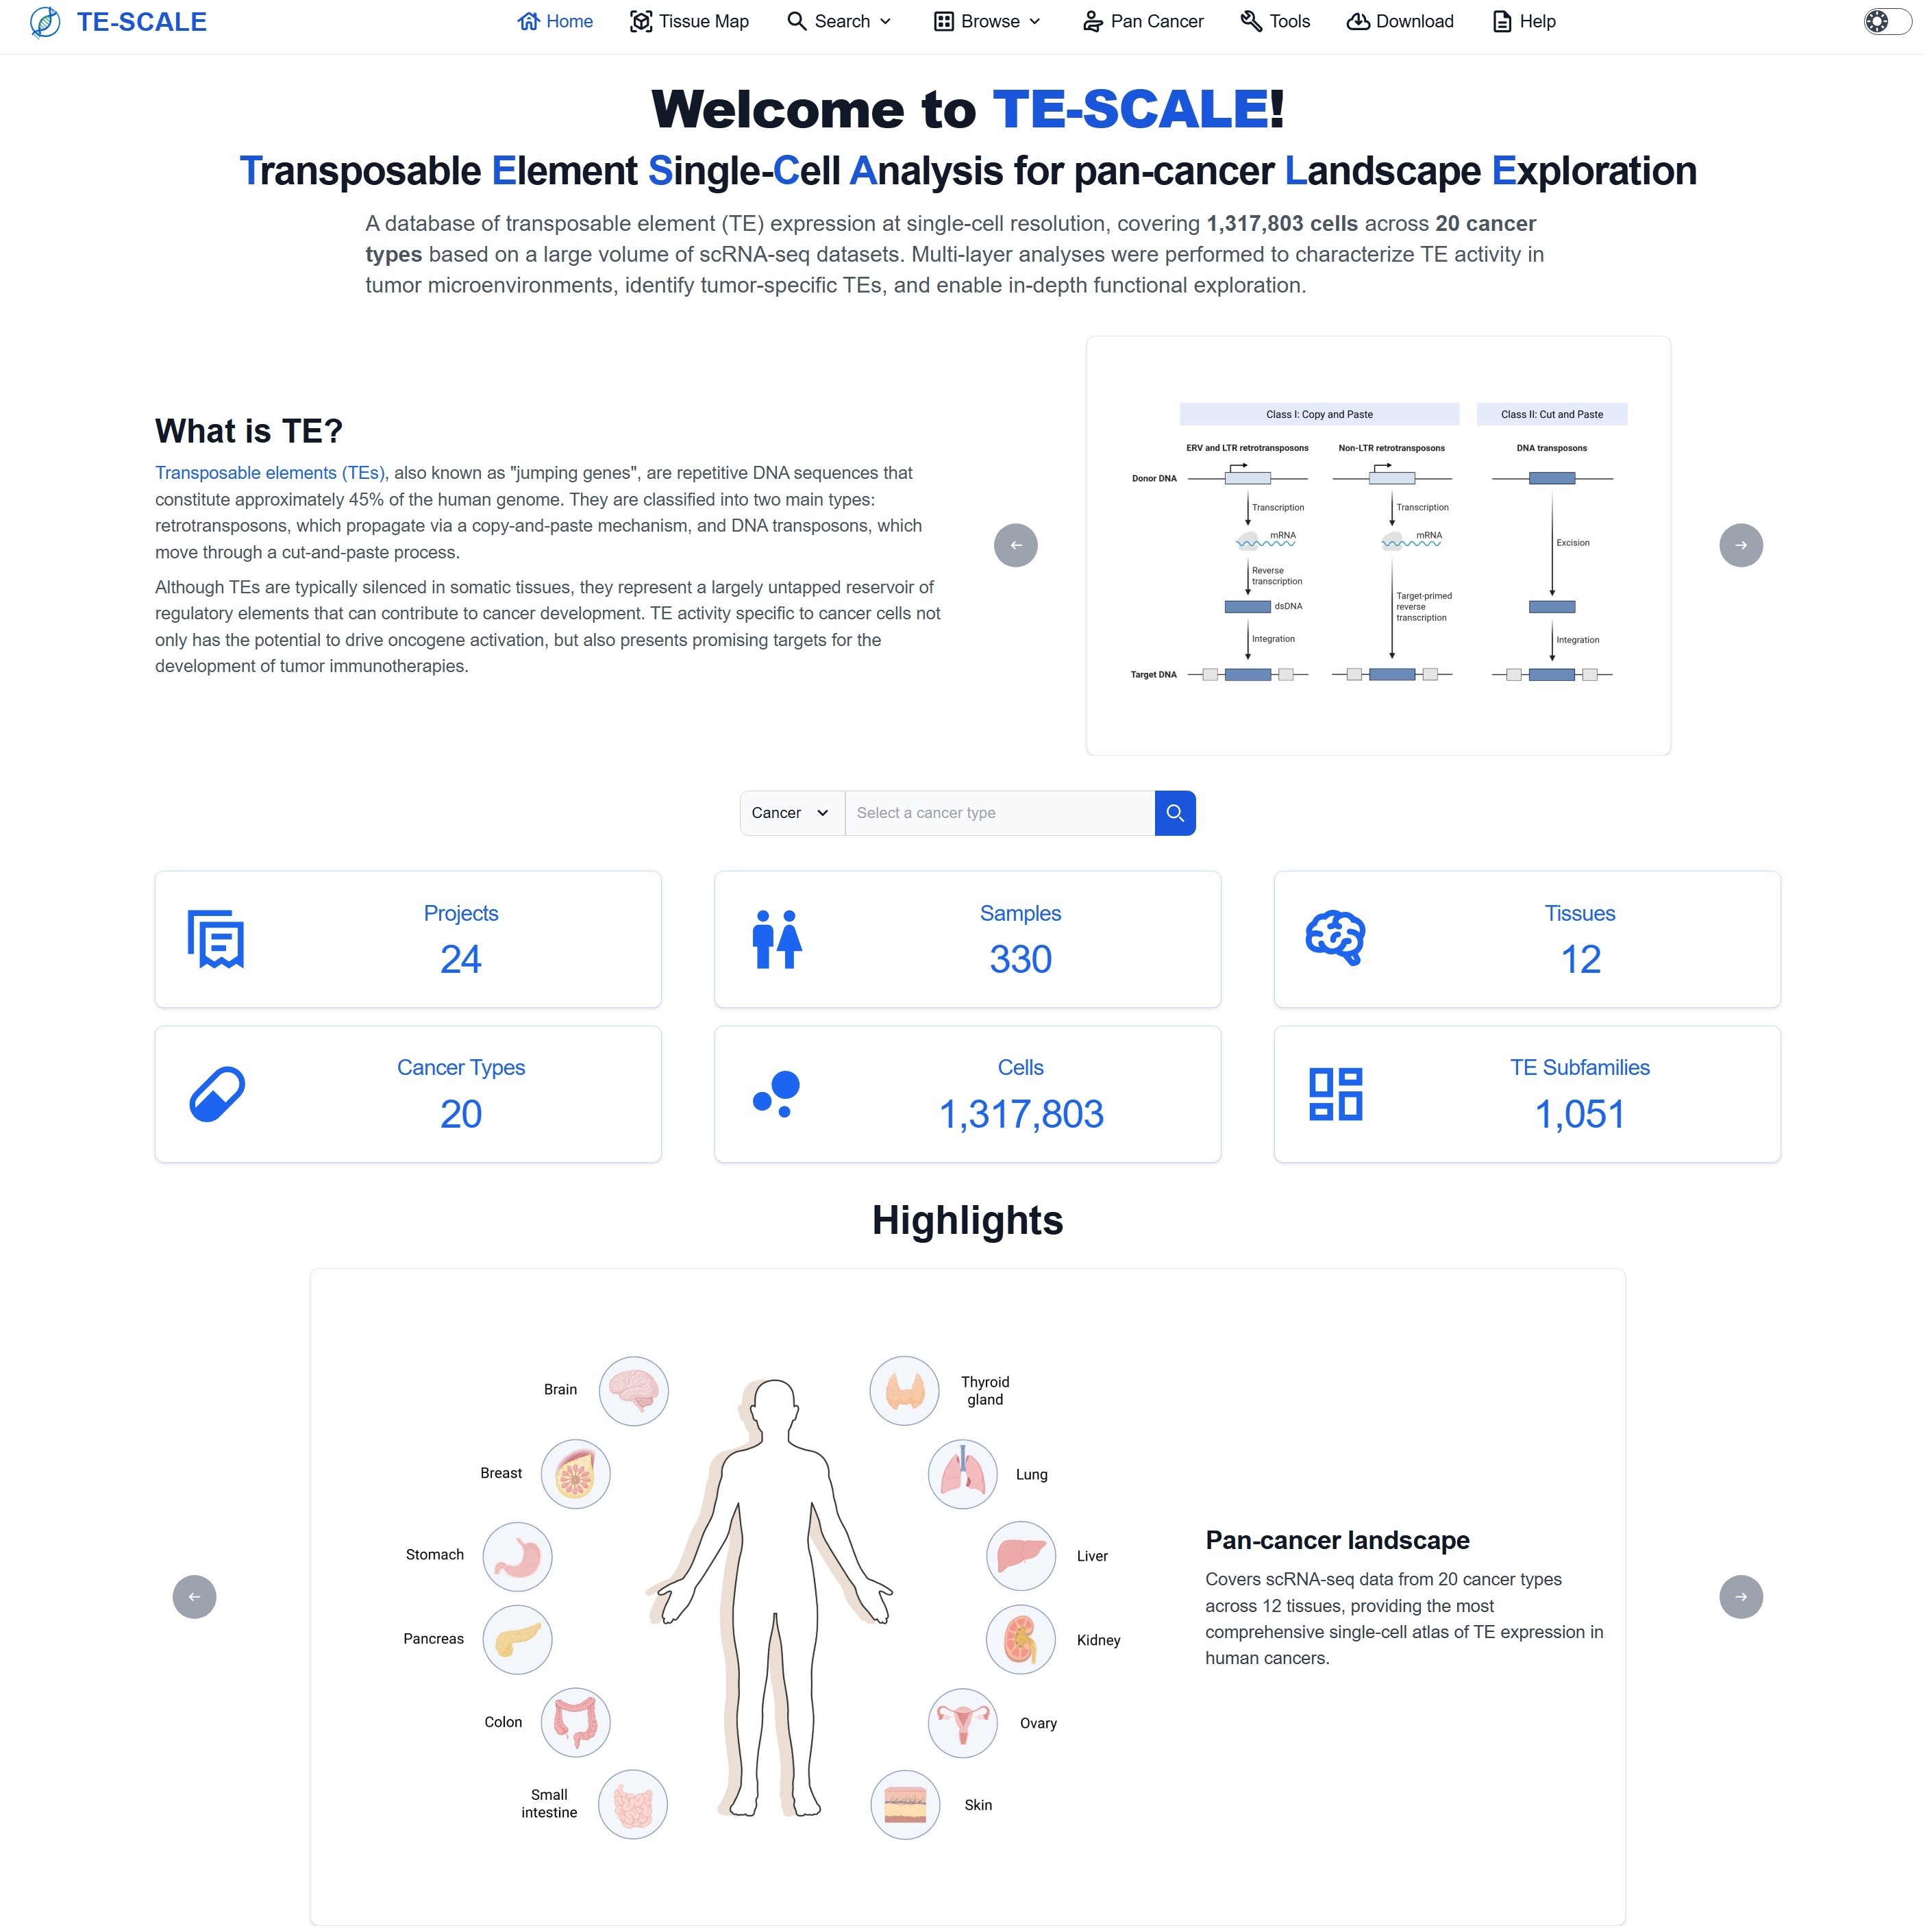
2. Home Page
The Home page comprises several key modules, including database functional navigation, quick search by cancer type/tissue origin/TE subfamily, core statistics, highlights, key analyses, related resources, updates, citation and contact information. To facilitate broader accessibility, particularly for users with backgrounds in single-cell biology, cancer biology, or clinical research who may not be extensively acquainted with TEs, a concise introduction to TEs is also provided on the Home page.
3. Tissue Map Page
The Tissue Map page presents a UMAP visualization of 12 integrated tissue origins. It provides an interactive analytical framework that supports multi-level data exploration—from pan-cancer comparisons to tissue-, sample-, and cell-level resolution—allowing researchers to investigate TE expression in diverse biological contexts.

Upon selecting a tissue of interest, users enter the Tissue Explorer, which includes the following components:
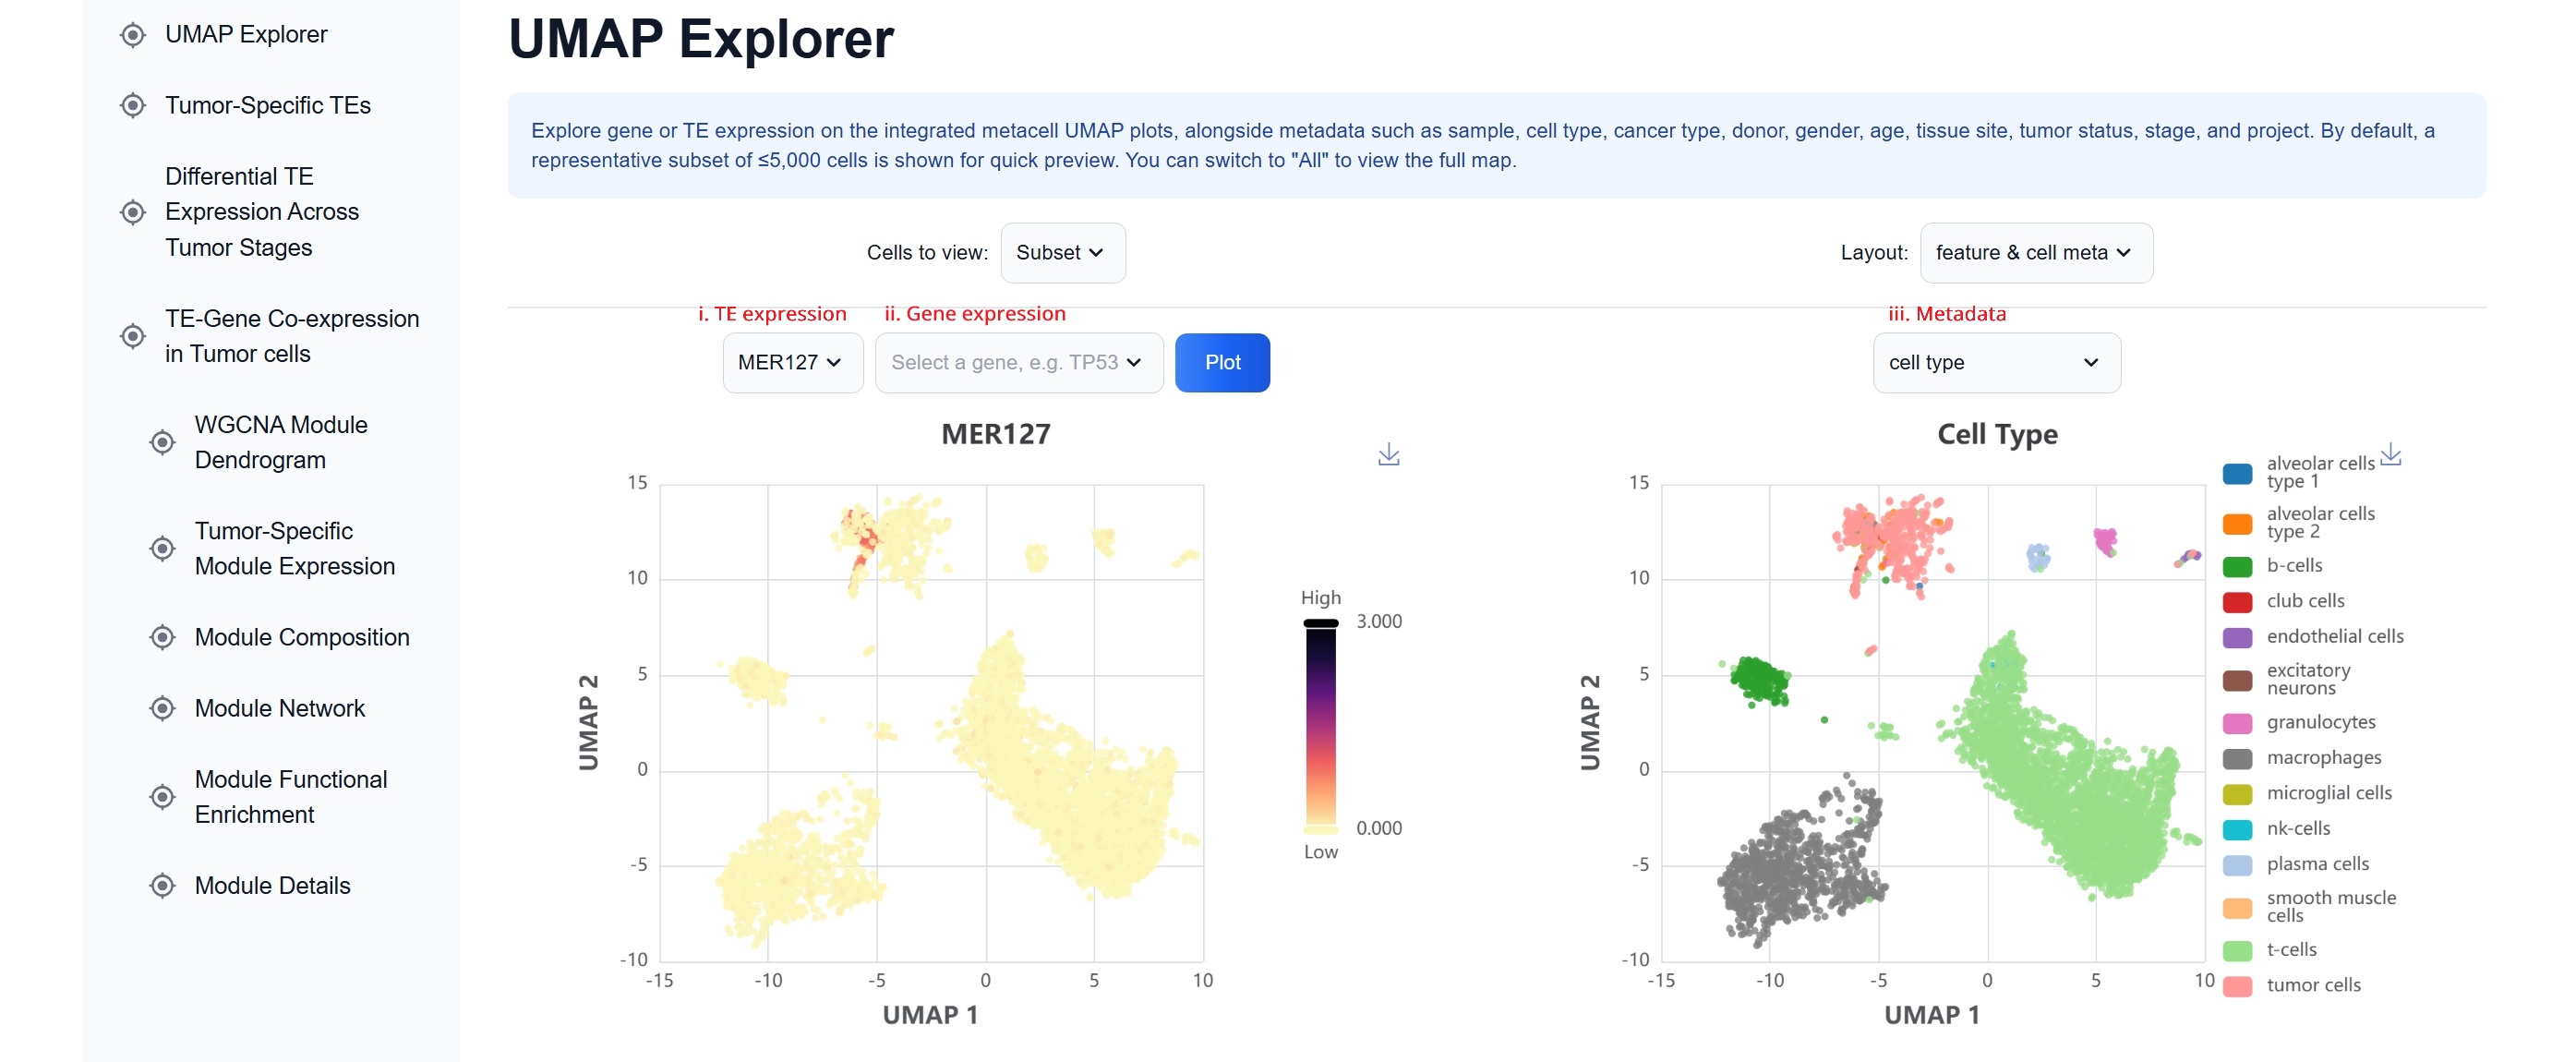
(1) UMAP Explorer
Interactive UMAP plots display both feature expression (e.g.,
specific TEs or genes) and metadata attributes (e.g., tissue type, cancer type, disease
state), enabling intuitive visual comparison across different conditions.
i. Expression: select a TE, e.g. MER127
ii. Expression: select a gene
iii. Metadata, e.g. cell type
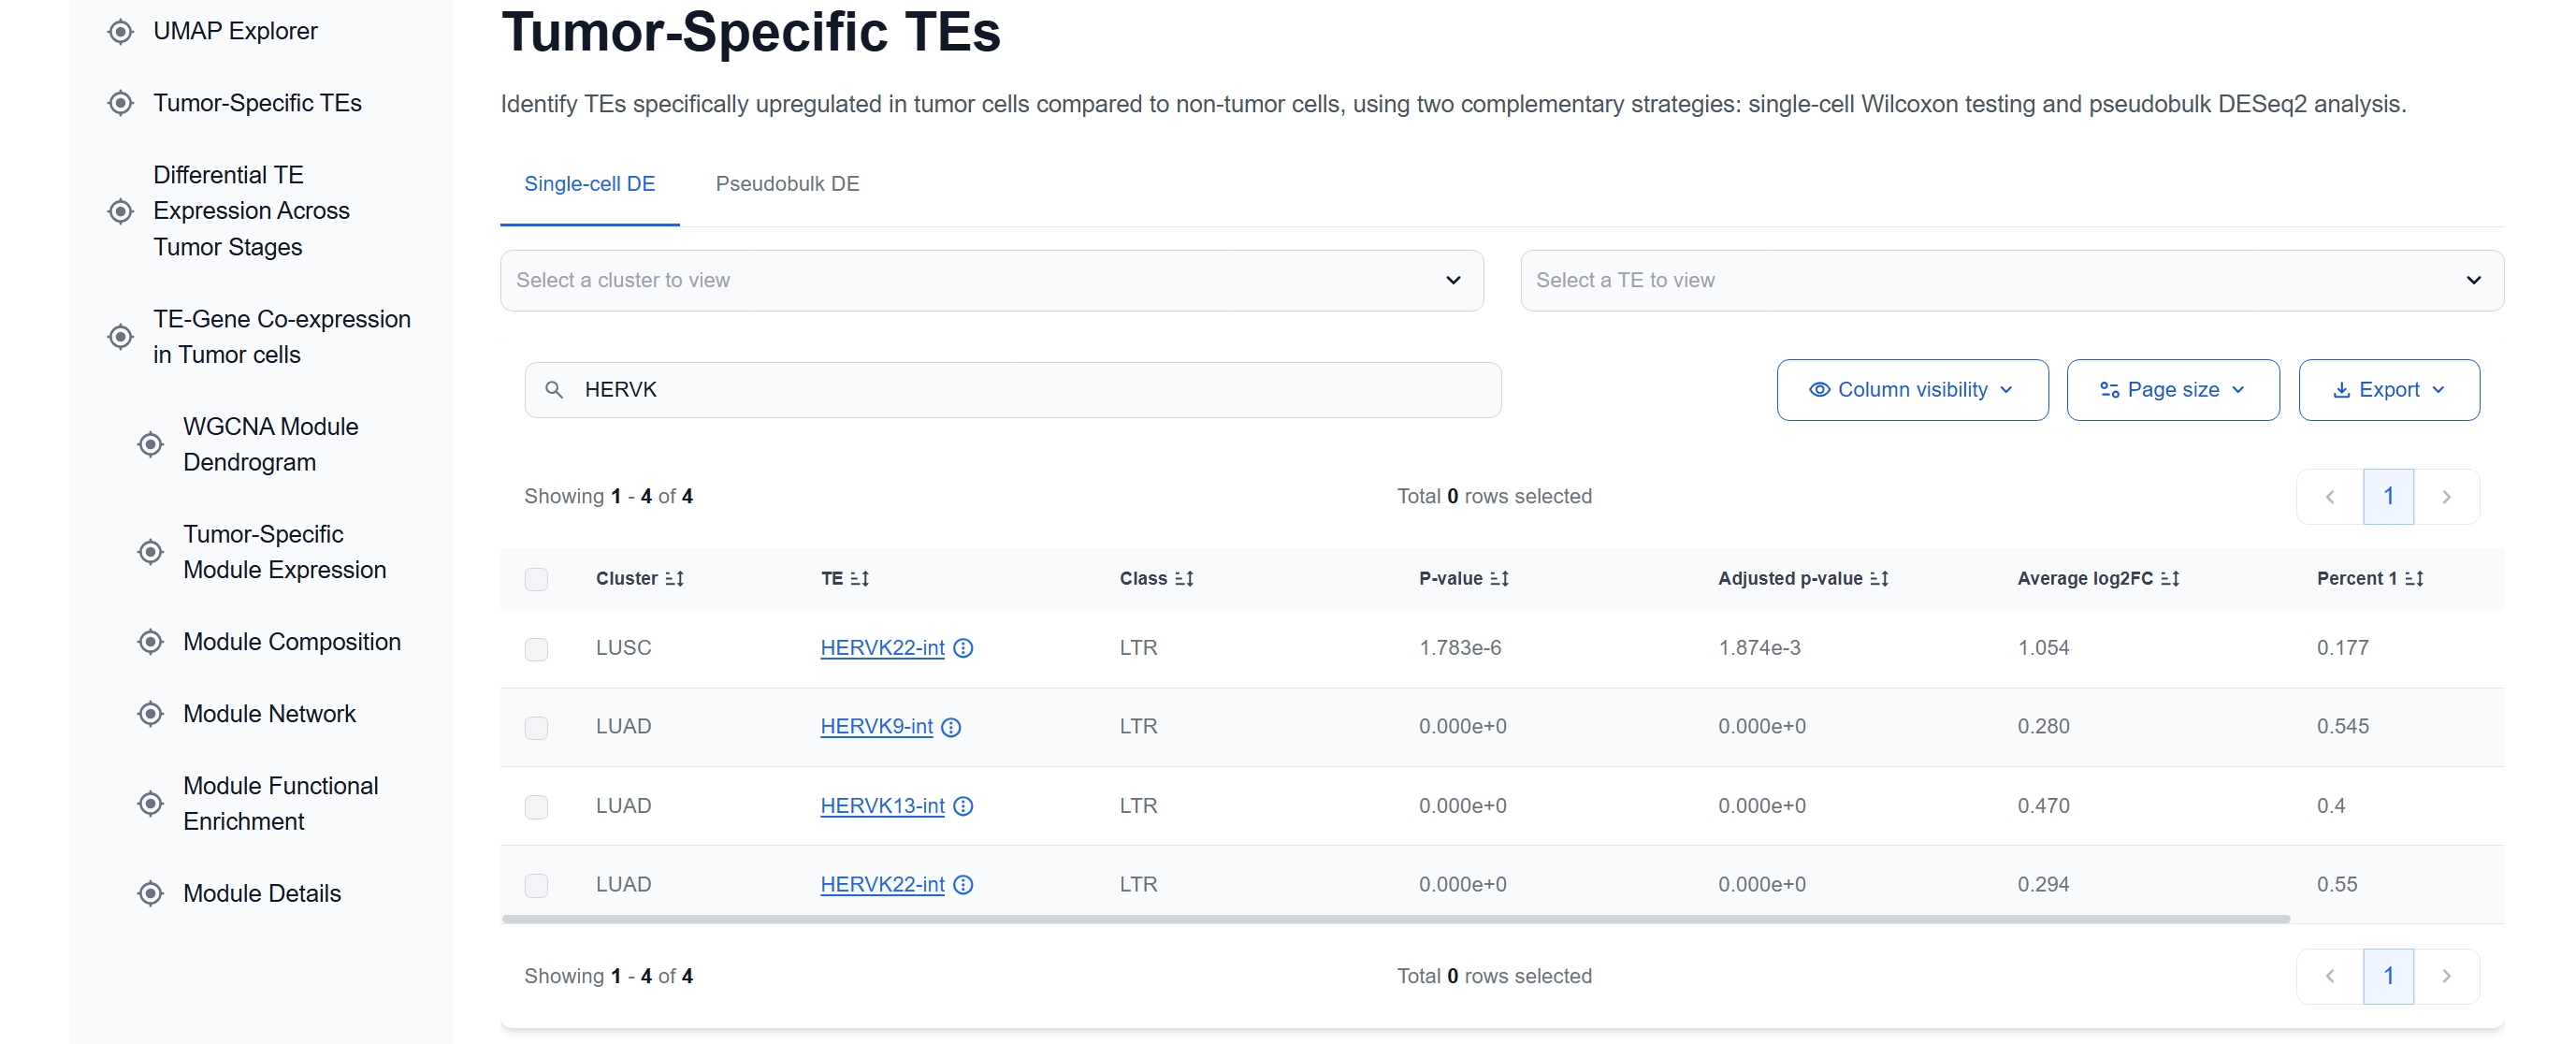
(2) Tumor-specific TEs
For each tissue, TE-SCALE highlights tumor-specific TE
subfamilies that are differentially expressed between tumor and normal cells within each
cancer type. These TEs provide candidate biomarkers with potential translational value.

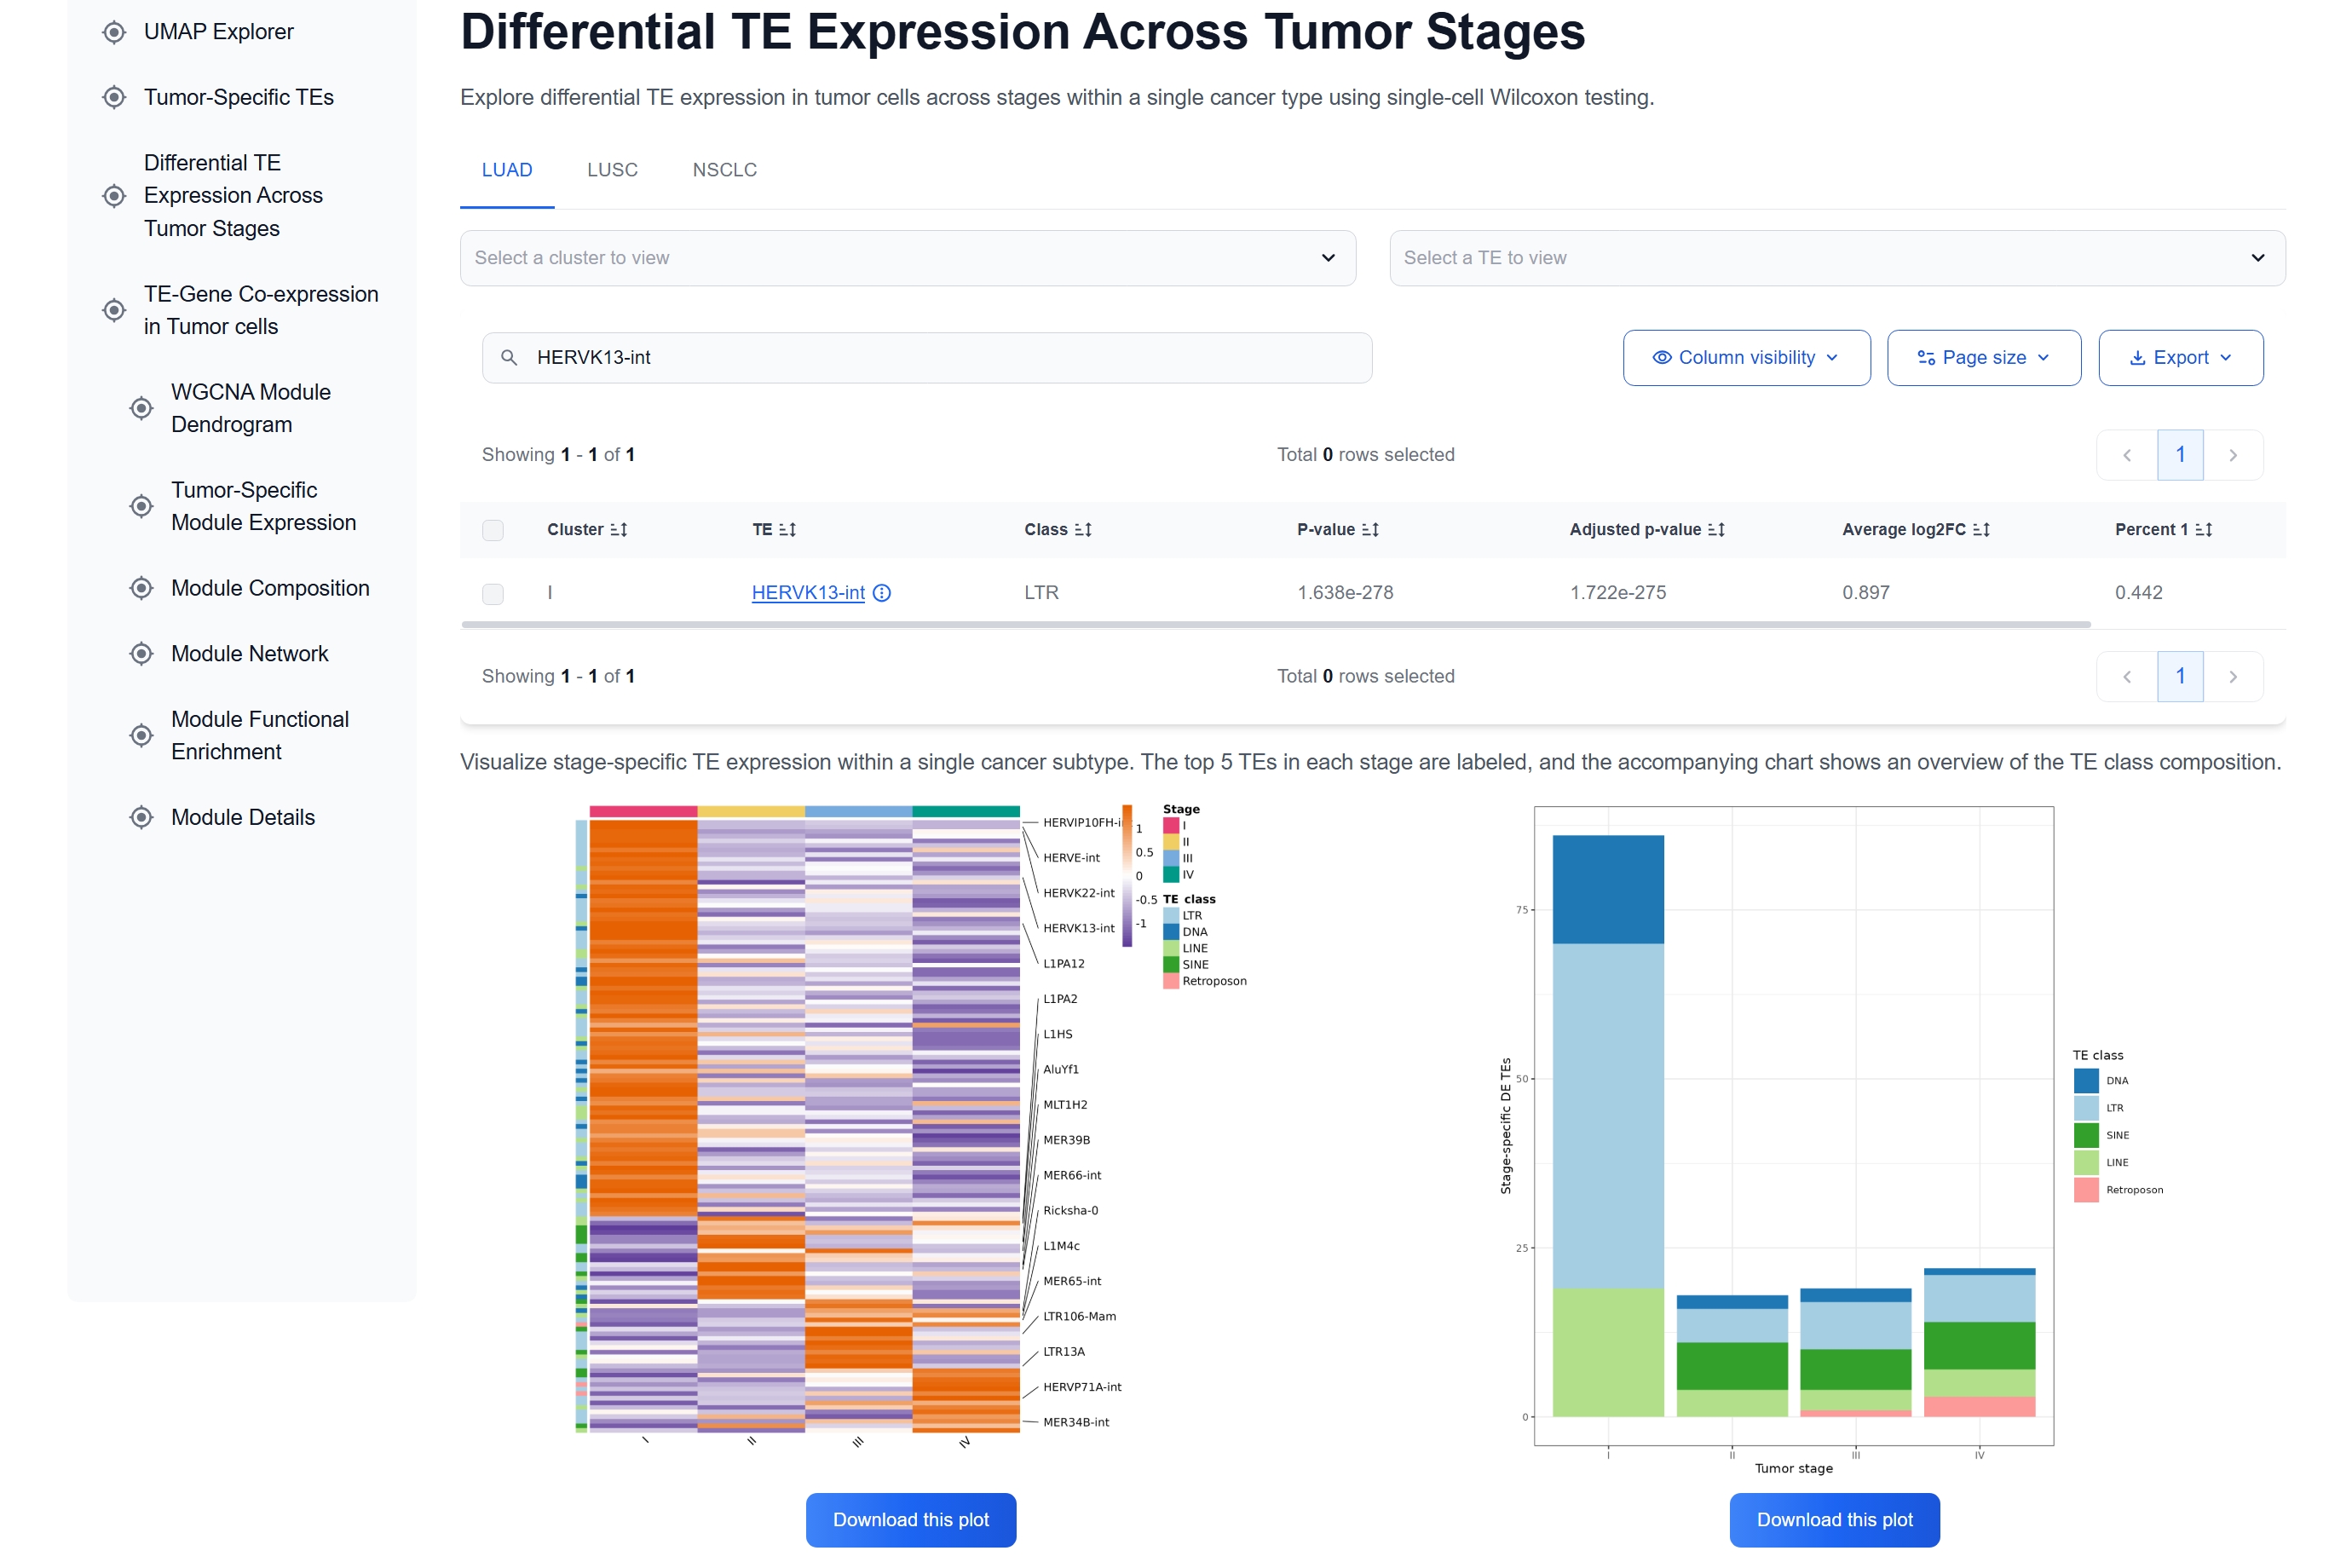
(3) Differential TE Expression across Tumor Stages
TE-SCALE also performs differential
TE expression analysis across tumor stages within a single cancer subtype for datasets with
clinical stage information.

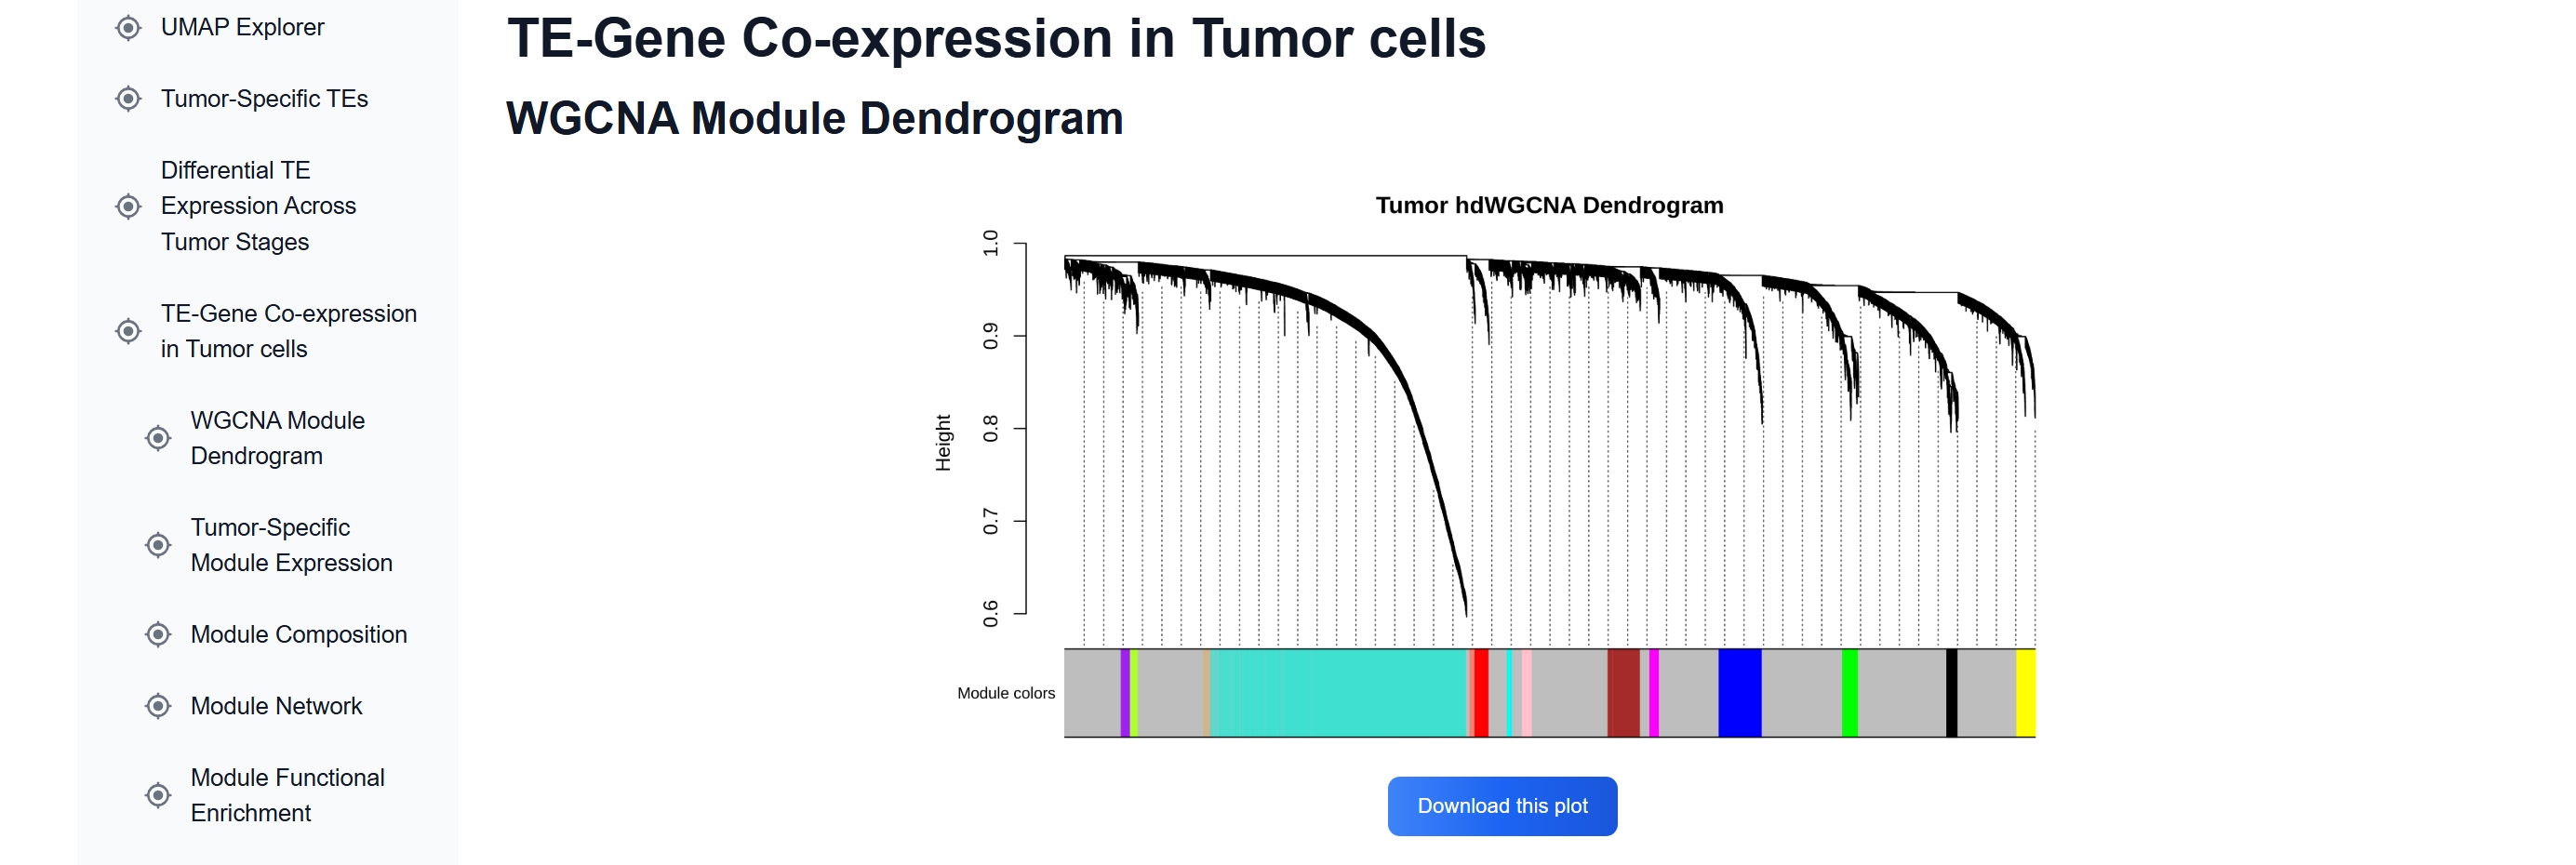
(4) TE-gene Co-expression in Tumor Cells
TE-SCALE constructs TE-gene co-expression
networks using a WGCNA approach and identifies functional gene modules specific to tumor
cells. This enables users to explore regulatory relationships and tumor-specific expression
programs. The potential biological roles of TEs are inferred from their co-expressed genes
within the same module.
4. Search Page
TE-SCALE provides several search channels as follows: quick search on the Home page, advanced search for sample/TE on the Search page, and global fuzzy search embedded on the Browse page.
4.1. Quick Search
Quick search provides users with real-time querying by cancer type, tissue origin, or TE subfamily. The search returns corresponding samples along with their analysis results and the overall expression patterns of the selected TE.
4.2. Advanced Search by Samples
There are five modules that users can utilize to seek for samples of interest. Sample name-, Tissue origin-, Cancer type-, Project- and Platform- options can be used in composite searching mode. Each result in the table includes a link that directs users to the corresponding detailed sample page.

4.3. Advanced Search by TEs
There are four modules that users can utilize to seek for TEs of interest. TE subfamily-, Class- and Family- options can be used in composite searching mode. TE-associated genes option can only be used independently. Each result in the table includes a link that directs users to the corresponding TE information page.

4.4. Global Fuzzy Search
There are four modules that users can utilize to seek for TEs of interest. TE subfamily-, Class- and Family- options can be used in composite searching mode. TE-associated genes option can only be used independently. Each result in the table includes a link that directs users to the corresponding TE information page.
5. Browse Page
5.1. Browse Samples
The Sample Browse page has an interactive table featuring key messages for all recruited scRNA-seq datasets. Among which, filtered cell count is reported as the fundamental basis for downstream analysis, project accession links direct to the original data source, sample links to a detailed page that includes a curated metadata table of the given sample and their TE transcriptomic analysis results, and reference links to the related publication(s).

(1) Presentation of Sample Details

(2) TE Transcriptome Analysis Results
There are six major modules for browsing
transcriptome analytical results: cell type composition, TE expression distribution, UMAP
visualization of cell clustering, CNV inference, differential expression, and GSVA
enrichment analysis.


5.2. Browse TEs
The TE Browse page has an interactive table featuring key information for all TE subfamilies identified by scTEfinder in our datasets. Among which, Dfam accession links to the corresponding Dfam entry, and TE links to a detailed page containing annotation data, summary statistics and overall expression profiles across diverse biological contexts. Analyses of TE-correlated genes are also available, offering valuable data that may aid in elucidating TE-gene regulatory relationships and functional roles.

(1) Presentation of TE Basic Information

(2) TE Expression and Genomic Features
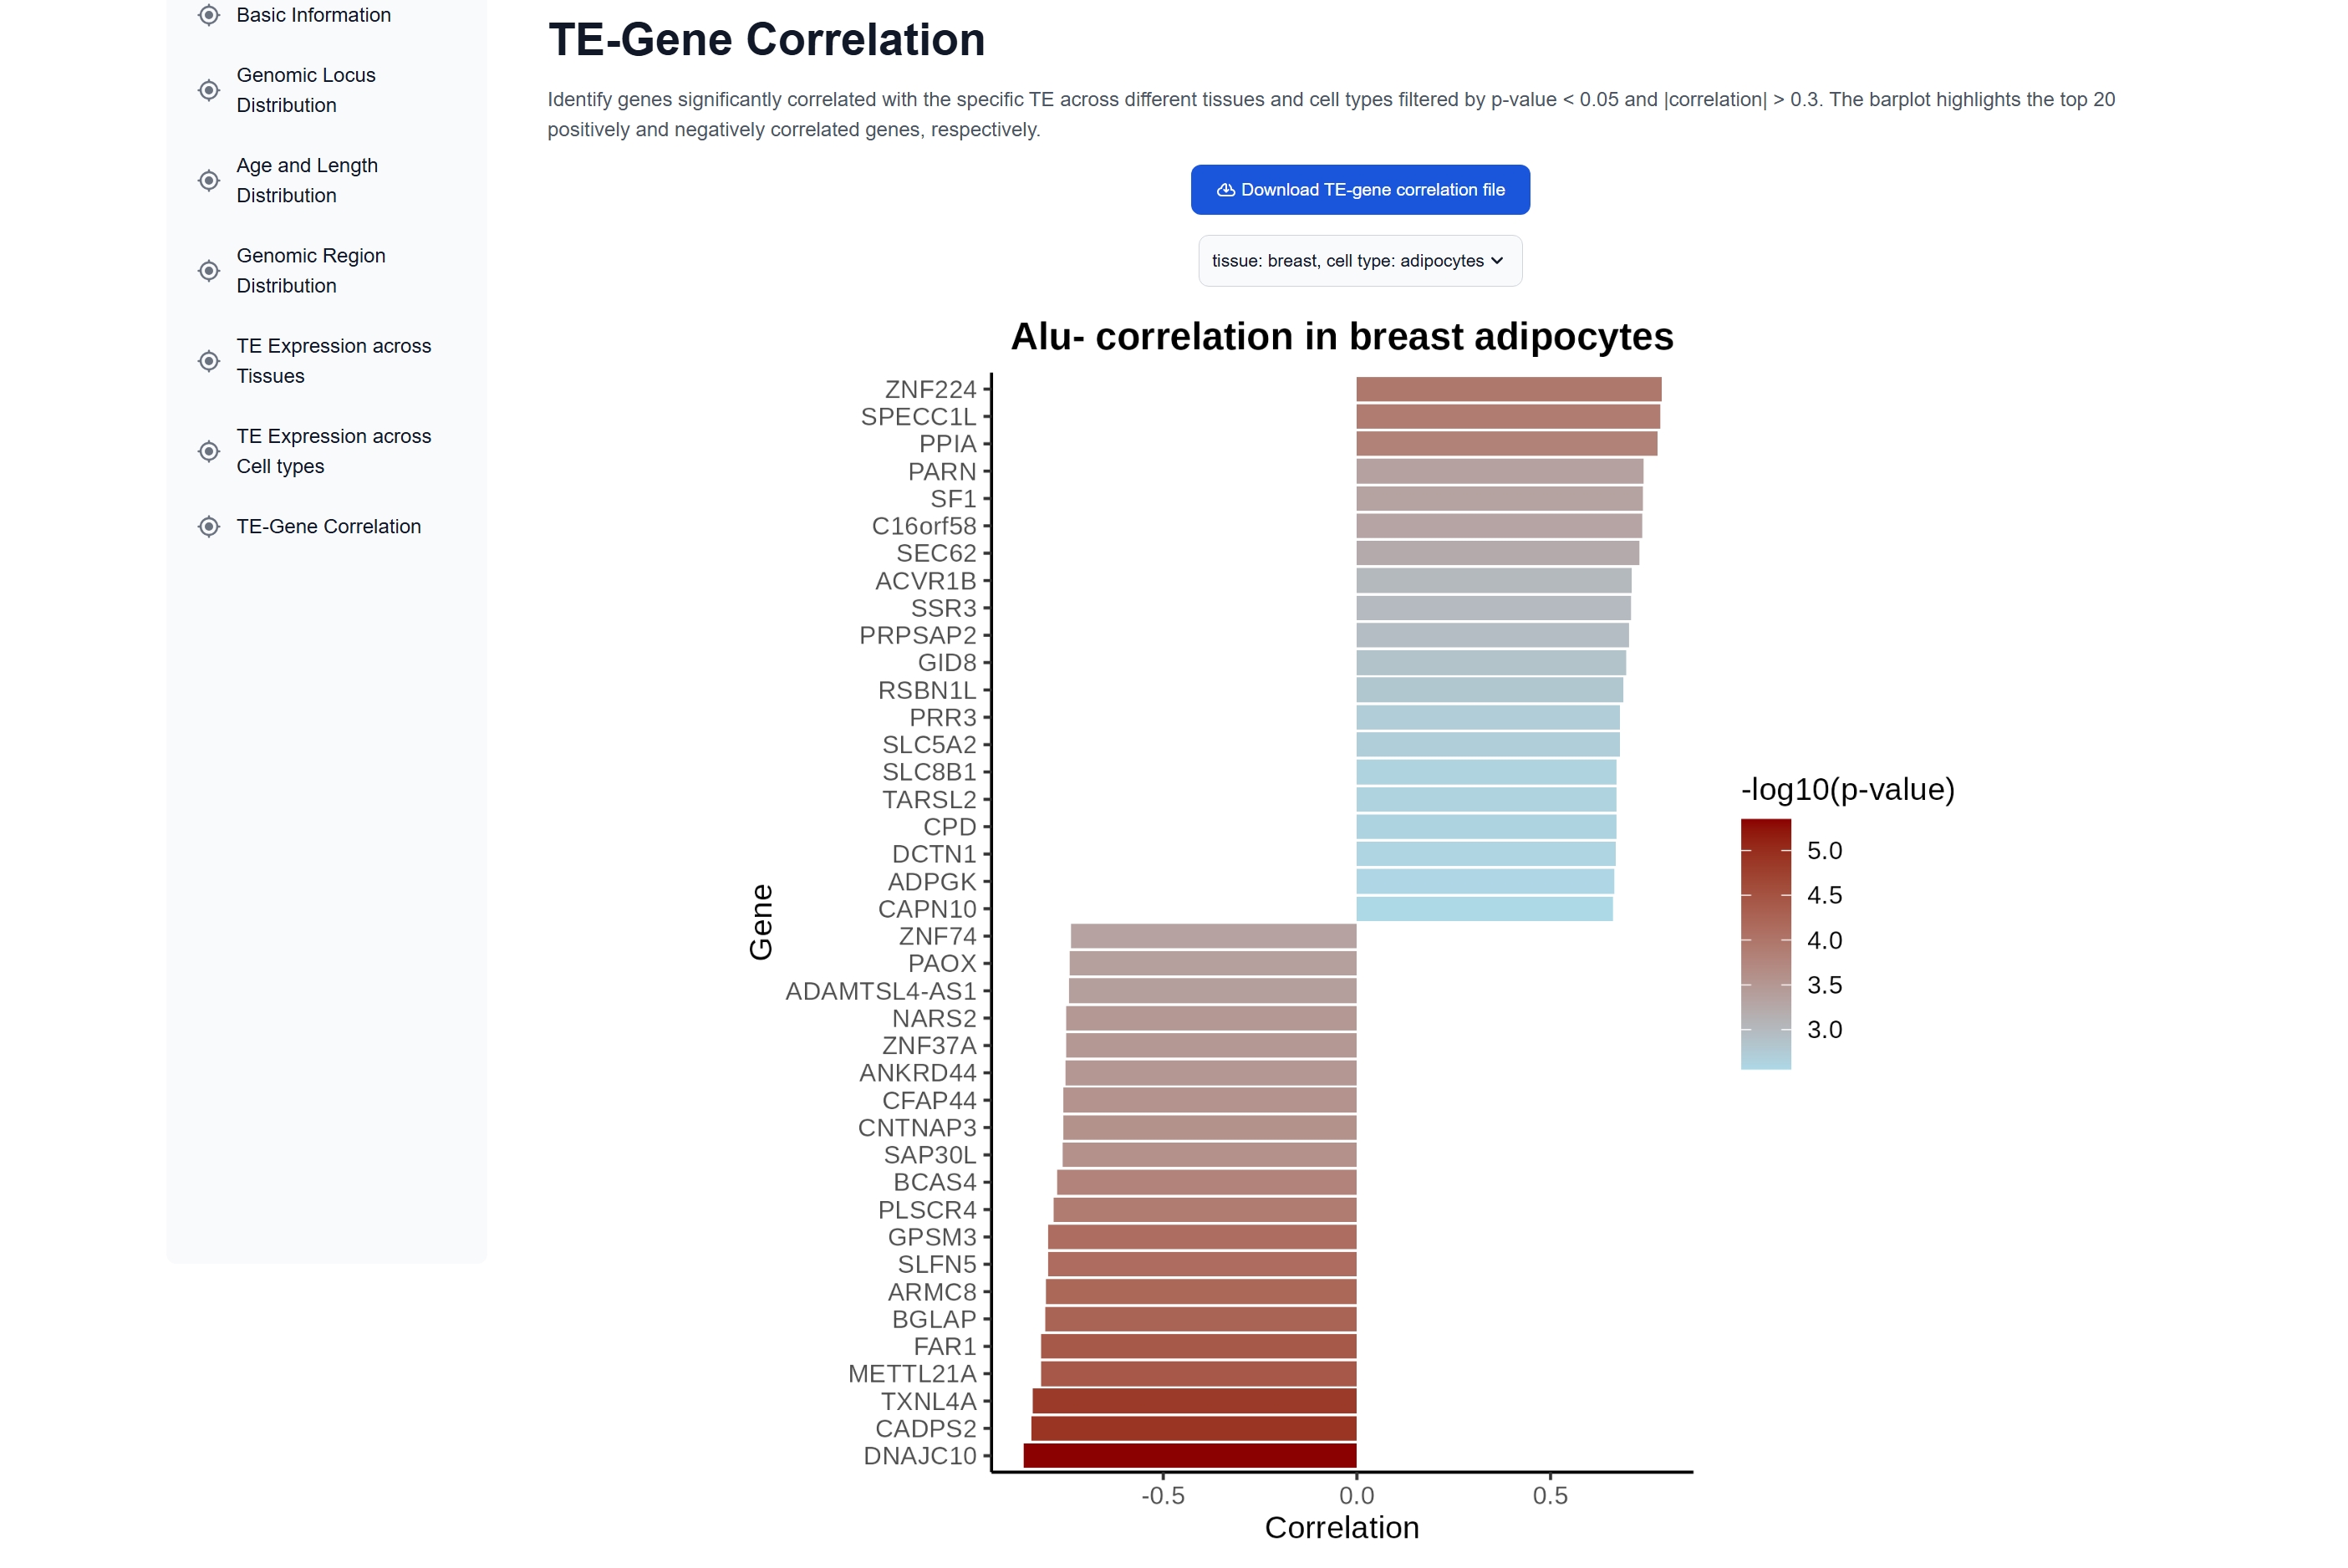
There are six major modules for browsing TE
results: genomic locus distribution, age and length distribution, genomic region
distribution, TE expression across tissues, TE expression across cell types, and TE-gene
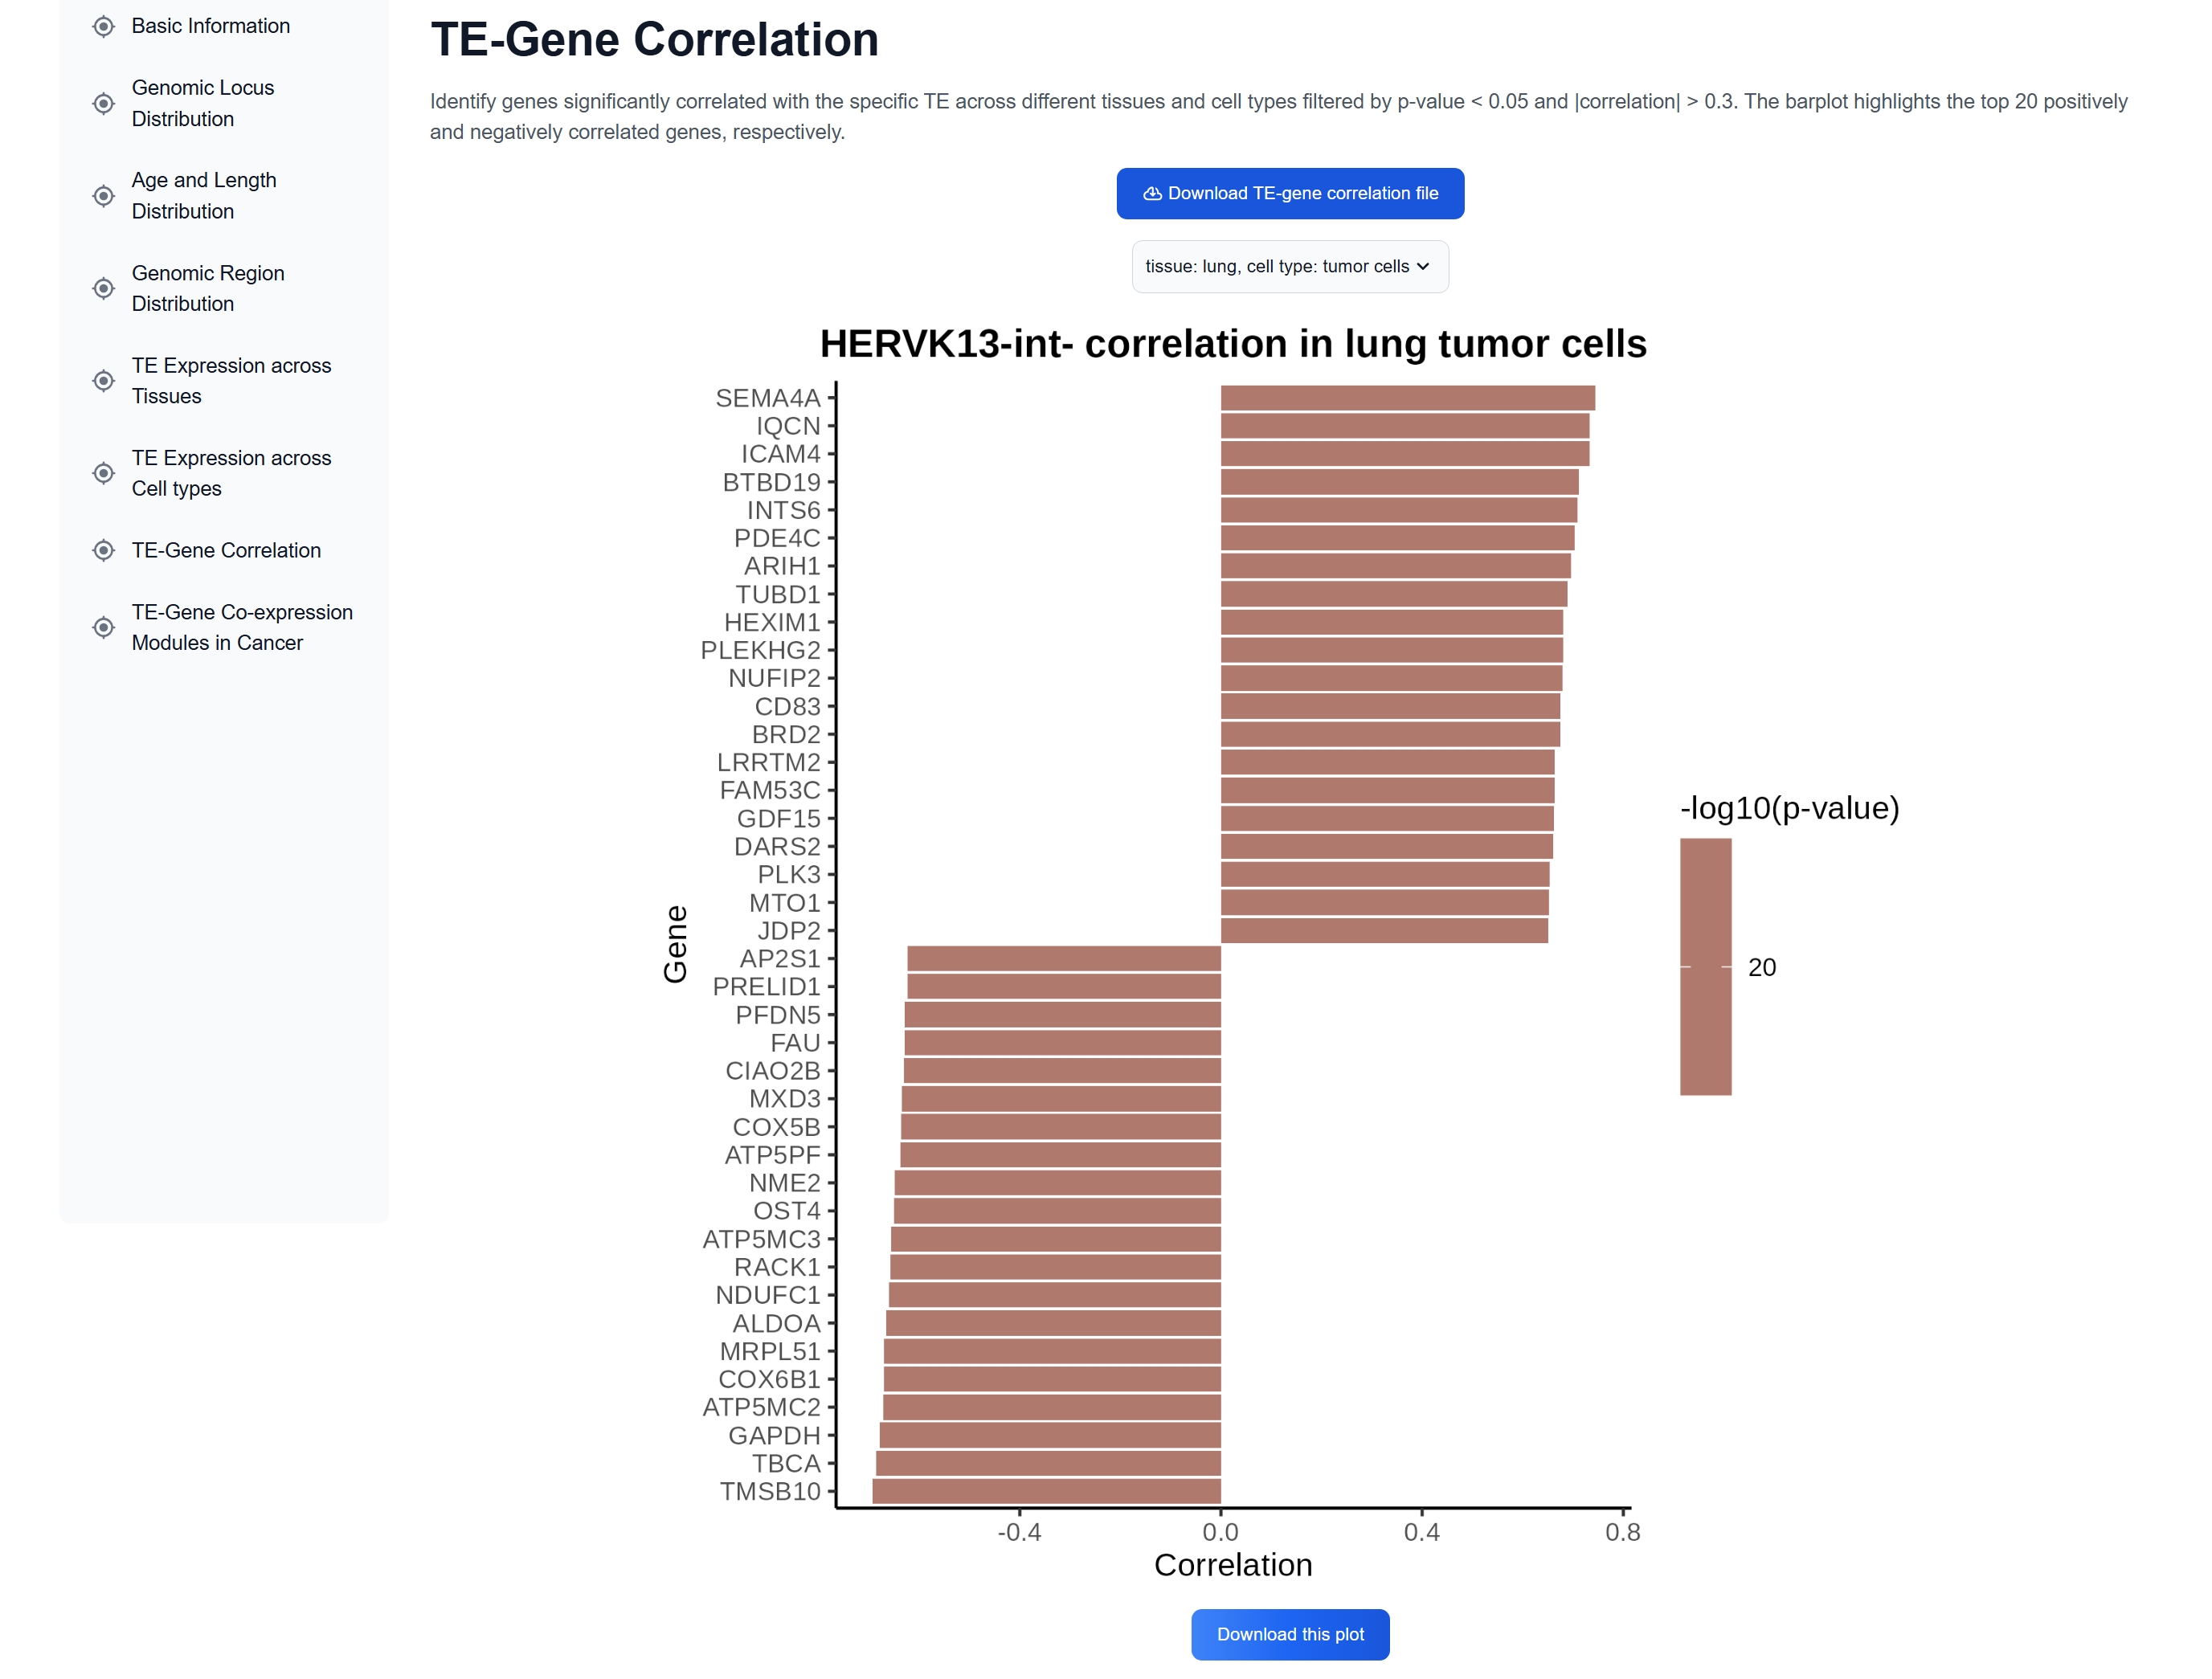
correlation analysis across different tissues and cell types.

(3) TE-Gene Co-expression Modules in Cancer
This module summarizes TE co-expression
modules across various cancer types, providing a comprehensive view of TE regulatory
landscapes.

6. Pan Cancer Page
The Pan Cancer page presents comprehensive analyses of TE expression at single-cell resolution. It includes detailed statistics on sample distribution, scRNA-seq data sources, cell-type annotations, cell compositions, and TE expression characteristics. A key feature is the systematic identification of tumor-specific TE subfamilies across diverse cancer types, encompassing both previously reported and novel elements. Many of these TEs display strong specificity for particular cancer types or disease states and perform comparably to established cancer marker genes in distinguishing tumor from normal cells, thereby offering valuable candidates for diagnostic biomarker discovery and clinical immunotherapy targeting. In addition, TE-SCALE incorporates a curated collection of TE-related clinical studies, covering applications such as vaccines, antibody therapies, cell-based therapies, and neoantigen identification.

7. Tools Page
TE-SCALE features scTEfinder, a robust and standardized pipeline developed for accurate quantification of TE subfamilies from raw scRNA-seq data. This pipeline enables comprehensive downstream analyses, including cell-type annotation, clustering, TE differential expression, TE-gene co-expression analysis, and functional enrichment.
The platform provides precomputed analysis results for all datasets using scTEfinder, while also supporting offline use for custom datasets. It is compatible with scRNA-seq data generated from all widely adopted 10x Genomics library chemistries, including 3' v1/v2/v3 and 5' v1/v2/v3 protocols. Researchers can apply scTEfinder to their own data to ensure reproducible and high-quality TE quantification and downstream functional analyses.

8. Download Page
The Download page provides access to Seurat objects generated by the standardized scTEfinder pipeline. Each object contains both gene and TE expression count matrices, along with comprehensive metadata for downstream analysis.

9. Case Study
HERVK13-int is a subfamily of HERV-K, and the HML-2 group within HERV-K has been experimentally shown to be upregulated in lung cancer cell lines and patient blood samples at the transcriptional level. On the Lung subpage of Tissue Map, researchers can systematically explore its tumor-specific activation and molecular context in lung adenocarcinoma (LUAD).
(1) Identify Tumor-specific Activation
The Tumor-Specific TEs table highlights
HERVK13-int as significantly upregulated in tumor cells of LUAD compared with normal
epithelial cells.
(2) Visualize Single-cell Expression
Using the UMAP Explorer, researchers can visualize
the integrated single-cell atlas of lung cancers, showing cell clustering by cell type
alongside HERVK13-int expression. The TE-level UMAP reveals strong HERVK13-int expression in
primary tumor cells, with elevated expression also detected in a subset of macrophages.

(3) Examine Expression across Tumor Stages
The Differential TE Expression across Tumor
Stages table and accompanying heatmap demonstrate sustained high expression of HERVK13-int
in stage I tumor cells, suggesting activation early in tumor progression.
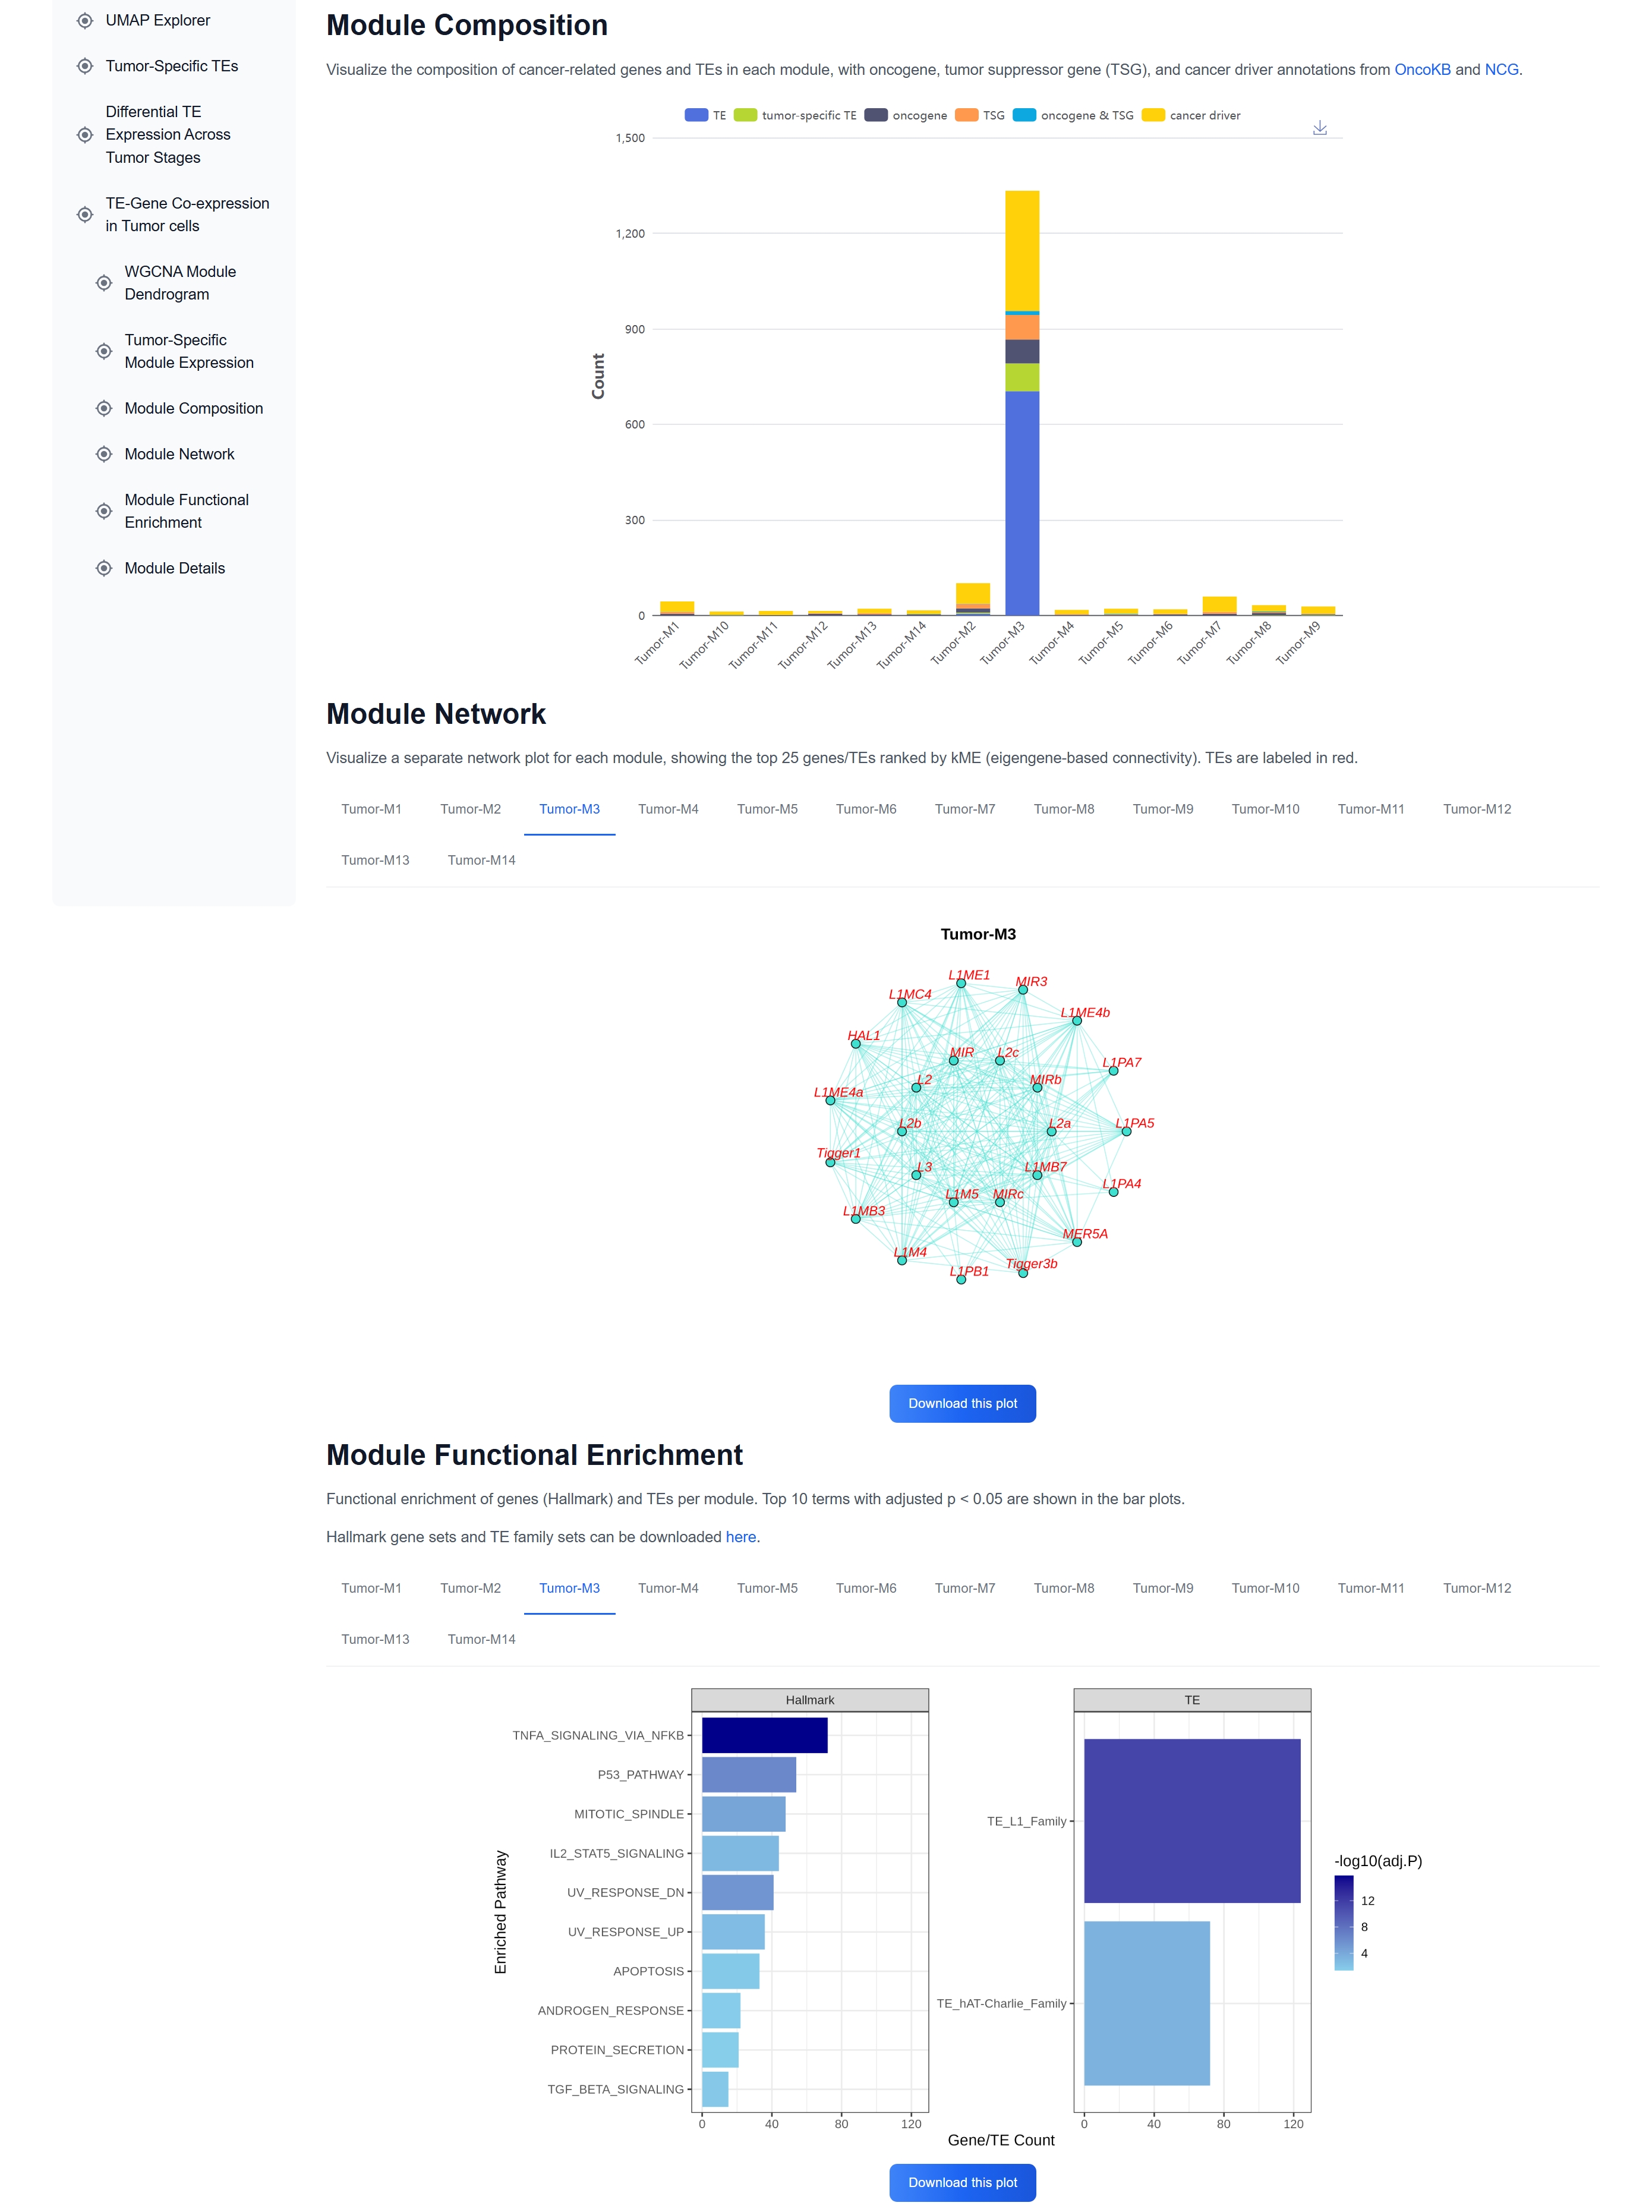
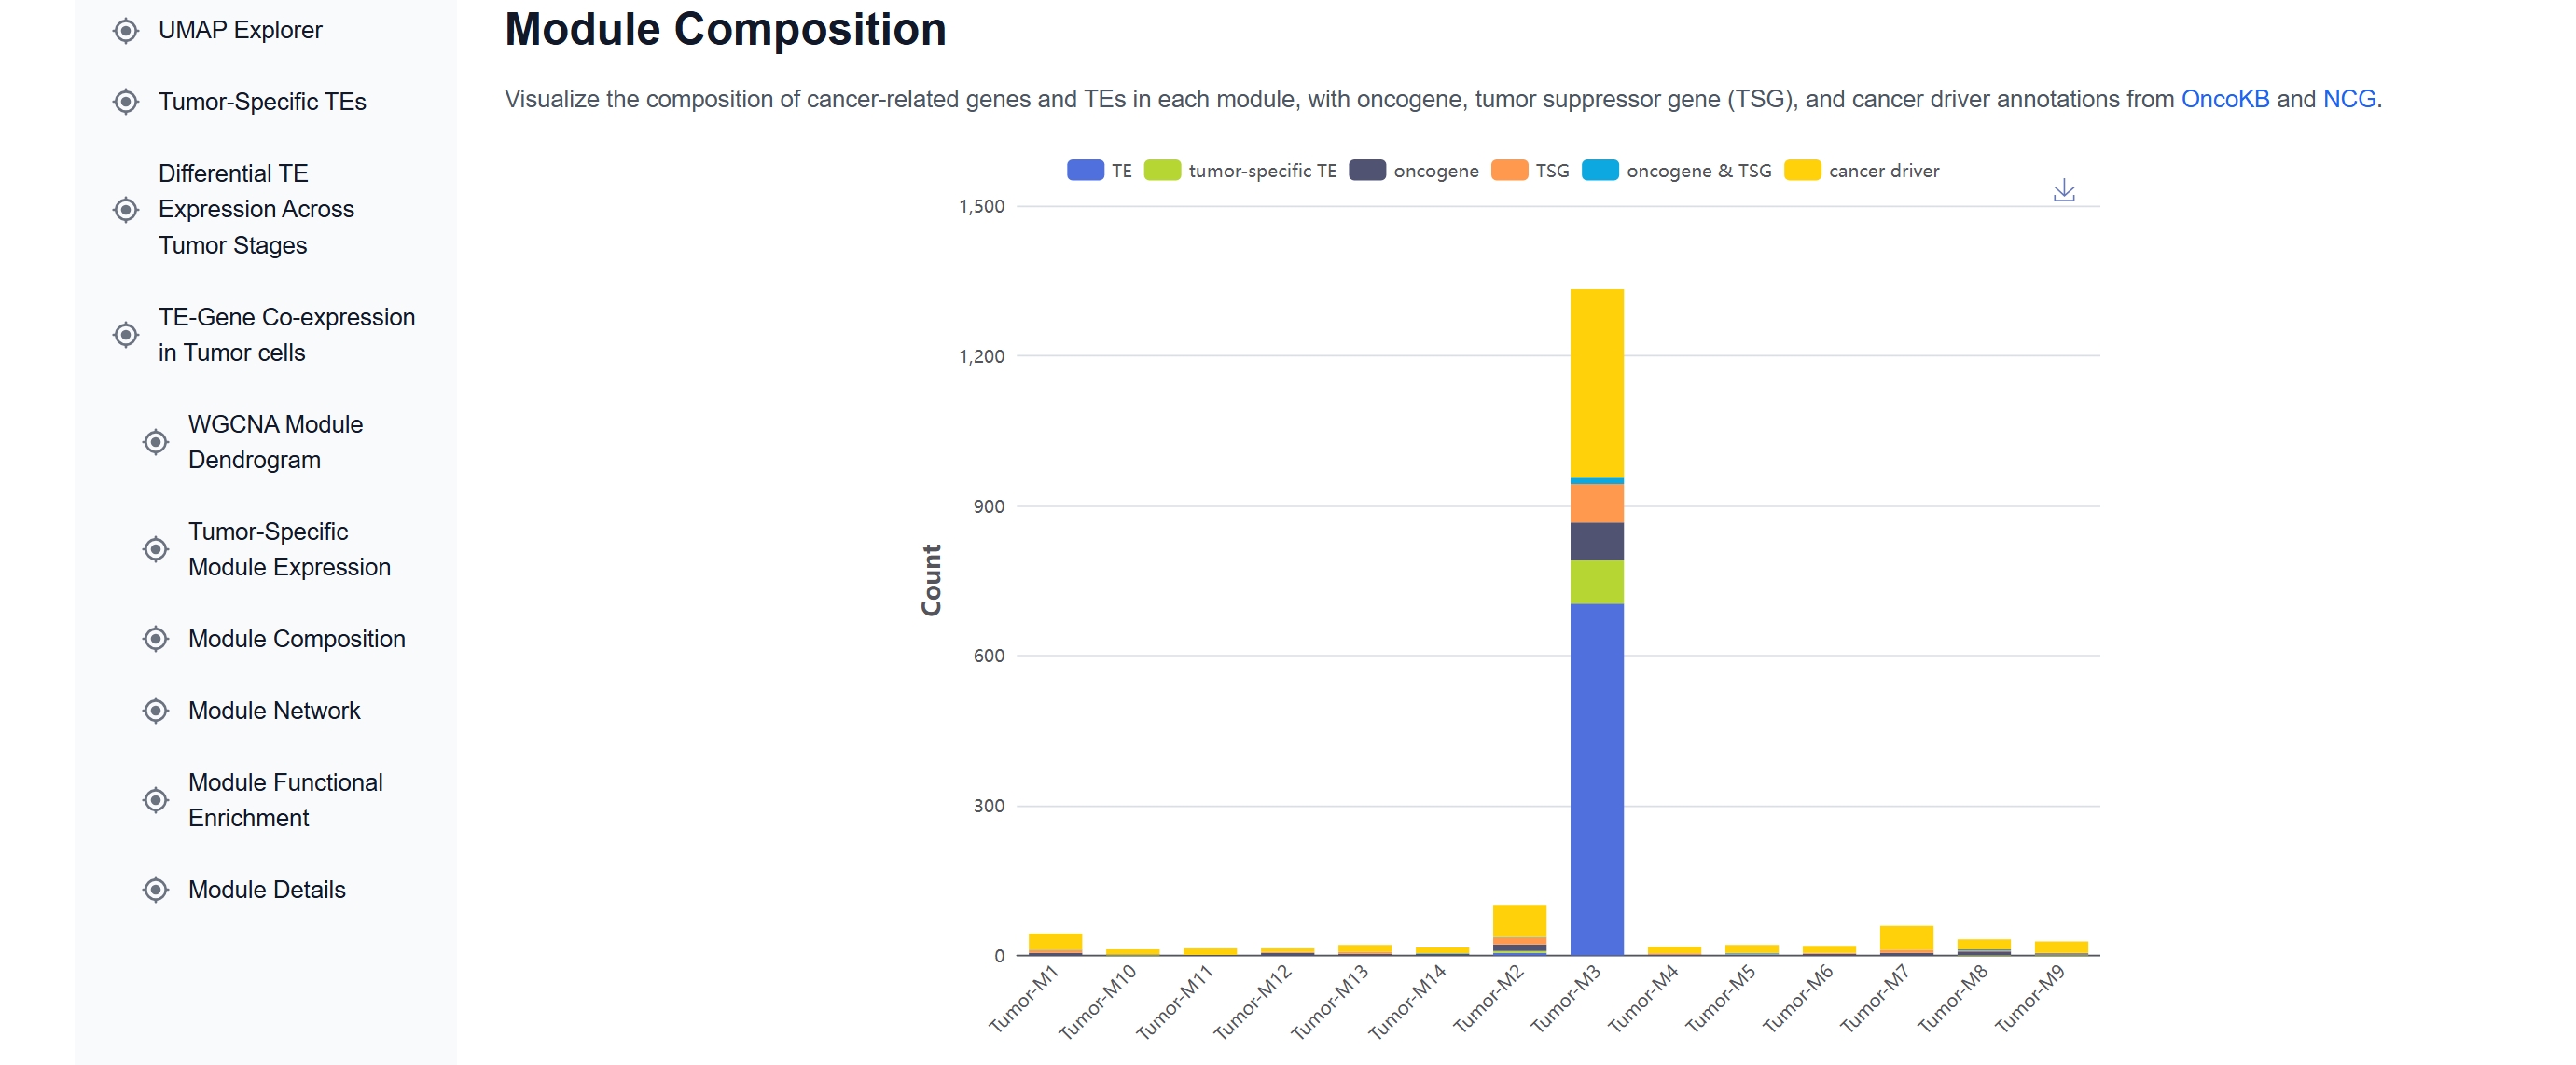
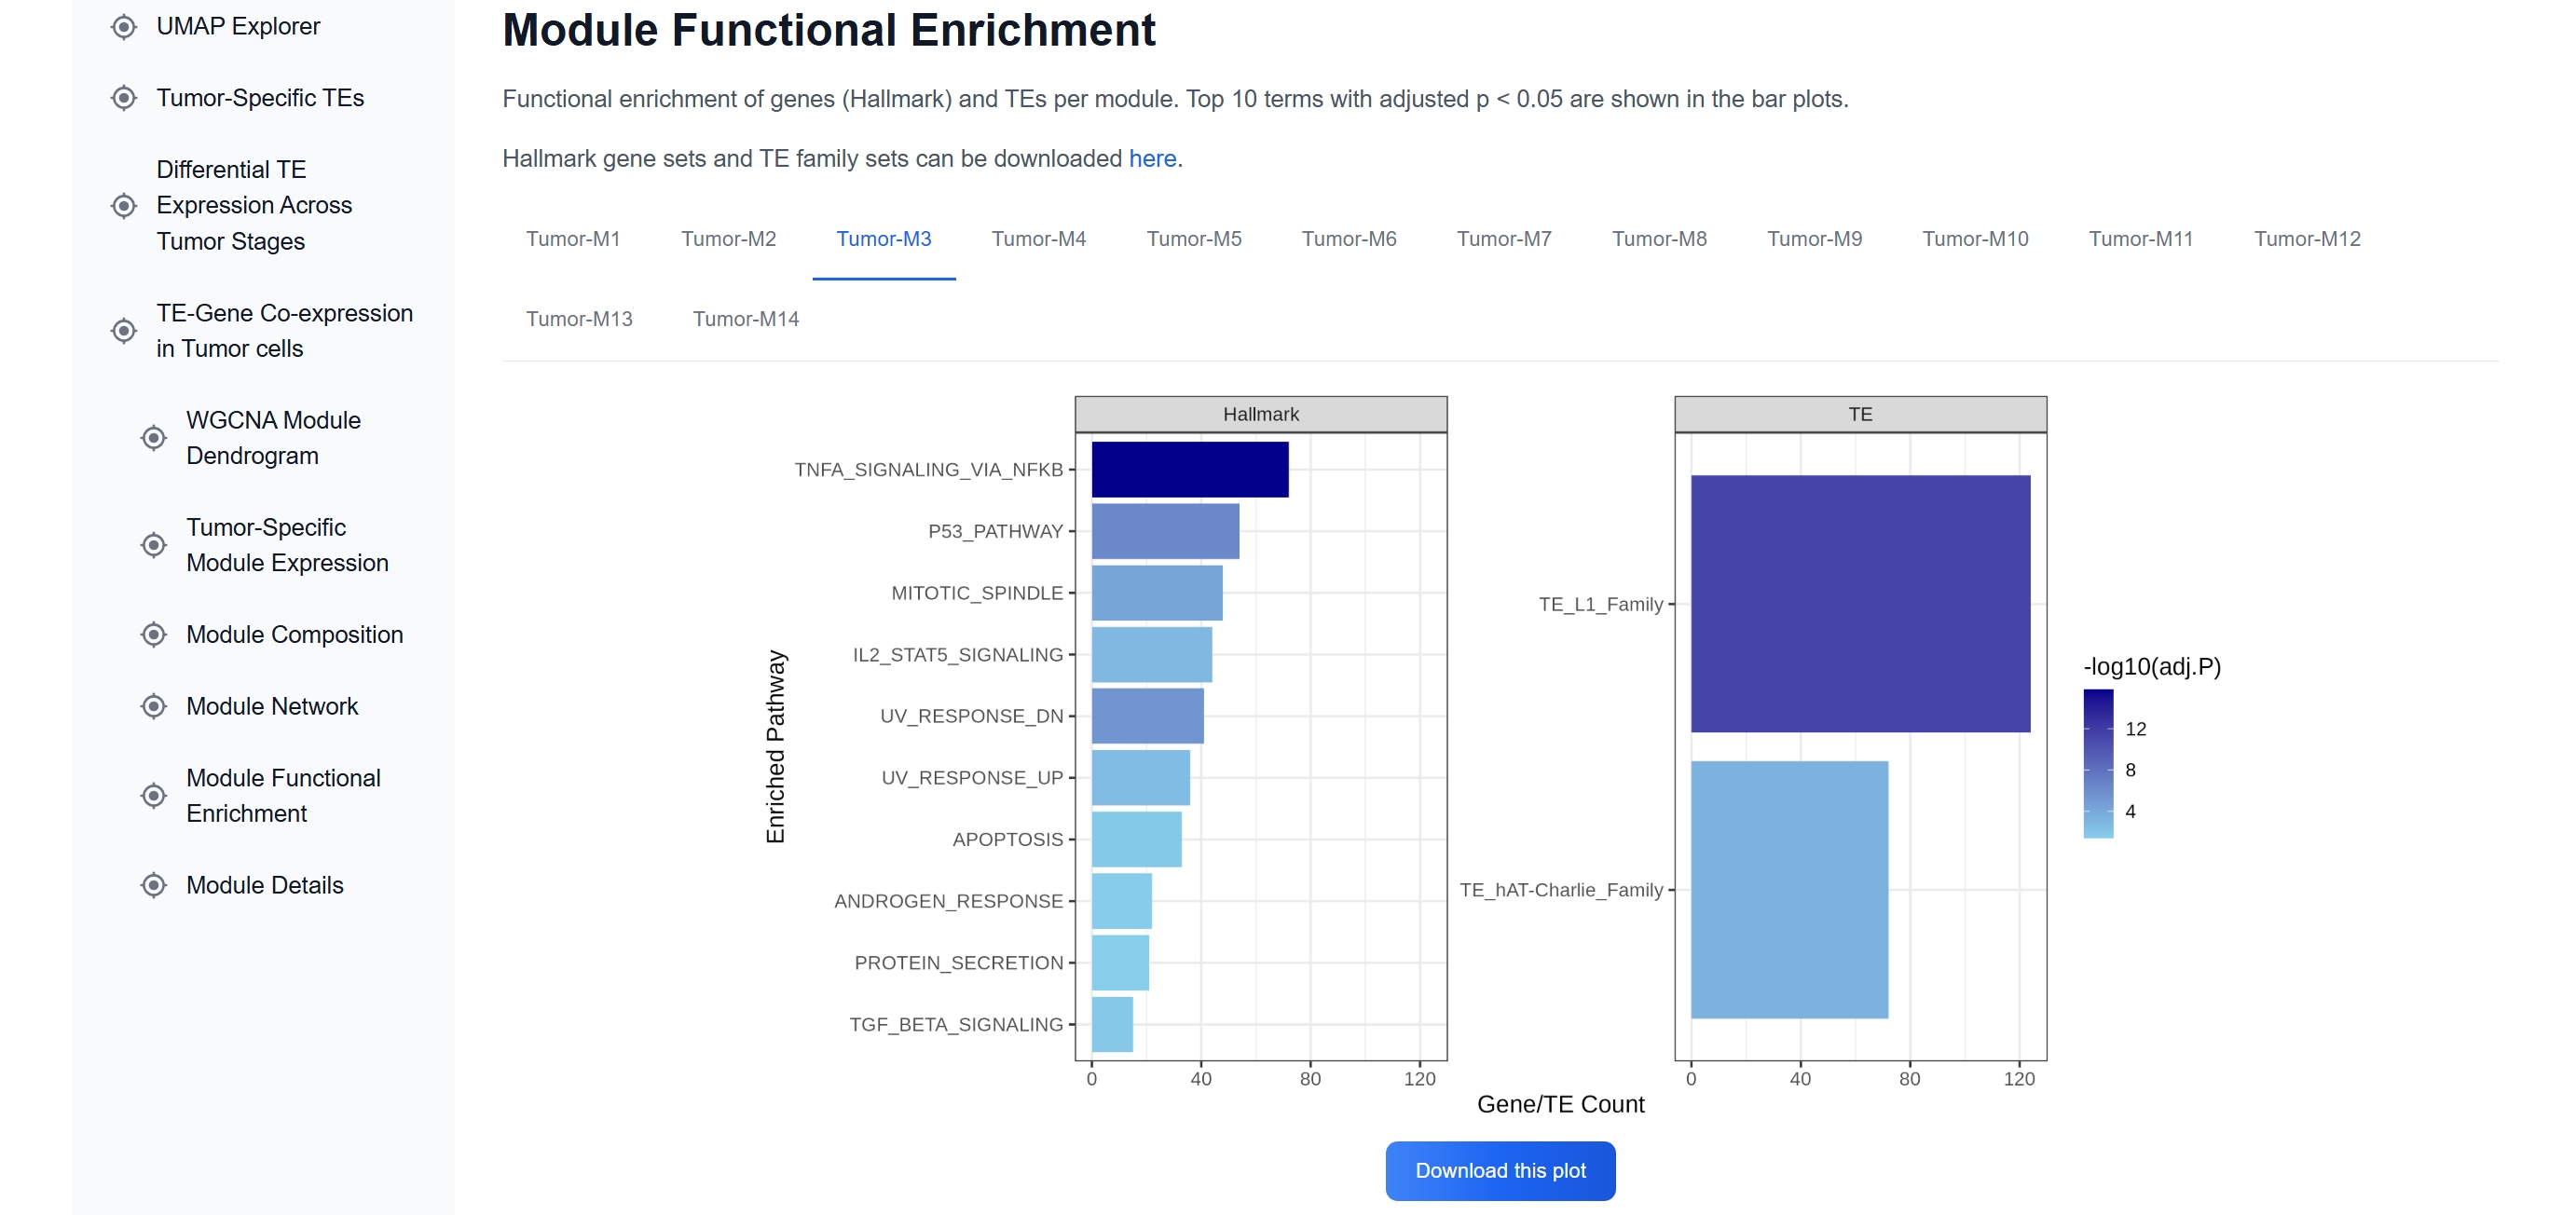
(4) Explore TE-gene Co-expression Modules
In the TE-Gene Co-expression in Tumor Cells
section, WGCNA identifies 14 gene-TE co-expression modules. HERVK13-int is included in
Tumor-M3, which contains ~18.9% cancer-related genes.

Researchers can further investigate genes correlated with a specific TE using the TE-Gene Correlation feature on the TE detail page.
(5) Assess Functional Enrichment
Functional enrichment analysis of Tumor-M3 reveals
significant involvement of TNFα-NFκB signaling, the p53 pathway, and apoptosis, consistent
with early immune-related activation in tumor cells.
Tumor-specific activation of HERVK13-int in early-stage LUAD highlights it as a potential early diagnostic biomarker and suggests a role in tumor-immune interactions.