Sample detail
Basic Information
Cell Type Composition
TE Expression across Cell Types
Explore TE expression across cell types by viewing feature and UMI counts. You can focus on all TEs or filter by selected TE classes (DNA, LINE, LTR, Retroposon, SINE) and families (L1, Alu, ERVK, SVA).
UMAP
Visualize cell clustering with two feature sets: Gene + TE and TE only.
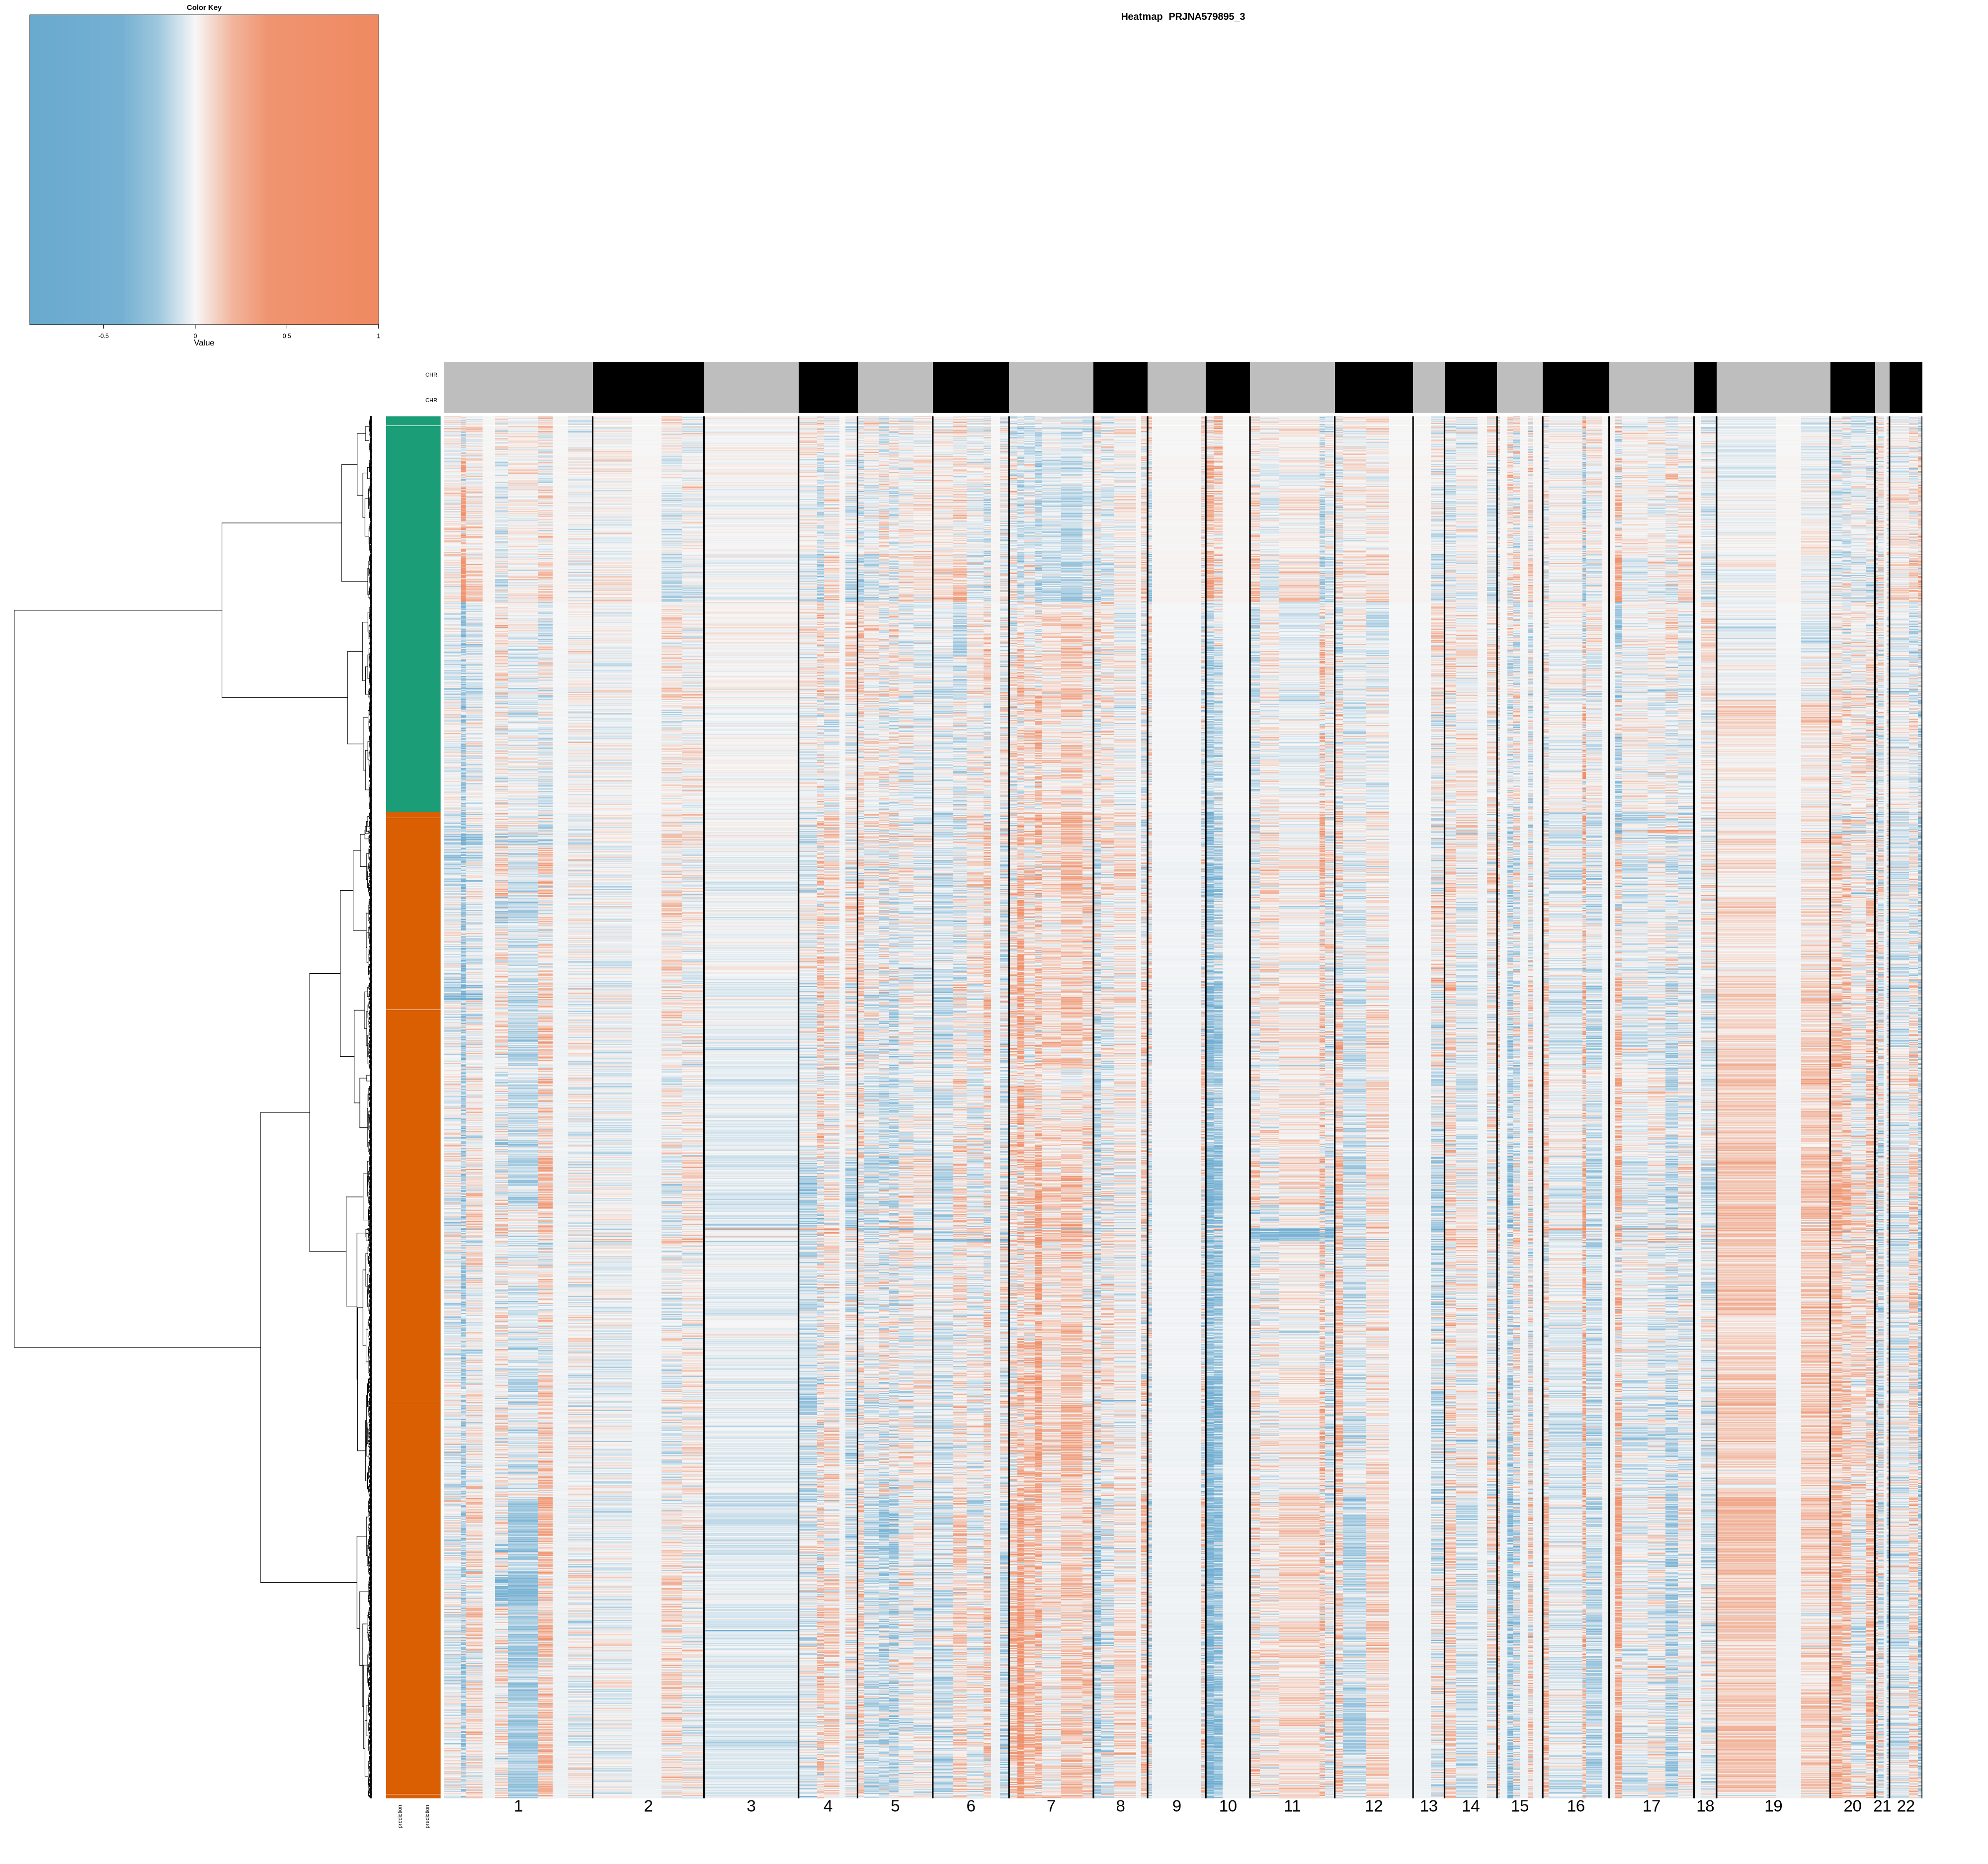
Copy Number Variation
Heatmap of the copy number alteration matrix for tumor cell classification. Rows are cells, columns are genomic positions. Orange = aneuploid (tumor), green = diploid (normal).
Differential Expression
GSVA Enrichment
GSVA-based enrichment using MSigDB Hallmark gene sets and UCSC rmsk TE family annotation. Heatmap shows enrichment scores across cell types; differential t-value plot highlights pathway differences.
Hallmark gene sets and TE family sets can be downloaded here.