iDog provides online data visualization and various data analysis tools for iDog Users.
The DogRAG uses Retrieval-Augmented Generation (RAG) technology to embed customized data into Large Language Models (LLMs), specializing them and reducing hallucinations.
Our approach involves:
1) Constructing a vector search database using Elastic Search, based on breed, disease, variants, gene, and gene expression profiles from iDog 2.0.
2) Transforming input questions into vectors using a LLM.
3) Executing vector searches using Elastic Search to retrieve relevant information.
4) Building a knowledge graph database with housed data from iDog to enhance search results.
5) Parsing keywords from queries and searching the knowledge graph.
6) Combining results from both searches and using them as context for the LLM to summarize a final answer.
The overall architecture of DogRAG integrates these steps to provide accurate and specialized responses.
The whole architecture as follows.

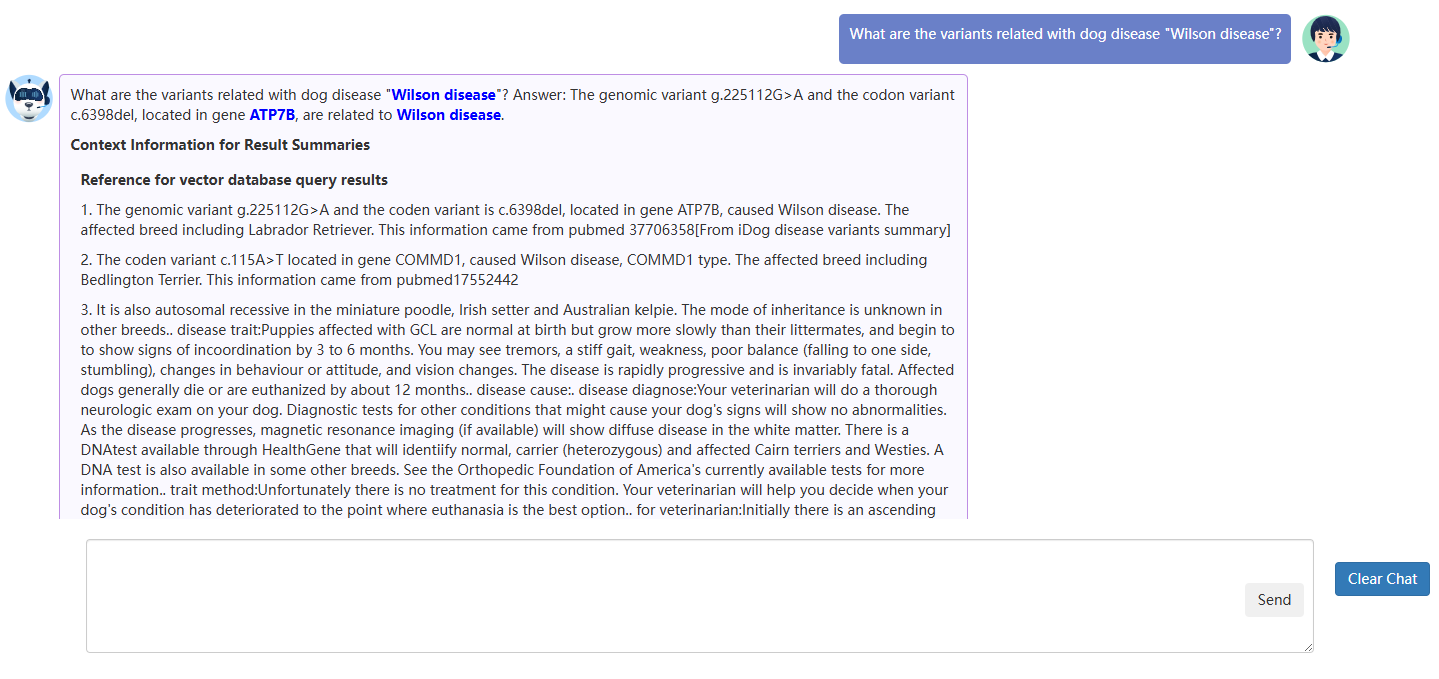
A usage example:
When looking for information about Wilson disease, users can simply ask: 'What is Wilson disease?' The model will respond with a brief introduction and relevant genes associated with this disease, such as ATP7B. Furthermore, questions like 'What are the variants related to Wilson disease in dogs?' or 'Introduce the functions about gene ATP7B' provide more detailed insights. Additionally, information about the diseases and genes on the website can be easily accessed by clicking the hyperlinks.
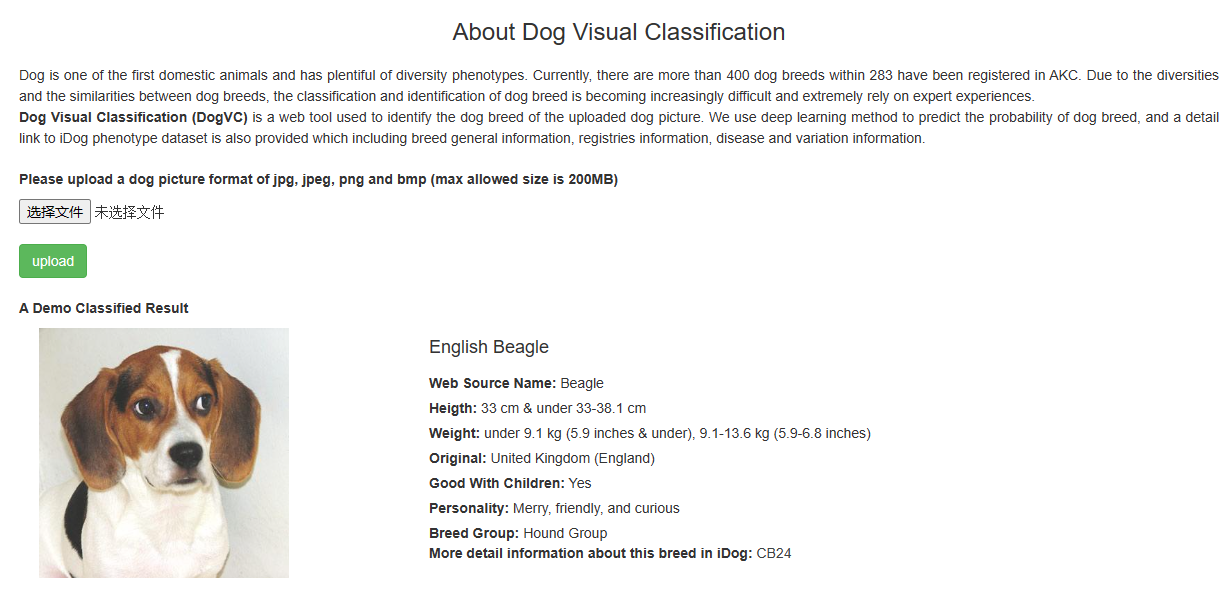
Dog Visual Classification (DogVC) is a web tool used to identify the dog breed of the uploaded dog picture. We use deep learning method to predict the probability of dog breed, and a detail link to iDog phenotype dataset is also provided which including breed general information, registries information, disease and variation information.
A usage example:
During diagnosis, veterinarians may need to identify a dog’s breed to understand its genetics and potential health risks. By uploading a photo to DogVC, they receive breed metadata along with a link to a detailed webpage. This page lists common diseases associated with the breed, and clicking on a disease name provides information on inheritance mode, symptoms, disease causes, diagnosis, treatments, breeder advice, affected breeds, genetic variants, and differential gene expression profiles, thereby supporting veterinarians in their diagnostic and treatment efforts.
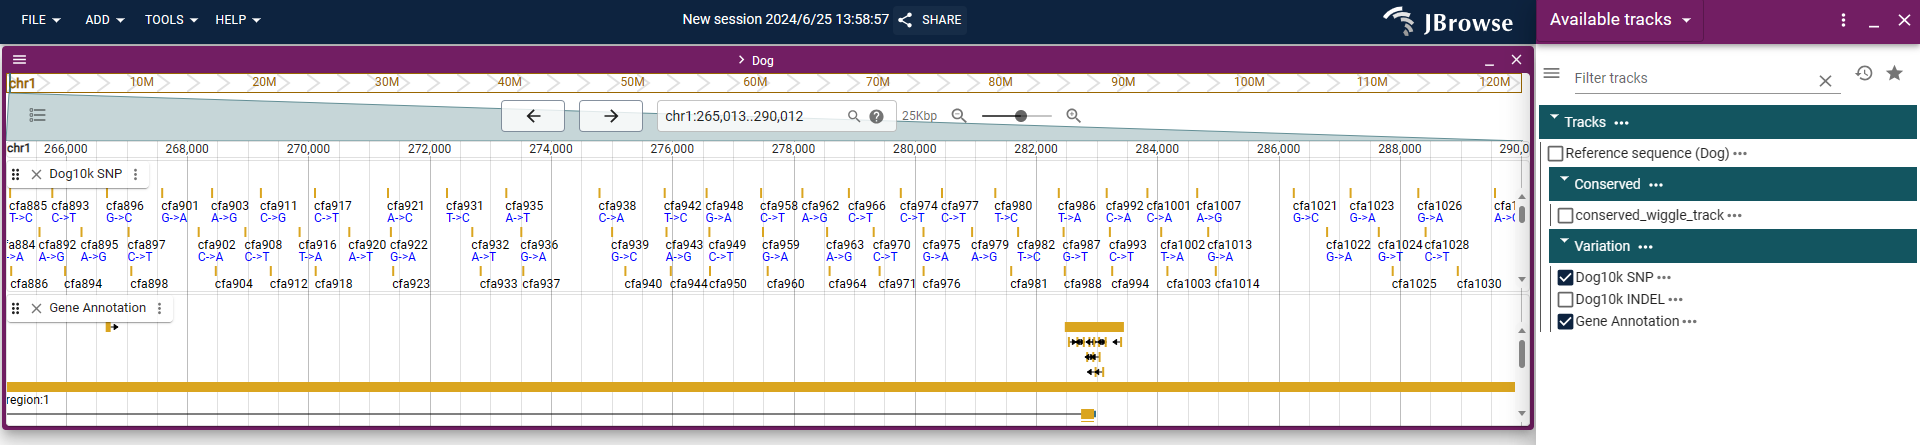
iDog uses JBrowse for data visualization. Users can visualize the SNP, InDel,gene,methylation.
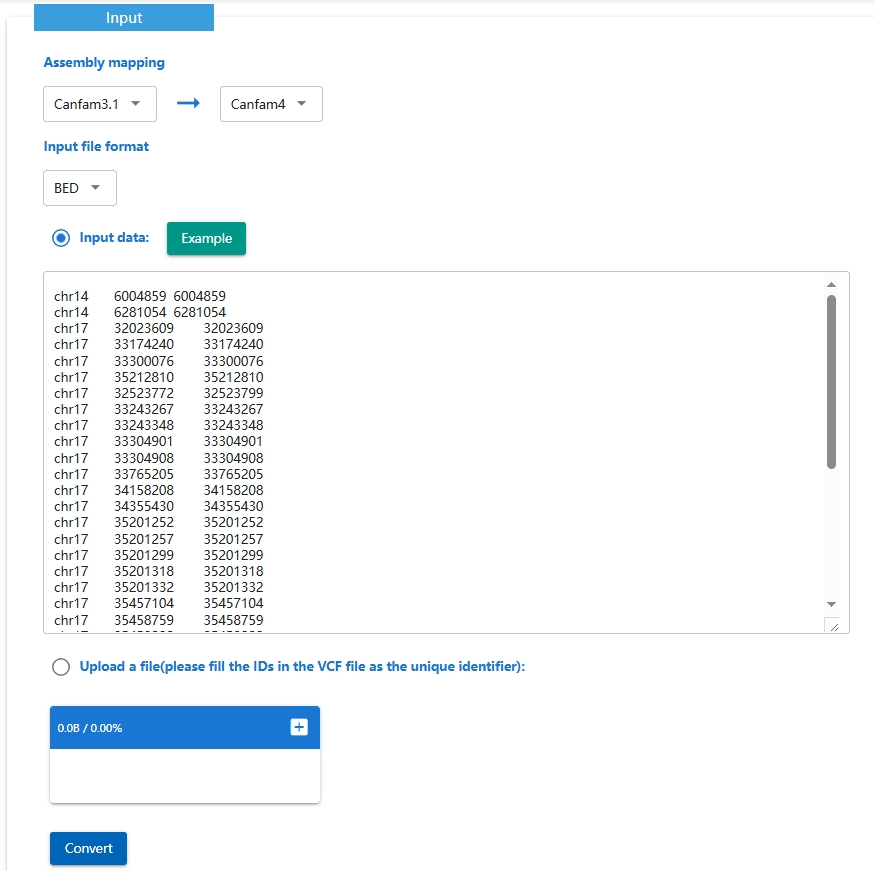
The Assembly converter allows you to convert genome coordinates between multiple dog's reference genomes.
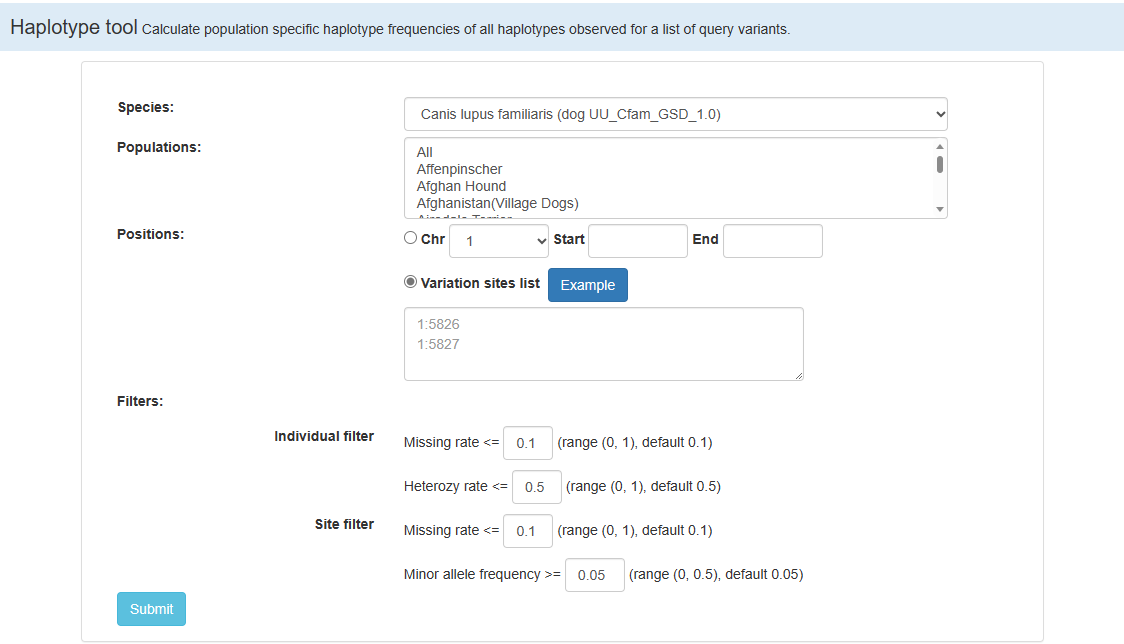
Haplotype tool Calculate population specific haplotype frequencies of all haplotypes observed for a list of query variants.
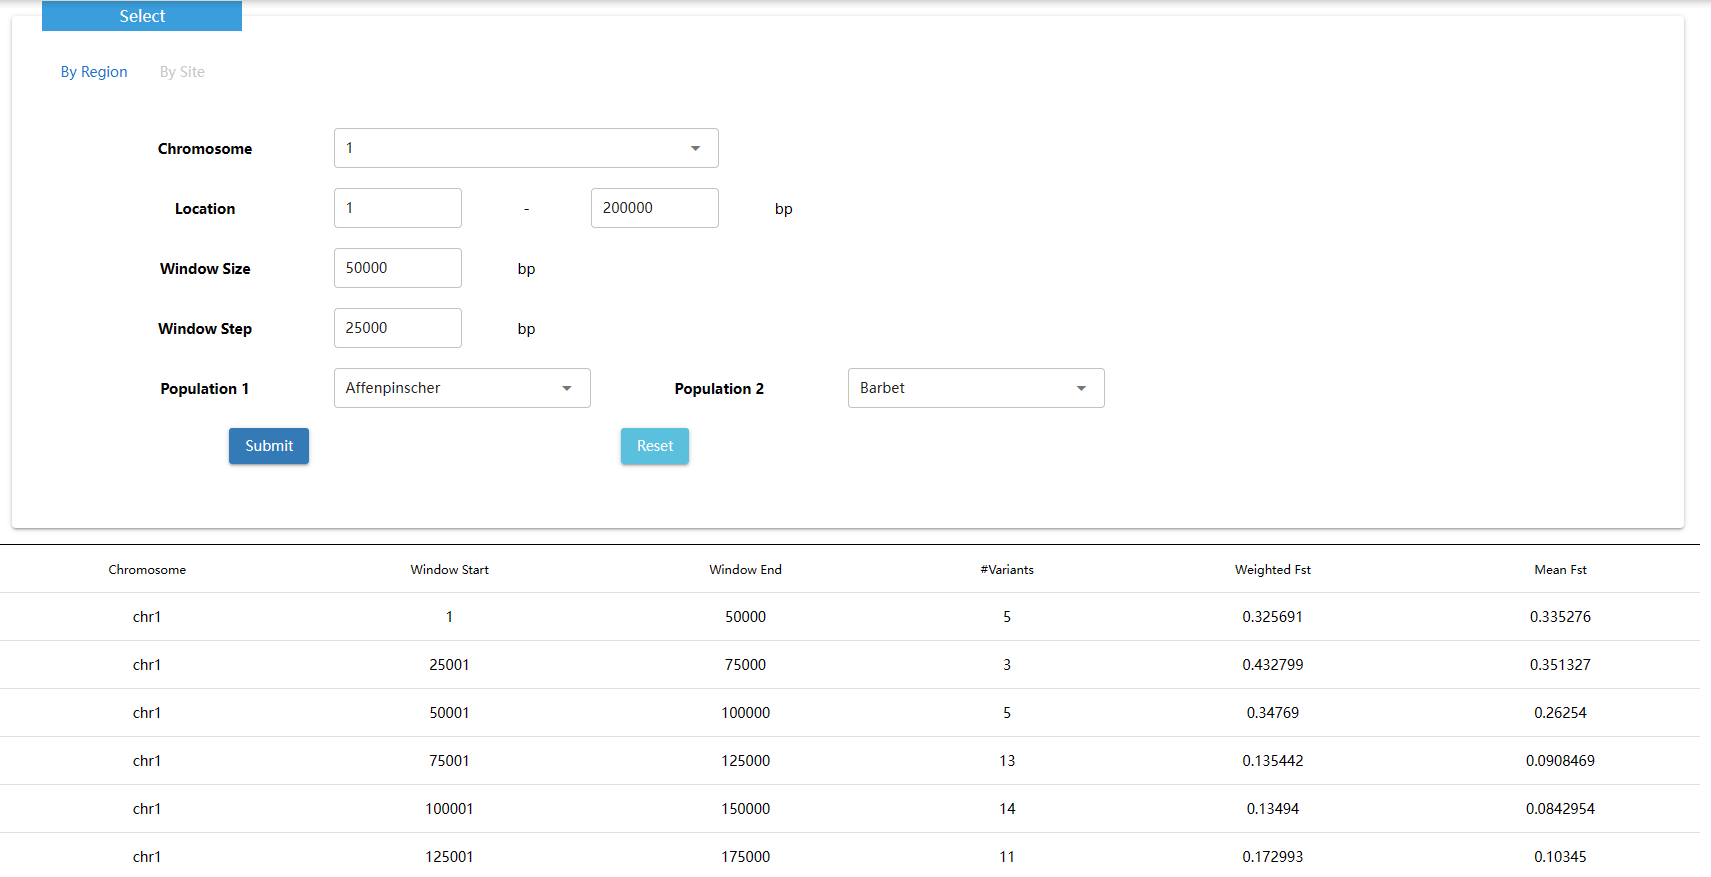
The fixation index (FST) is a measure of population differentiation due to genetic structure. It is frequently estimated from genetic polymorphism data, such as single-nucleotide polymorphisms (SNP) or microsatellites. Developed as a special case of Wright's F-statistics, it is one of the most commonly used statistics in population genetics. Its values range from 0 to 1, with 0.15 being substantially differentiated and 1 being complete differentiation.
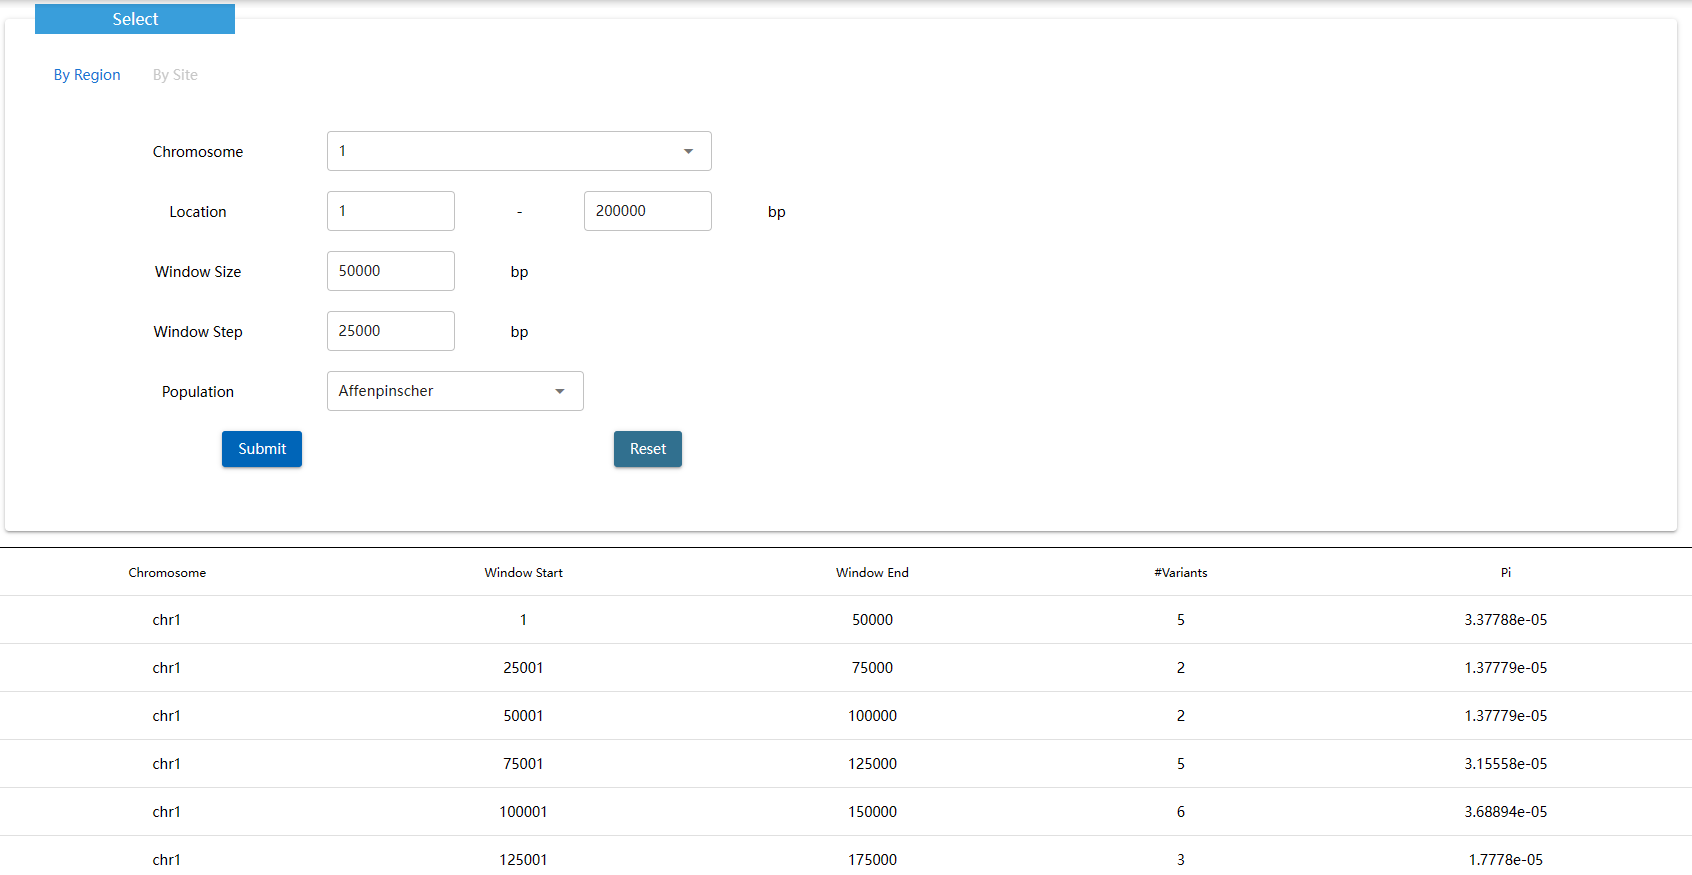
Pi is a concept in molecular genetics that measures the degree of polymorphism within a population.The statistics can be used to monitor diversity within or between ecological populations, examine genetic variation in crops and related species, or determine evolutionary relationships.The higher the value, the higher the nucleotide diversity, and the lower the value, the smaller the DNA sequence difference between the two seats.
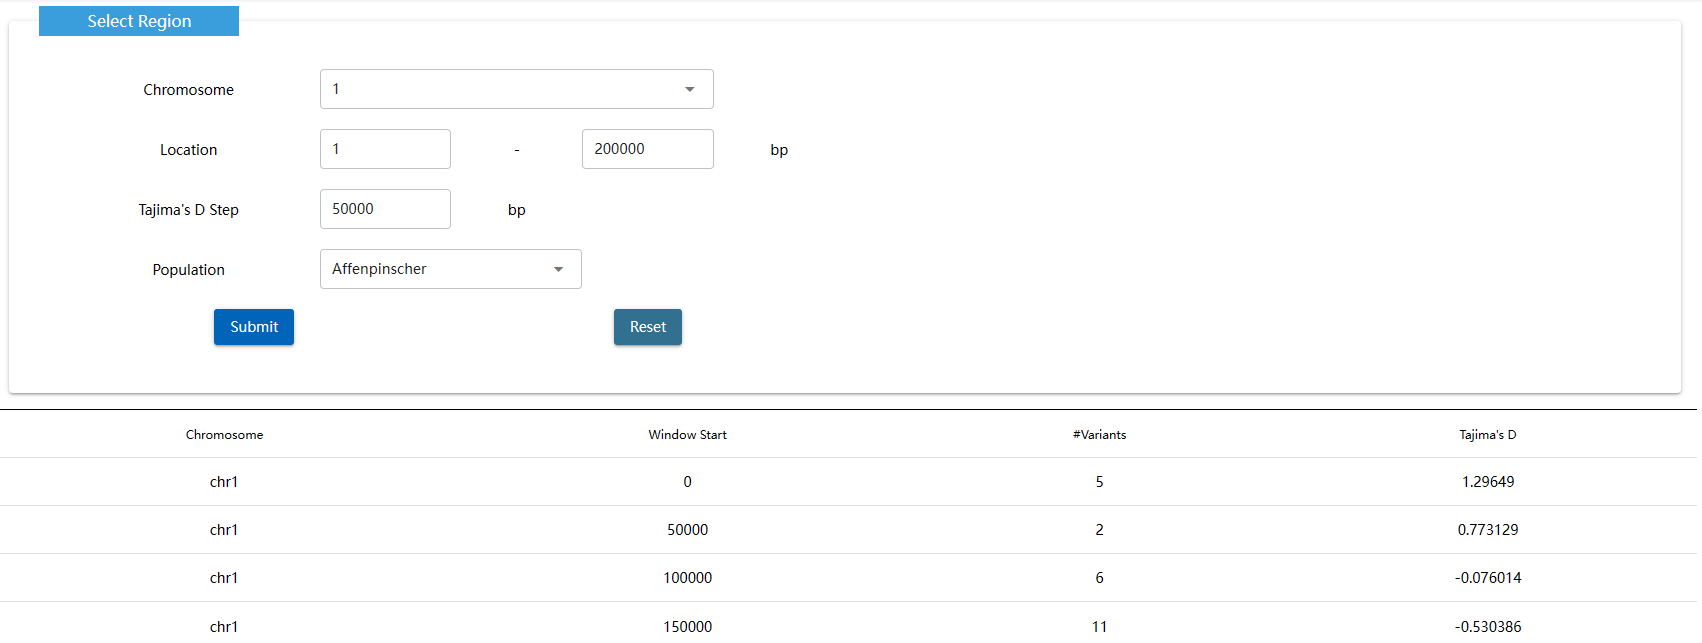
Tajima's D is a population genetic test statistic created by and named after the Japanese researcher Fumio Tajima.Tajima's D is computed as the difference between two measures of genetic diversity: the mean number of pairwise differences and the number of segregating sites, each scaled so that they are expected to be the same in a neutrally evolving population of constant size.
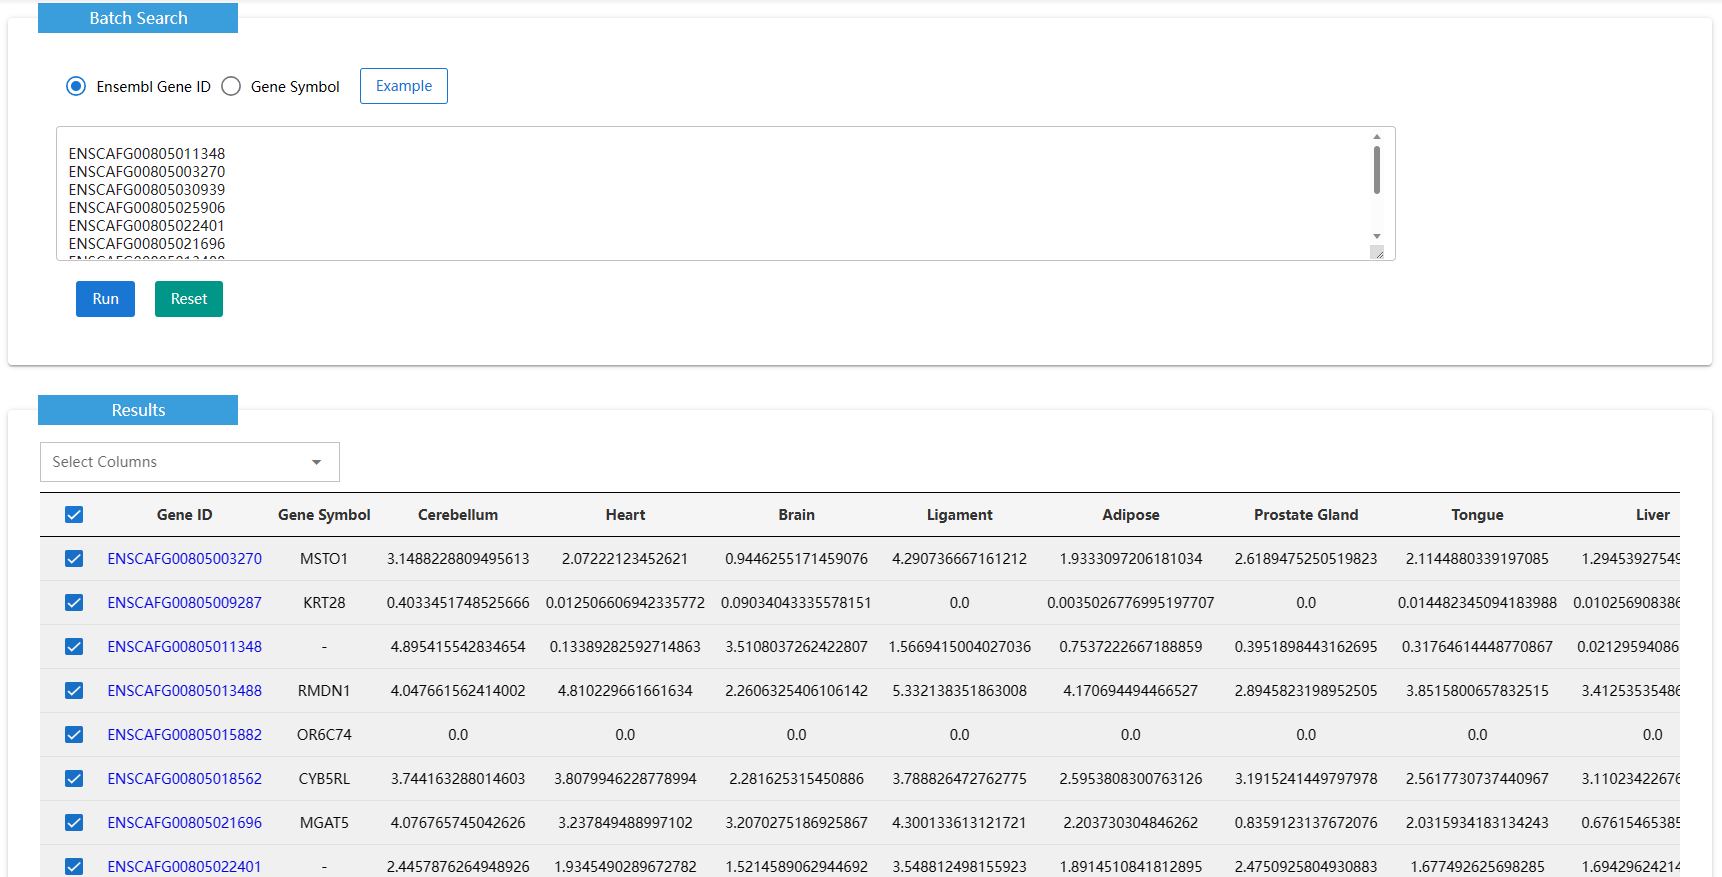
ExpPattern draws the gene-tissue expression heat map for input genes and estimate the tissue specific level.
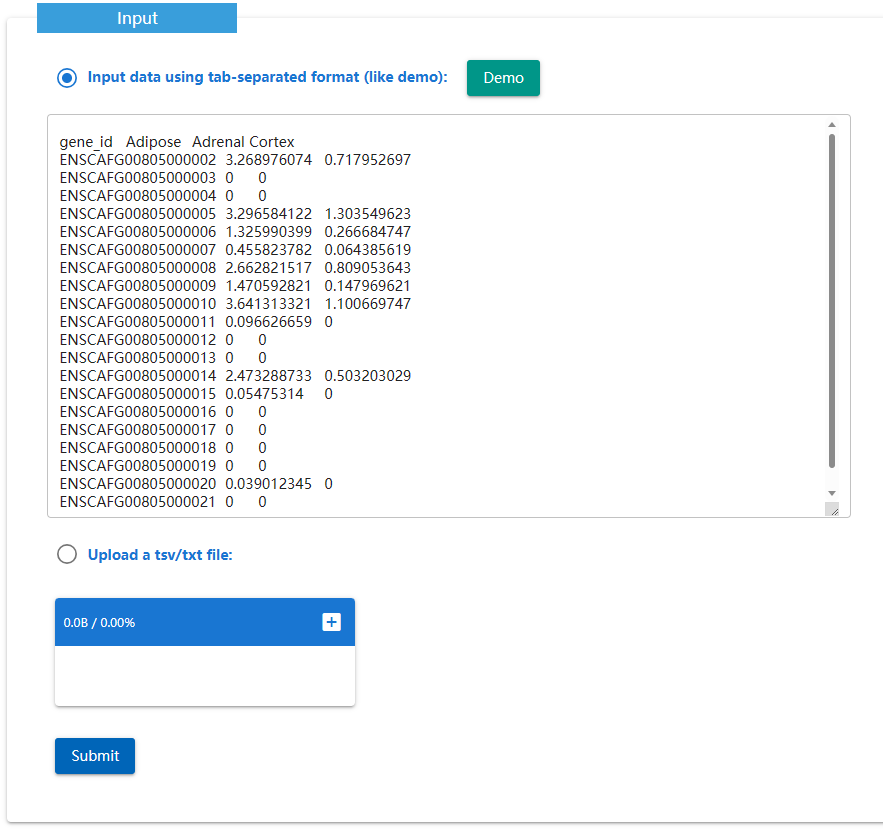
The Expression Normalization Tool is to normalize the COUNT/TPM/FPKM value using the formula "log2(value + 1)".
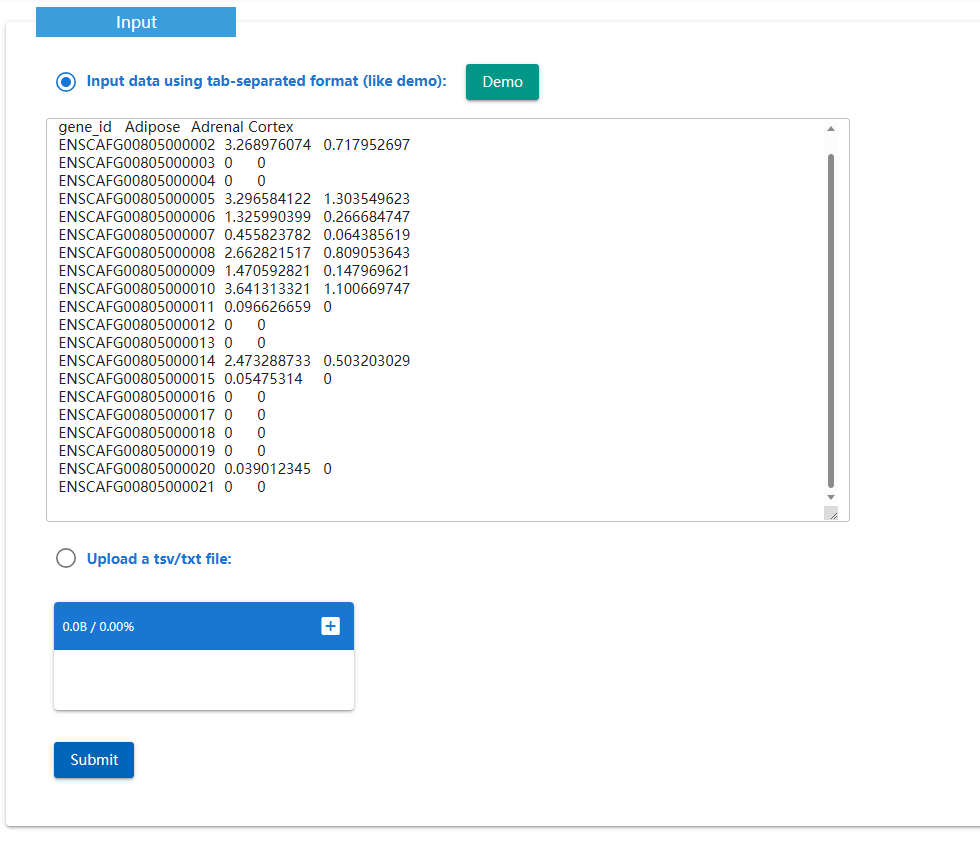
The Expression Standardization Tool is to calculate the Z-score.
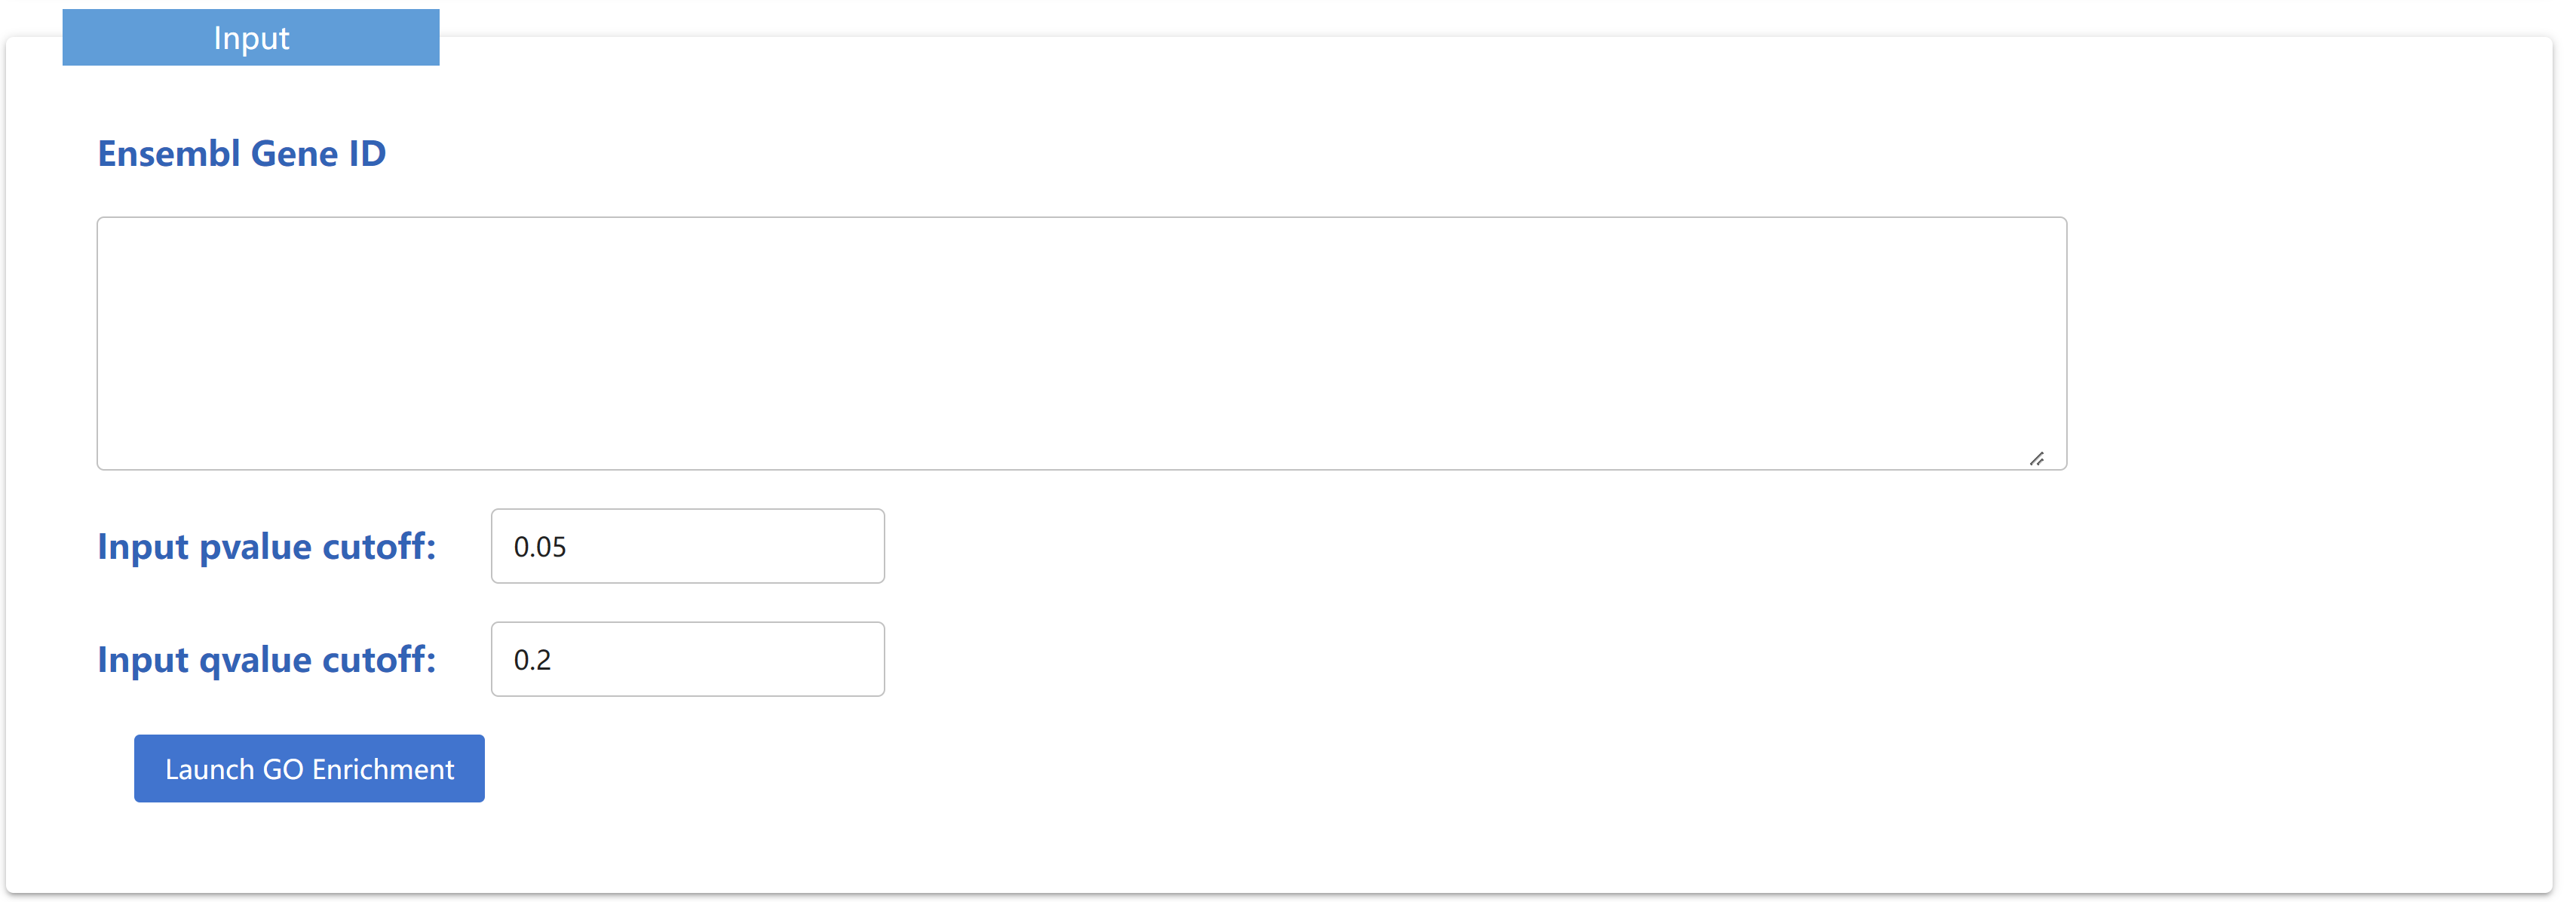
GO Enrichment is used to perform GO enrichment analysis on selected genes of Dog(UU_Cfam_GSD), and the analysis results are displayed in the form of tables and figures
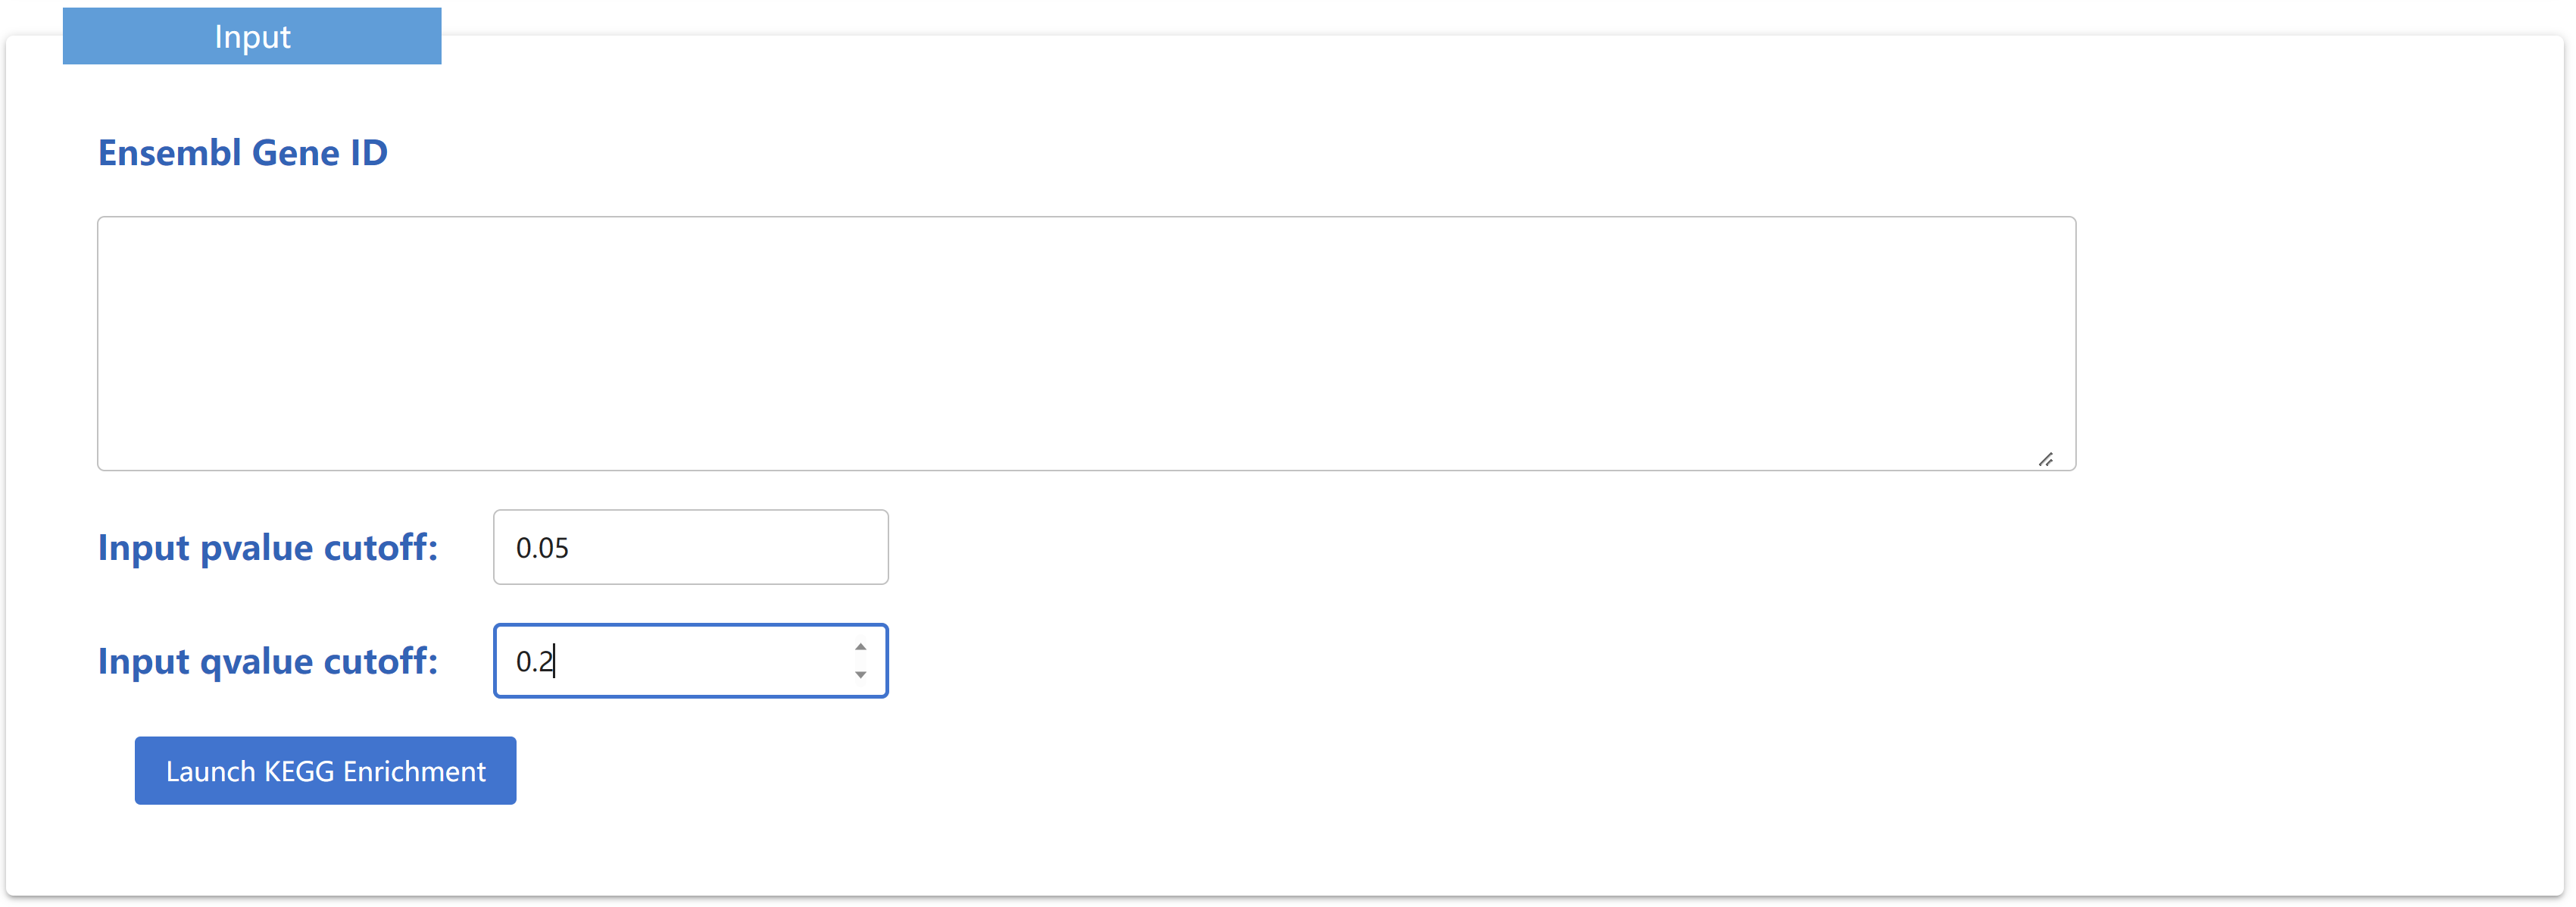
KEGG Enrichment is used to perform KEGG enrichment analysis on selected genes of Dog(UU_Cfam_GSD), and the analysis results are displayed in the form of tables and pictures. The kegg annotation is obtained using EGGNOG-mapper.